Fig. 4
Download original image
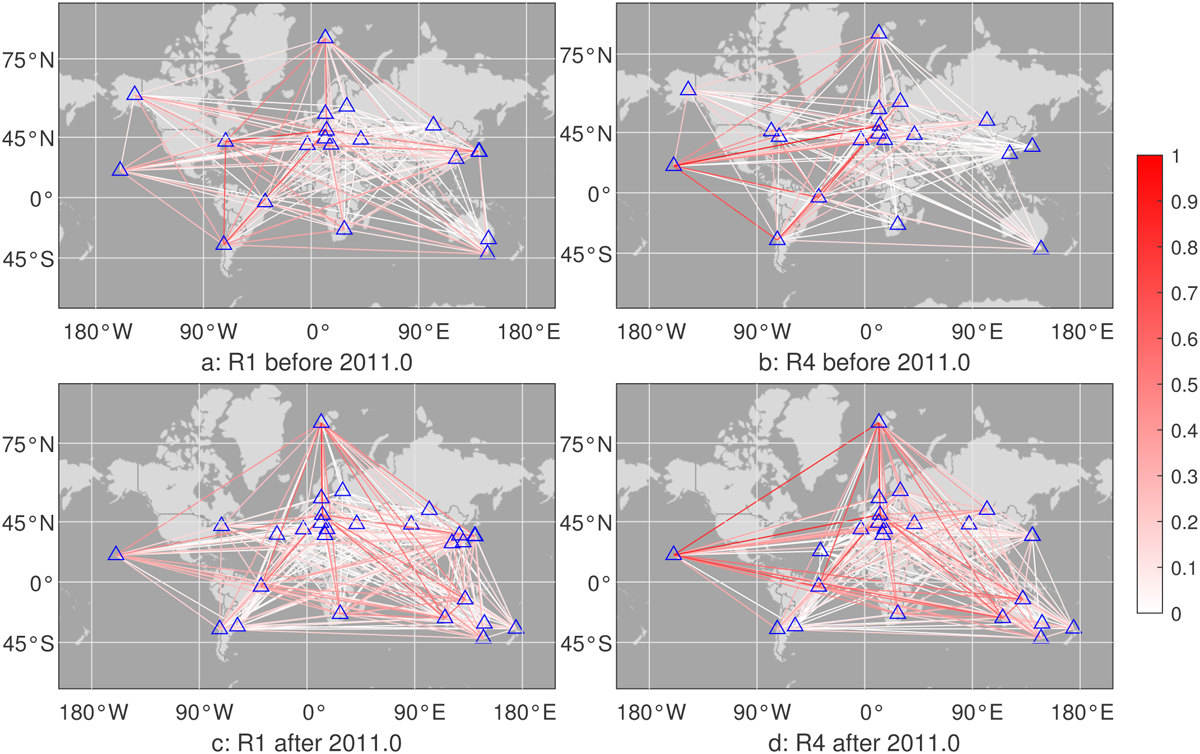
Station distributions of (a) IVS-R1 before 2011.0, (b) IVS-R4 before 2011.0, (c) IVS-R1 after 2011.0, and (d) IVS-R4 after 2011.0. The blue triangles represent the stations. The color of the baseline shows its working frequency calculated as n/nmax, where n is the working times of the baseline and nmax is the total observation number.
Current usage metrics show cumulative count of Article Views (full-text article views including HTML views, PDF and ePub downloads, according to the available data) and Abstracts Views on Vision4Press platform.
Data correspond to usage on the plateform after 2015. The current usage metrics is available 48-96 hours after online publication and is updated daily on week days.
Initial download of the metrics may take a while.