Open Access
Fig. 2
Download original image
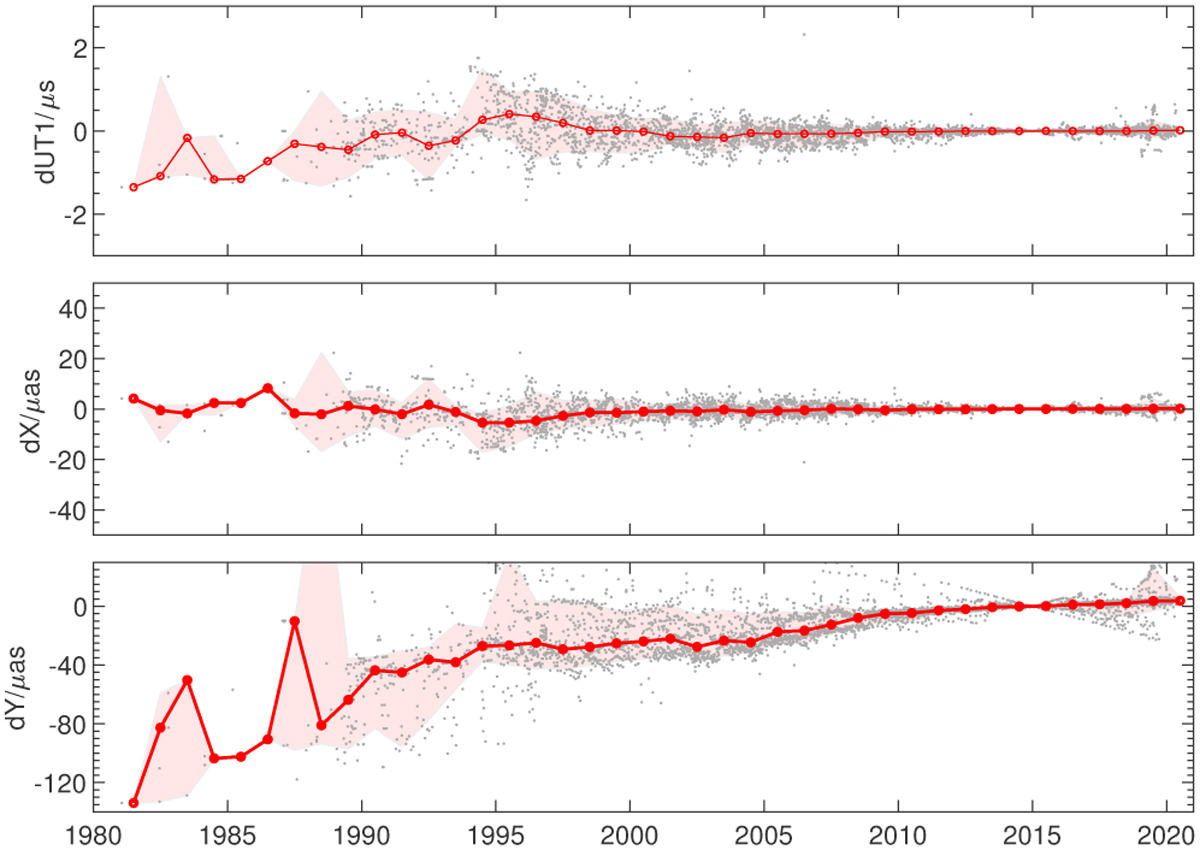
Theoretical influence of GA effect on dUT 1, dX, and dY. The gray points represent the influence on each session and the red lines are the median value in each year. The pink shadow gives the 10th and 90th quantiles of the data.
Current usage metrics show cumulative count of Article Views (full-text article views including HTML views, PDF and ePub downloads, according to the available data) and Abstracts Views on Vision4Press platform.
Data correspond to usage on the plateform after 2015. The current usage metrics is available 48-96 hours after online publication and is updated daily on week days.
Initial download of the metrics may take a while.