Open Access
Fig. 3
Download original image
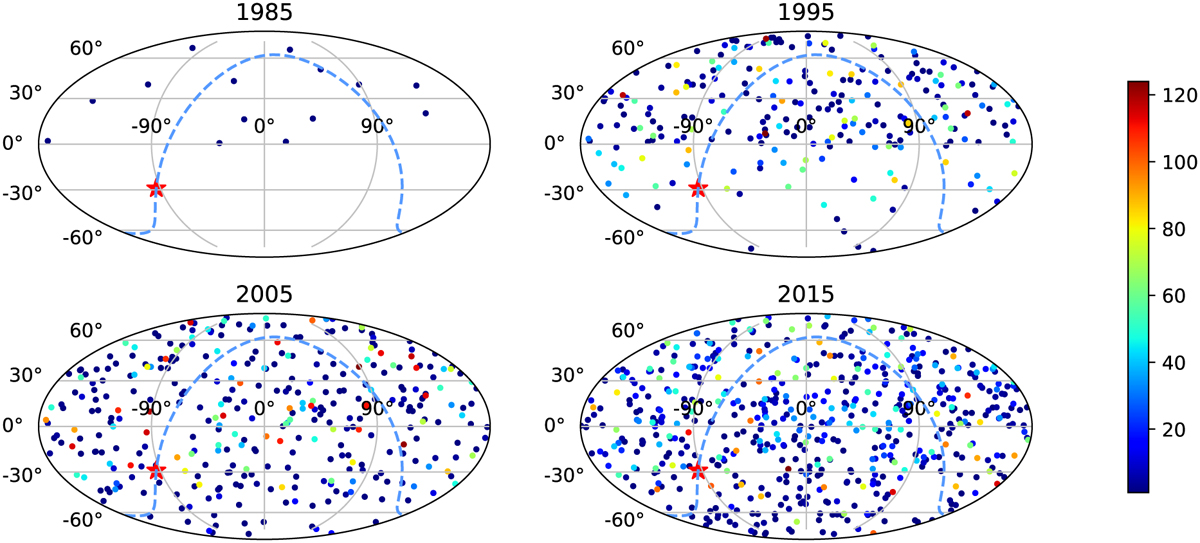
Distribution evolution of VLBI observed sources in equatorial coordinates in 1985, 1995, 2005, and 2015. The color of the points represents the observation times of each source during this time. The red star gives the position of the Galactic center and the blue dashed line is the Galactic plane.
Current usage metrics show cumulative count of Article Views (full-text article views including HTML views, PDF and ePub downloads, according to the available data) and Abstracts Views on Vision4Press platform.
Data correspond to usage on the plateform after 2015. The current usage metrics is available 48-96 hours after online publication and is updated daily on week days.
Initial download of the metrics may take a while.