Fig. 14
Download original image
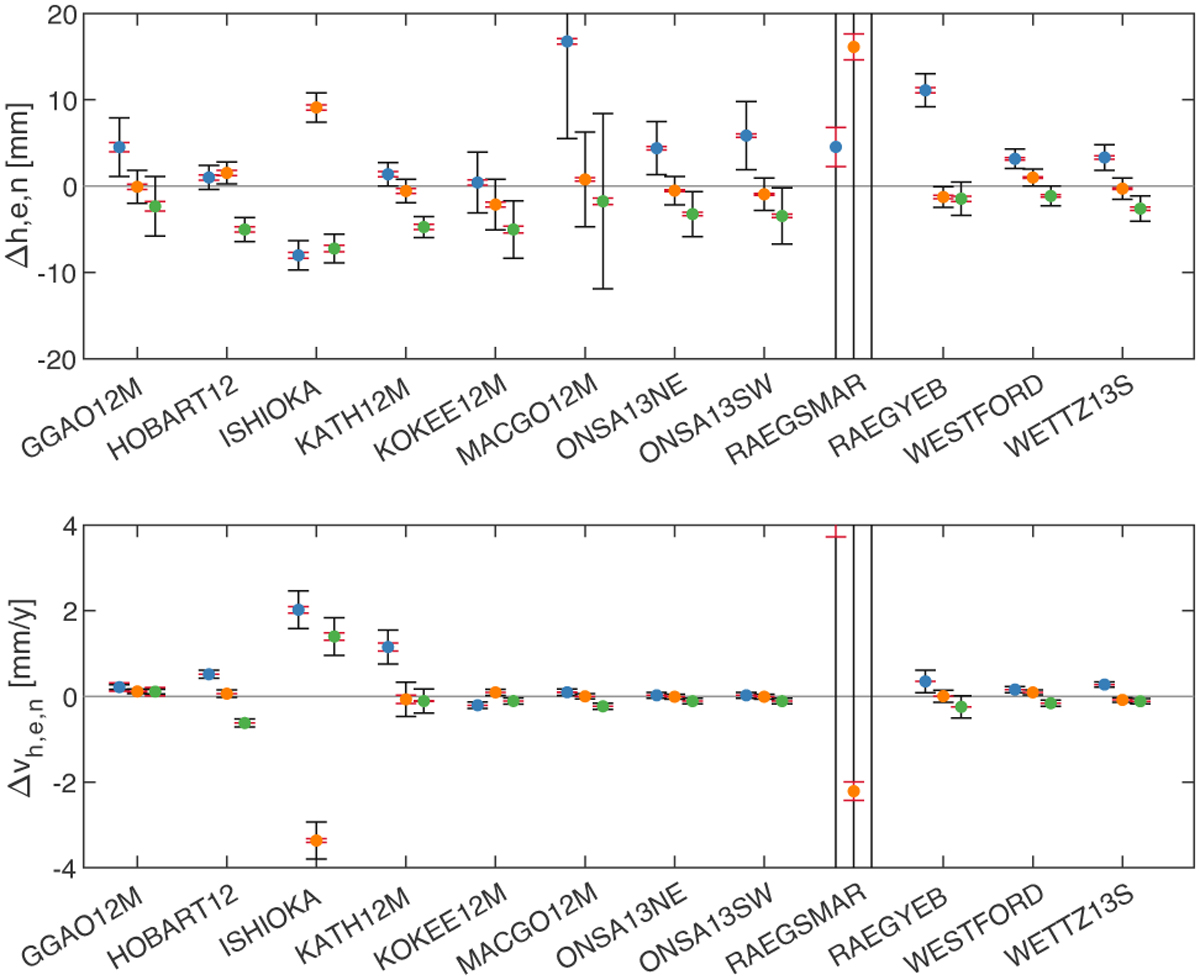
Differences between VIE2023 TRF with respect to ITRF2020 for the VGOS telescopes. The position offset for the reference epoch 2015.0 (upper panel) and the difference in the linear velocity (lower panel) are shown for the height component as blue dots, for the east component as orange dots, and for the north component as green dots. The VIE2023 TRF uncertainties are plotted as red error bars, and the ITRF2020 uncertainties as black error bars. The differences at Sa exceed the y-axis limits (see Table 9 for the exact values).
Current usage metrics show cumulative count of Article Views (full-text article views including HTML views, PDF and ePub downloads, according to the available data) and Abstracts Views on Vision4Press platform.
Data correspond to usage on the plateform after 2015. The current usage metrics is available 48-96 hours after online publication and is updated daily on week days.
Initial download of the metrics may take a while.