Fig. 2
Download original image
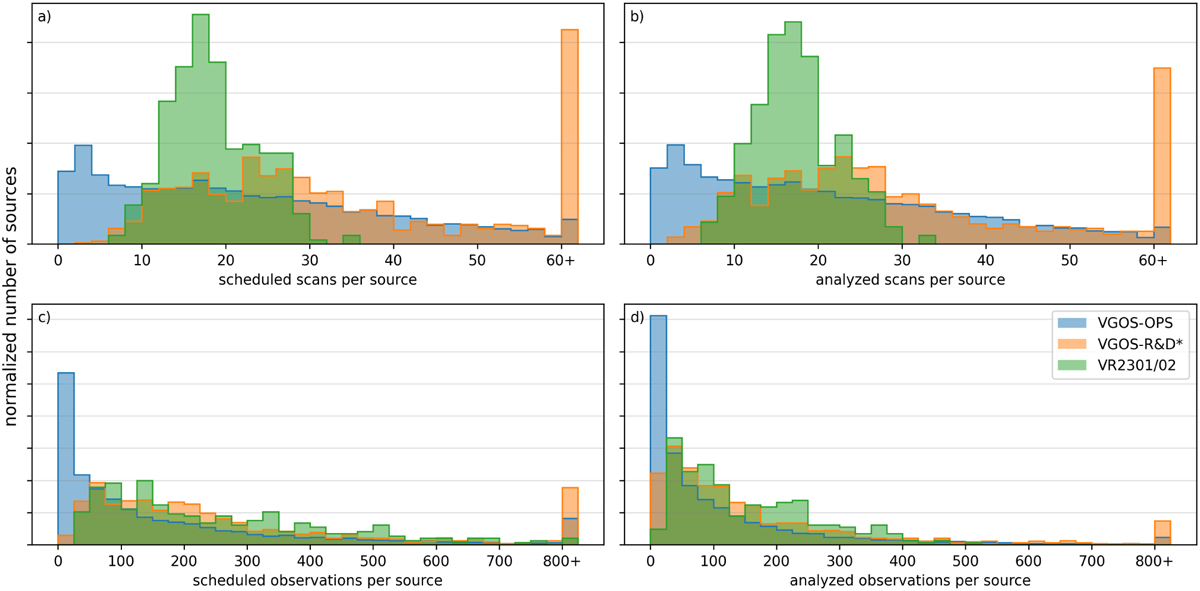
Histograms with distribution of scans (upper panels) and of observations (lower panels) per source based on the generated schedules (left panels) and on the performed good observations (right panels). The histograms are generated separately from VGOS-OPS (blue), VGOS-R&D without VR2301 and VR2302 (orange), and only for VR2301 and VR2302 (green). The normalized number of sources means that the total area under each histogram adds up to one. For example, sessions VR2301 and VR2302 observed 114 and 177 sources, respectively, so the original sample size for deriving the VR2301/02 histogram (in green) was 291.
Current usage metrics show cumulative count of Article Views (full-text article views including HTML views, PDF and ePub downloads, according to the available data) and Abstracts Views on Vision4Press platform.
Data correspond to usage on the plateform after 2015. The current usage metrics is available 48-96 hours after online publication and is updated daily on week days.
Initial download of the metrics may take a while.