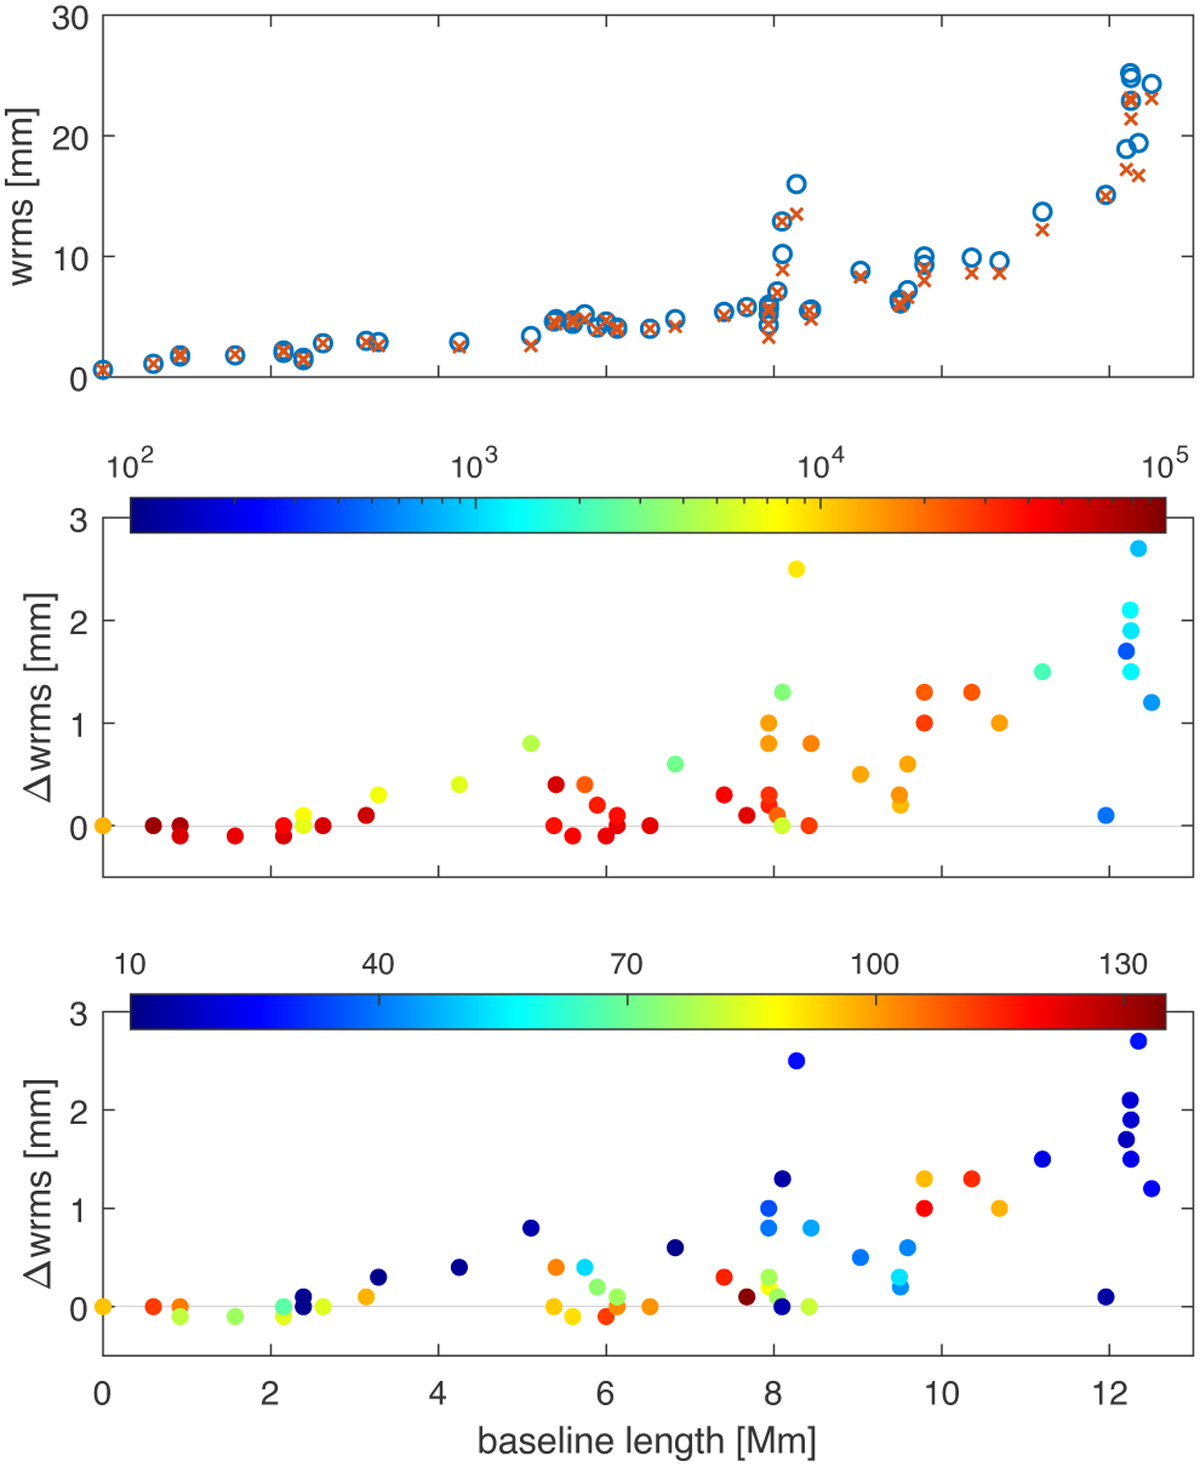
Fig. 15
Download original image
Baseline length repeatability (upper panel) from all VGOS sessions in solution S1 (blue circles) and in solution S2 (orange x-signs). The lower plots show the difference in wrms computed as S1 minus S2 with the total number of observations (middle panel) and with the number of baseline length determinations (bottom panel) color-coded for each baseline. Only baselines included in more than ten sessions are shown.
Current usage metrics show cumulative count of Article Views (full-text article views including HTML views, PDF and ePub downloads, according to the available data) and Abstracts Views on Vision4Press platform.
Data correspond to usage on the plateform after 2015. The current usage metrics is available 48-96 hours after online publication and is updated daily on week days.
Initial download of the metrics may take a while.