| Issue |
A&A
Volume 693, January 2025
|
|
|---|---|---|
| Article Number | A49 | |
| Number of page(s) | 9 | |
| Section | Interstellar and circumstellar matter | |
| DOI | https://doi.org/10.1051/0004-6361/202450678 | |
| Published online | 03 January 2025 | |
A complete Herbig disk mass survey in Orion
1
Leiden Observatory, Leiden University,
PO Box 9513,
2300
RA
Leiden,
The Netherlands
2
Max-Planck-Institut für Astronomie,
Königstuhl 17,
69117
Heidelberg,
Germany
3
Anton Pannekoek Institute for Astronomy, University of Amsterdam,
PO Box 94249,
1090
GE,
Amsterdam,
The Netherlands
4
Max-Planck-Institut für Extraterrestrische Physik,
Giessenbachstrasse 1,
85748
Garching,
Germany
5
Center for Astrophysics | Harvard & Smithsonian,
60 Garden Street,
Cambridge,
MA
02138,
USA
6
Space Research Institute, Austrian Academy of Sciences,
Schmiedlstr. 6,
8042
Graz,
Austria
★ Corresponding author; This email address is being protected from spambots. You need JavaScript enabled to view it.
Received:
10
May
2024
Accepted:
26
October
2024
Abstract
Context. Disks around intermediate mass stars called Herbig disks are the formation sites of giant exoplanets. Obtaining a complete inventory of these disks will therefore give insights into giant planet formation. However, to date no complete disk survey has been done on Herbig disks in a single star-forming region.
Aims. Our aim is to obtain the first complete survey of Herbig disks. Orion is the only nearby region with a significant number of Herbig disks (N=35) where such a survey can be carried out. The resulting dust mass distribution is compared to other dust mass distributions of disks around proto- and pre-main sequence stars in Orion. In addition, we ascertain whether previous Atacama Large Millimeter/submillimeter Array (ALMA) observations have been biased toward the most massive and brightest Herbig disks.
Methods. Using new Northern Extended Millimeter Array (NOEMA) observations of 25 Herbig disks, in combination with ALMA archival data of 10 Herbig disks, resulted in a complete sample of all known Herbig disks in Orion. Using uv-plane analysis for the NOEMA observed disks, and literature values of the ALMA observed disks, we obtained the dust masses of all Herbig disks and obtained a cumulative dust mass distribution. Additionally, six disks with new CO isotopolog detections are presented, one of which is detected in C17O. We calculated the external ultraviolet (UV) irradiance on each disk and compared the dust mass to it.
Results. We find a median disk dust mass of 11.7 M⊕ for the Herbig disks. Comparing the Herbig disks in Orion to previous surveys for mainly T Tauri disks in Orion, we find that while ~50% of the Herbig disks have a mass higher than 10 M⊕, this is at most 25% for the T Tauri disks. This difference is especially striking when considering that the Herbig disks are around a factor of 2 older than the T Tauri disks. After a comparison to the Herbig disks observed with ALMA from a previous study, no significant difference is found between the distributions. We find a steeper relationship between the dust mass and external UV irradiation (slope of −7.6) compared to that of the T Tauri disks (slope of −1.3). Comparing our results to a recent SPHERE survey of disks in Orion, we see that the Herbig disks present the largest and brightest disks and have structures indicative of gas-giant formation.
Conclusions. Herbig disks are on average more massive compared to T Tauri disks. This work shows the importance of complete samples, giving rise to the need of a complete survey of the Herbig disk population.
Key words: surveys / protoplanetary disks / stars: early-type / stars: pre-main sequence / stars: variables: T Tauri, Herbig Ae/Be / submillimeter: planetary systems
© The Authors 2025
 Open Access article, published by EDP Sciences, under the terms of the Creative Commons Attribution License (https://creativecommons.org/licenses/by/4.0), which permits unrestricted use, distribution, and reproduction in any medium, provided the original work is properly cited.
This article is published in open access under the Subscribe to Open model.
Open Access funding provided by Max Planck Society.
1 Introduction
Herbig disks are disks around pre-main sequence stars with spectral types of B, A, and F, and stellar masses of 1.5–10 M⊙; Hα indicates ongoing accretion (Herbig 1960; Brittain et al. 2023). These disks are the prime formation site of giant exoplanets; directly imaged exoplanets are often found around early spectral type stars (Marois et al. 2008, 2010; Lagrange et al. 2010), and exoplanet population studies show that the occurrence rate of massive exoplanets is highest around intermediate mass stars (e.g., Johnson et al. 2010; Nielsen et al. 2019). Recent work by Stapper et al. (2022) has shown that the mean mass of Herbig disks is higher compared to disks around lower mass T Tauri stars. The interpretations of these higher disk fluxes are still being discussed: it is either a consequence of massive exoplanets forming in these disks stopping radial drift and keeping the emitting area of the dust large (Stapper et al. 2022) and/or a consequence of high dust masses causing massive exoplanets to form in these disks (e.g., Guzmán-Díaz et al. 2023). Regardless of the interpretation, massive exoplanets are likely forming in these disks.
Some of the most well-known protoplanetary disks are Herbig disks. These millimeter-bright disks display many different types of structures, and are therefore especially favored for in-depth morphological (e.g., Andrews et al. 2018), kinematical (Pinte et al. 2018, 2019; Izquierdo et al. 2022), and chemical studies (e.g., Öberg et al. 2021; Booth et al. 2024). Stapper et al. (2022) compiled all the Atacama Large Millimeter/submillimeter Array (ALMA) data available of Herbig disks within 450 pc, including these well-studied disks. They found a clear increase in the mean dust mass compared to disks in the Lupus and Upper Sco star-forming regions, which primarily consist of T Tauri stars, showing that the stellar mass–disk mass relationship extends to the intermediate mass regime. Even so, both Herbig and T Tauri disks span the same range of masses, although their distributions are skewed to different averages. Since the T Tauri samples are complete and the Herbig sample of Stapper et al. (2022) is constructed from Herbig disks studied in a variety of ALMA projects (64% complete, including all nearby star-forming regions), the question remains of whether the ALMA coverage of Herbig disks is biased toward well-known and “interesting” objects with higher disk masses.
Orion (~300–475 pc, Großschedl et al. 2018) is the closest star-forming complex with enough pre-main sequence stars to harbor a sizeable number of Herbig Ae/Be stars. Many population studies have been done in different parts of Orion, tracing different star formation environments from tranquil regions to more UV-dominated regions. In the σ Orionis cluster, an intermediate aged region of 3 Myr old, the disk dust masses were found to depend strongly on the distance to the O9 star at its center (Ansdell et al. 2017). Only 12% of their disks were more than 10 M⊕ in mass. Furthermore, CO was only detected in disks more than 1.5 pc separated from the O-star. On the other hand, the disks in the older λ Orionis cluster of 5 Myr have not been significantly impacted by the massive stars or the supernova that occurred in the cluster (Ansdell et al. 2020). Interestingly, there is one significant outlier, HD 245185, which is a Herbig disk with a disk mass that is more than an order of magnitude higher than any of the other disks in this region. The younger (0.5 Myr) NGC 2024 cluster was surveyed by van Terwisga et al. (2020). This cluster consists of two populations: the eastern population is shielded from far-ultraviolet (FUV) irradiation and is similar to other isolated regions, while the western population is older and may be affected by the FUV irradiation. Other younger clusters such as the Orion Nebula Cluster and Orion Molecular Cloud-2 have been surveyed as well (Eisner et al. 2018; van Terwisga et al. 2019), and even class 0 and I surveys have been done (Tobin et al. 2020). Lastly, the largest population study of disks to date, consisting of 873 disks, has been done in the L1641 and L1647 regions of the Orion A cloud (SODA, van Terwisga et al. 2022, for L1641 also see Grant et al. 2021).
The plethora of population studies available in Orion gives a solid basis for a comparison between T Tauri disks and Herbig disks. In this work we present new Northern Extended Millimeter Array (NOEMA) observations of all Herbig disks in Orion. Section 2 shows how the targets were selected, the NOEMA data were reduced, and the dust masses were obtained. In Sect. 3 the resulting dust mass distribution is presented and compared to distributions of other proto- and pre-main sequence stars in Orion; in addition, CO spectra are presented. In Sect. 4.1 the dust mass distribution is compared to that of ALMA from Stapper et al. (2022). The impact of external UV irradiation on the dust masses is determined in Sect. 4.2, and a comparison to scattered light is made in Sect. 4.3. Our results are summarized in Sect. 5.
2 Data selection and reduction
In this work we present the results of observations done with the Northern Extended Millimeter Array (NOEMA), with project number S22AU (PI: S. Grant). The disks observed with NOEMA were selected as follows. Using the boundaries of Orion as given in Zari et al. (2017), we selected all Herbig disks in Orion based on the compilations of Vioque et al. (2018) and Guzmán-Díaz et al. (2021). From this we obtained a total of 35 Herbig disks located in the Orion star-forming region (for their positions in Orion, see Fig. 1; the numbers correspond to the numbers in Table 1). Of these 35 disks, 10 have existing ALMA interferometric data available (see Stapper et al. 2022 and van Terwisga et al. 2022, as well as the annotated disks in Table 1). For one of these ten (V1012 Ori) we obtained publicly available ALMA archival1 product data (PI: C. Ginski, 2021.1.01705.S). The remaining 25 disks were observed with NOEMA on 2022 December 7 and 30, on 2022 December 17, and on 2023 October 7. Figure 1 shows that the targets are spread over the complete constellation. The stellar mass distribution for this sample is not significantly different compared to the all-sky sample of Stapper et al. (2022), as a Kolmogorov-Smirnov test from SciPy (Virtanen et al. 2020) results in a p-value of 0.16.
The observations were done in the C configuration. The observations made on 2022 December 17 and November 30 (setup 1) have baselines ranging from 20 to 309 meters with one antenna (#7) at projected long baselines ranging from 985 to 1397 meters. On 2022 December 7 and 2023 October 7 (setup 2), the baselines range from 20 to 321 meter. Hence, at 210 GHz the largest angular scale the data are sensitive to is ~15″, and a restoring beam of ~1″ is obtained. The wide-band correlator PolyFiX was tuned such that the lower side-band (LSB) and upper side-band (USB) ranged from 203.7 to 211.8 GHz and 219.2 to 227.3 GHz, respectively, with a channel width of 2 MHz (~2.7 km s−1). In addition, 13 high resolution spectral windows with a width of 62.5 kHz (~86 m s−1) were centered on molecular emission lines, such as the J = 2–1 transition of the CO isotopologs 13CO, C18O, and C17O, and other molecules, such as CN and H2CO.
The NOEMA data were calibrated using the standard pipeline calibration using the CLIC program of the Grenoble Image and Line Data Analysis Software (GILDAS2). For setup 1 the phase rms threshold was set to 55°, and the seeing threshold, normally applied to long baseline observations, was not included as only one antenna was at long baselines. For setup 2 the phase rms threshold was set to the default value of 70°. The calibrators used for setup 1 were 2200+420, LkHα 101, 0923+392, and 2010+723 for the passband calibration, and 0458-020 and J0542-0913 were used for the phase and amplitude calibration. All calibrators were used for the flux calibration. The calibrators for setup 2 were LkHα 101 and 3C84, which were used for the bandpass calibration, and J0509+056 was used for the phase and amplitude calibration. All calibrators were used for the flux calibration. Due to the reduced phase rms threshold for setup 1, 10% of the data taken on 2022 November 30 were flagged, while 2% were flagged for the data taken on 2022 December 17. The weather during observing setup 2 on 2022 November 7 was particularly bad, increasing to a precipitable water vapor of 5 mm by the end of the observations. Due to this, 43% of the data were flagged. For the observations made on 2023 October 7 nothing was flagged. The on-source integration times ranged from 15 to 30 minutes. After the calibration was done, the data were exported to uvfits files to be further analyzed.
The data were analyzed using the Common Astronomy Software Applications (CASA) application version 5.8.0 (McMullin et al. 2007). To obtain the integrated fluxes in continuum, the LSB and USB were combined to make a continuum measurement set. This Gaussian was fitted using the uvmodelfit task in CASA after changing the phase-center to be on the target using the fixvis task. As all detections are unresolved, fitting a Gaussian to the visibilities was therefore a good approximation of the observations. From this fit the total flux was obtained. For the nondetections, assuming the emission is coming from a single beam, three times the rms noise from the empty image was used. For the remaining ten Herbig disks with existing ALMA data, we used the published fluxes as presented in Stapper et al. (2022) and van Terwisga et al. (2022), and for V1012 Ori we applied the same method as Stapper et al. (2022) on the ALMA archive product data.
To obtain the dust masses, we used the same assumptions as other works (e.g., Ansdell et al. 2016; Cazzoletti et al. 2019; Stapper et al. 2022). The flux and dust mass can be related via
![Mathematical equation: $\[M_{\text {dust }}=\frac{F_{\nu} d^{2}}{\kappa_{\nu} B_{\nu}\left(T_{\text {dust}}\right)},\]$](/articles/aa/full_html/2025/01/aa50678-24/aa50678-24-eq1.png) (1)
(1)
under the assumption of optical thin emission (Hildebrand 1983). Here the dust opacity is κν, the distance is d, and the value of the Planck curve at a dust temperature of Tdust is Bν. The dust opacity is estimated as a power law of the form κν ∝ νβ, such that it equals 10 cm2 g−1 at a frequency of 1000 GHz (Beckwith et al. 1990). The power-law index β is assumed to be equal to 1. To obtain an estimate of the temperature of the dust in Herbig disks, we scaled the dust temperature Tdust using the approach of Andrews et al. (2013) via
![Mathematical equation: $\[T_{\text {dust }}=25 \mathrm{~K} \times\left(\frac{L_{\star}}{L_{\odot}}\right)^{1 / 4}.\]$](/articles/aa/full_html/2025/01/aa50678-24/aa50678-24-eq2.png) (2)
(2)
For the error on the dust masses we used the recommended absolute flux calibration error of 20% for NOEMA and 10% for ALMA. Nevertheless, the dust masses were calculated under the assumption of optically thin emission, which is likely the largest source of uncertainty.
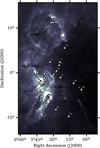 |
Fig. 1 Positions on the sky of the Herbig disk sample used in this work shown as the gray markers. The numbers next to the markers correspond to the numbers in Table 1. The background is an IRAS 100 μm image (Neugebauer et al. 1984). The positions of six disk surveys are also indicated: σ Ori (Ansdell et al. 2017), ONC (Eisner et al. 2018), OMC-2 (van Terwisga et al. 2019), λ Ori (Ansdell et al. 2020), NGC 2024 (van Terwisga et al. 2020), and L1641 and L1647 (SODA, van Terwisga et al. 2022). |
Stellar parameters, G0, measured flux, and derived dust mass of the Orion sample used in this work.
3 Results
3.1 Dust mass distribution
Using the lifelines package (Davidson-Pilon et al. 2021) we obtained the cumulative distribution of the Herbig disks in Orion following Stapper et al. (2022). The cumulative distribution is presented in Fig. 2, where it is compared to the cumulative dust mass distributions of four regions in Orion (see Fig. 1 for their positions in Orion): NGC 2024 (0.5 Myr, van Terwisga et al. 2020), L1641 and L1647 (SODA, 1–3 Myr, van Terwisga et al. 2022), σ Ori (3 Myr, Ansdell et al. 2017), and λ Ori (5 Myr, Ansdell et al. 2020). As there are uncertainties in the determination of the dust masses from the continuum flux using Eq. (1), a comparison between only the fluxes is shown in Appendix A; we note that the flux distribution also depends on the dust temperature, and therefore on stellar luminosity, an effect that is corrected for in the mass distribution of Fig. 2.
The dust masses of the Herbig disks range from 91 M⊕ for HD 290764 down to <1.2 M⊕ for HD 38087. For HD 288012, the disk around the secondary is detected with a flux of 16.5 mJy, corresponding to a disk mass of 65 M⊕, while for the disk around the Herbig star an upper limit of <1.4 M⊕ is found. The median of the disk masses is 11.7 M⊕ with a standard deviation of 26 M⊕, excluding the upper limits.
As noted in Stapper et al. (2022), we also find that Herbig disks are more massive than T Tauri disks. As Fig. 2 shows, while the most massive disks are not necessarily part of the Herbig disk population, the number of more massive disks (i.e., disks with a mass higher than 10 M⊕) is at around 50% for the Herbig disks. For the other regions this is ~25% or lower.
This difference in mass is especially evident when comparing the Herbig disk ages to the ages of the surveyed regions. Based on isochrones from pre-main sequence evolutionary tracks, the median age of the Herbig disks in Orion, after removing upper limits, is 5.1±4.1 Myr (Guzmán-Díaz et al. 2021). The ages range from a minimum age of 0.5 Myr to a maximum age of 17 Myr. NGC 2024, the youngest region, is less massive than the Herbig disks; ~20% of the population is more massive than 10 M⊕ (see Fig. 2). Even splitting the NGC 2024 region in its two populations (the younger eastern and older western populations); the younger population has a dust mass distribution up to ~30% at 10 M⊕, still lower than what is found for the Herbig disks.
The difference is even more stark when comparing the dust masses of the oldest region, λ Ori, to those of the Herbig disks. All but one disk has a mass below 10 M⊕. This disk is HD 245185, which is in the 90th percentile of our dust masses3. Regions impacted by external irradiation, such as the disks in σ Ori (Ansdell et al. 2017; Maucó et al. 2023), also show lower disk masses compared to the Herbig disks.
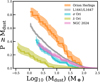 |
Fig. 2 Orion Herbig disk dust mass distribution compared to other disk surveys done in Orion. The other surveys are NGC 2024 (van Terwisga et al. 2020), L1641 and L1647 (SODA, van Terwisga et al. 2022), σ Ori (Ansdell et al. 2017), and λ Ori (Ansdell et al. 2020). |
3.2 Gas observations
The NOEMA observations also covered the 13CO, C18O, and C17O J = 2–1 emission lines. To obtain the spectra of these CO isotopologs, first the phase center was aligned on-target using the fixvis task, after which the plotms task was used to export the measured visibility spectra averaged over time, baseline, and scans. The spectra were binned by a factor of ten, resulting in a ~0.9 km s−1 resolution.
Figure 3 presents the detected 13CO, C18O, and C17O spectra of six disks. For these six disks we detected 13CO emission at a peak signal-to-noise ratio of 6 and higher. For only two disks we also detected C18O. In V351 Ori even C17O was detected. For an additional two disks, T Ori and HD 36982, foreground cloud emission in the form of large-scale emission was detected.
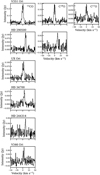 |
Fig. 3 Spectra of the disks in which 13CO, C18O, or C17O are detected. The spectra are centered on the frequencies of the emission lines and are binned to 1 km s−1. |
4 Discussion
4.1 Comparison to the ALMA Herbig disks
Figure 4 compares the obtained cumulative distribution of the Herbig disks in Orion to the distribution of the all-sky survey of Herbig disks with ALMA of Stapper et al. (2022) combined with the extra sources observed with NOEMA from Stapper et al. (2024). The detection rate of the Herbig disks in Orion is similar to what was found for the sample analyzed by Stapper et al. (2022). Out of the 35 disks in the Orion sample, 6 were not detected, resulting in a 83% detection rate. For the sample of Stapper et al. (2022) 2 out of 36 disks were not detected. However, the ALMA data are more sensitive, and at the NOEMA sensitivity the same detection rate of 83% would have been obtained for the sample of Stapper et al. (2022). The cumulative distributions shown in Fig. 4 have the same completeness at a disk mass of ~1 M⊕.
The main difference between the two dust mass cumulative distributions is at the high end of the distribution. The higher mass disks are mostly missing in the Orion sample when compared to the sample of Stapper et al. (2022). To test whether the dust distributions come from the same population, we used two tests, the lifelines logrank_test and the KolmogorovSmirnov test from SciPy (Virtanen et al. 2020). These tests determine whether the Orion distribution is different from the all-sky ALMA distribution; the logrank test also takes upper limits into account. We obtained p-values for the distributions of p=0.26 (logrank) and p=0.32 (KS), and therefore cannot reject the null hypothesis of both distributions being sampled from the same distribution. However, in the Orion population, massive disks such as HD 97048 and HD 142527 (156 M⊕ and 215 M⊕ respectively, Stapper et al. 2022) are missing. This suggests that the ALMA all-sky coverage may have been slightly biased toward including the most massive disks, and shows that a complete all-sky survey is warranted.
A lognormal distribution is fitted through the cumulative distributions, following previous works (Williams et al. 2019; Stapper et al. 2022; Stapper et al. 2024), to obtain probability density distributions. These distributions are shown in the right panel of Fig. 4. The mean value of the distributions are ![Mathematical equation: $\[\text{Log}_{10}(M_{\text {dust}}(M_{\oplus})){=}0.94_{-0.07}^{+0.06}\]$](/articles/aa/full_html/2025/01/aa50678-24/aa50678-24-eq3.png) and
and ![Mathematical equation: $\[$1.27_{-0.05}^{+0.05}$\]$](/articles/aa/full_html/2025/01/aa50678-24/aa50678-24-eq4.png) for the Orion sample and the sample of Stapper et al. (2022), respectively. The width of the distributions are the same,
for the Orion sample and the sample of Stapper et al. (2022), respectively. The width of the distributions are the same, ![Mathematical equation: $\[0.59_{-0.06}^{+0.07}\]$](/articles/aa/full_html/2025/01/aa50678-24/aa50678-24-eq5.png) and
and ![Mathematical equation: $\[0.61_{-0.06}^{+0.06}\]$](/articles/aa/full_html/2025/01/aa50678-24/aa50678-24-eq6.png) , respectively. There is a clear overlap between the two distributions, further substantiating that the distributions are not significantly different.
, respectively. There is a clear overlap between the two distributions, further substantiating that the distributions are not significantly different.
Summarizing, we find no significant difference in the distribution of the dust masses of the Herbig disks in Orion compared to the distribution of Stapper et al. (2022).
4.2 Impact of UV on Herbig disk masses
Orion contains a large number of massive young stars that contribute to the farultraviolet (FUV) external irradiation field, which influences the amount of mass present in the disk by triggering photoevaporative winds. Figure 5 shows the external ionizing sources as stars and the corresponding FUV impact on the Herbig disks as the purple to yellow shaded circles in terms of G0 (1.6 × 10⁻³ erg cm−2 s−1, Habing 1968). The Herbig disks with a blue edge were also detected with NOEMA in at least 13CO. For HD 34282, 13CO and C18O were detected with ALMA (Stapper et al. 2024); for HD 245185 and V1012 Ori, 12CO is very bright and was detected with ALMA (Stapper et al. 2024).
The ionizing stars were found, following van Terwisga & Hacar (2023), by querying Simbad4 for stars with spectral types earlier than A 0 within the region on the sky as shown in Figs. 1 and 5. The distances to the stars were limited to 300–475 pc, and as the uncertainties on these distances can be fairly large, only projected distances are used. The FUV luminosities of these stars were then computed by using BHAC-15 isochrones (Baraffe et al. 2015) and integrating model spectra (Castelli & Kurucz 2003) between 911.6 and 2066 Å. As was done by van Terwisga & Hacar (2023), no stars beyond a projected distance of 10 pc from a given Herbig disk were taken into account, but interstellar extinction was not included otherwise. Including the irradiation of stars out to 30 pc primarily changes the G0 of the least irradiated disks to at most a few tens of G0. The minimum UV irradiation was set at 1 G0. The resulting values of G0 are shown in Fig. 5, and compared to the dust masses in Fig. 6; disks with CO detections are indicated as in Fig. 5.
Figure 6 shows that there is a trend: a decrease in dust mass for an increase in UV irradiation for Herbig disks. We used the linmix5 package (Kelly 2007) to fit a linear relationship through the data. This fit results in the orange and blue relationships shown in Fig. 6. Depending on the distance cutoff we adopt to include contributions to Fuv (10 pc or 30 pc), we find a relation Mdust = a × log(Fuv) + b with respective slopes of −7.6±3.6 and −8.5±4.5, and offsets of 29.4±6.7 and 32.8±8.7. Although the slopes appear steeper than ![Mathematical equation: $\[-1.3_{-0.13}^{+0.14}\]$](/articles/aa/full_html/2025/01/aa50678-24/aa50678-24-eq7.png) for L1641 and L1647 (van Terwisga & Hacar 2023), they agree with the latter value within 2σ. The findings support a trend of decreasing dust mass with increasing UV irradiation.
for L1641 and L1647 (van Terwisga & Hacar 2023), they agree with the latter value within 2σ. The findings support a trend of decreasing dust mass with increasing UV irradiation.
There are disks with dust masses higher than 10 M⊕ for all bins, except at the highest UV irradiation. Furthermore, CO is detected over all UV irradiation values traced, which is a tracer of the UV irradiance as well. For some of the disks with the strongest UV irradiance, we still clearly detect CO emission. The UV irradiation increases the temperature of the disk both in the dust and the gas, which is used to explain the bright CO emission seen in irradiated T Tauri disks due to less freeze-out (Boyden & Eisner 2020; Ballering et al. 2023). However, for Herbig disks the star dominates: using Eq. (2) from Ballering et al. 2023, the Herbig disk needs to be within a projected distance of ~0.3 pc of an O-star (which none of our disks are) for the temperature set by UV irradiation to dominate over the temperature set by the stellar luminosity (see Eq. (2)). Especially HD 245185 is of note, for which strong 12CO emission was detected with ALMA (Ansdell et al. 2020), even though it has one of the highest irradiances in the sample used in our work. This might be indicative of a chance alignment, and that the Herbig disk is actually farther away from the O-star than it seems. Placing HD 245185 at the same distance as the shell seen around λ Ori (Figs. 1 and 5), results in a distance of ~20 pc, instead of less than 1 pc. This would decrease the irradiance to negligible values of around 2–4 G0, aligning the disk mass with the seen trend. The other high disk masses might therefore also be chance alignments. Even so, disks likely need to be close to the O-star for their chemistry to be affected by UV irradiation (Ramírez-Tannus et al. 2023; Díaz-Berríos et al. 2024).
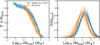 |
Fig. 4 Comparison of the Herbig sample in Orion of this work with the Herbig disks analyzed in Stapper et al. (2022) and Stapper et al. (2024). The left panel presents the cumulative distributions. The right panel shows the fitted log-normal distributions. |
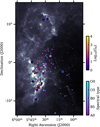 |
Fig. 5 Similar to Fig. 1, but here the FUV irradiation in G0 is shown as the color of the Herbig disk markers. O- and B-type stars are plotted as the stars, where the color (and size) indicates their spectral type. The Herbig disk with a blue edge was also detected with NOEMA in at least 13CO. For HD 34282, 13CO and C18O were detected with ALMA; for HD 245185 and V1012 Ori, 12CO is very bright and is detected with ALMA (Stapper et al. 2024). |
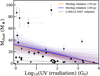 |
Fig. 6 External UV irradiation plotted against the dust mass of the Herbig disks. Ionizing stars within 10 pc have been taken into account; the relationship fitted through these data is shown in orange. The gray horizontal lines indicate where the points move if a cutoff of 30 pc is used, and the corresponding fit is shown in blue. The blue marker outlines indicate disks in which CO is detected (see Fig. 3, or Stapper et al. 2024). The relationship found for L1641 and L1647 is shown as the gray line (van Terwisga & Hacar 2023). The region over which this line was fitted is solid, while the dashed line is extrapolated. |
4.3 Comparison to scattered-light data
Recently Valegård et al. (2024) published a survey of disks in Orion observed in scattered light imaging with the Spectro-Polarimetric High-contrast Exoplanet REsearch (SPHERE) instrument on the Very Large Telescope (VLT). This survey was done as part of the Disk Evolution Study Through Imaging of Nearby Young Stars program (DESTINYS, recent papers include Garufi et al. 2024; Ginski et al. 2024; Valegård et al. 2024). The survey consists of 23 stars in Orion with spectral types ranging from A 0 to K 6. Of the 23 disks, 10 have a detection of a disk, and 4 of these have a clearly resolved disk.
Out to Orion only a few disks can be resolved with SPHERE. In the sample of Valegård et al. (2024), four disks are resolved: HD 294260, V1012 Ori, V351 Ori, and V599 Ori. Of these four disks, three are Herbig disks and are some of the more massive disks in our sample. HD 294260 is an intermediate mass T Tauri (IMTT) star, which are precursors of Herbig stars (Valegård et al. 2021). The disks around IMTT stars show characteristics similar to the disks around Herbig stars, with the same dust mass distribution (Stapper et al. 2025). The dust mass of HD 294260 is found to be 74.4±7.9 M⊕ (Stapper et al. 2025). Other disks resolved with scattered-light imaging in Orion include HD 34282 (de Boer et al. 2021) and HD 290764 (Ohta et al. 2016). All of these disks are around intermediate mass stars.
Some of these disks also show clear signs of asymmetries in the polarized scattered light. V351 Ori shows multiple asymmetric structures (Wagner et al. 2020; Valegård et al. 2024), in particular arc-like structures in the outer ring of the disk. V599 Ori has indications of a spiral arm, the inner disk is brighter in the southeast, and the outer disk is brighter in the northwest (Valegård et al. 2024). These types of structures are generally explained by giant planets residing in these disks (for an overview, see Bae et al. 2023). As around intermediate mass stars giant exoplanet formation is highest (e.g., Johnson et al. 2007, 2010; Nielsen et al. 2019), the fact that the most massive and largest disks with substructures found around intermediate mass disks could be related to this. As Stapper et al. (2022) and others (e.g., Maaskant et al. 2013) proposed, the evolution of Herbig disks is likely significantly influenced by these giant exoplanets, which can keep the disk large and bright. A similar hypothesis was put forward by Ansdell et al. (2020) for the HD 245185 disk, which is the most massive disk in λ Orionis by an order of magnitude. The host star of the HD 245185 disk was found to be depleted in refractory elements, suggesting giant planet formation occurring in this disk (Kama et al. 2015; Guzmán-Díaz et al. 2023). Similarly, V599 Ori was also found to be depleted in refractory elements (Guzmán-Díaz et al. 2023). While these large disks are not lacking around T Tauri disks (e.g., V1094 Sco van Terwisga et al. 2018, IM Lup (Andrews et al. 2018), and Sz 98 Ansdell et al. 2016), they do seem to be more common around Herbig disks.
5 Conclusion
In this paper we presented the first complete survey of Herbig disks in a single region. We presented new NOEMA observations of 25 Herbig disks, which, together with ten archival ALMA observations, cover all the Herbig disks in Orion. Based on these observations we conclude the following:
The Herbig disks in Orion are found to have a median dust disk mass of 11.7 M⊕, ranging from 91 M⊕ down to an upper limit of <1.2 M⊕.
Comparing the Herbig disks in Orion to previous surveys done in Orion, we find a higher mean dust disk mass compared to the T Tauri disks. For Herbig disks 50% of the disks have masses higher than 10 M⊕, while for T Tauri disks it is 25% or lower. This difference is especially apparent when considering that the Herbig disks have a median age of 5.1 Myr, while the star-forming regions in Orion are as young as 0.5 Myr.
There are no significant differences between the dust mass distribution of the Orion Herbig disk population and those observed with ALMA across the sky (Stapper et al. 2022). The only difference appears due to the lack of a few individual objects with particularly high disk masses (beyond ~150 M⊕) that are absent from the Orion sample.
Herbig disks show a steeper trend between disk dust mass and UV irradiation compared to T Tauri disks. A slope of −7.6 is found, compared to −1.3 for T Tauri disks.
The largest disks in the recent SPHERE survey of disks in Orion of Valegård et al. (2024) are Herbig disks, and are some of the most massive disks in our sample, likely relating to giant exoplanet formation occurring in these disks.
This work has shown the importance of complete studies of Herbig disks. As we are going toward more complete and better defined samples of Herbig stars, we should push for complete millimeter observations of the Herbig disk population.
Acknowledgements
The research of L.M.S. is supported by the Netherlands Research School for Astronomy (NOVA). This work is based on observations carried out under project number S22AU with the IRAM NOEMA Interferometer. IRAM is supported by INSU/CNRS (France), MPG (Germany) and IGN (Spain). We would like to thank Jan Orkisz as our local contact at IRAM. This paper makes use of the following ALMA data: ADS/JAO.ALMA#2021.1.01705.S. ALMA is a partnership of ESO (representing its member states), NSF (USA) and NINS (Japan), together with NRC (Canada), MOST and ASIAA (Taiwan), and KASI (Republic of Korea), in cooperation with the Republic of Chile. The Joint ALMA Observatory is operated by ESO, AUI/NRAO and NAOJ. This work makes use of the following software: The Common Astronomy Software Applications (CASA) package (McMullin et al. 2007), Python version 3.9, astropy (Astropy Collaboration 2013, 2018), lifelines (Davidson-Pilon et al. 2021), matplotlib (Hunter 2007), numpy (Harris et al. 2020), and scipy (Virtanen et al. 2020). Lastly, we thank the referee for their careful consideration of our work and for their thoughtful comments which improved the manuscript.
Appendix A Flux distributions
Figure A.1 presents cumulative distributions of the same regions as shown in Fig. 2, but now for the observed fluxes, instead of the dust masses as converted via Eq. (1). Due to the relatively warm disks around Herbig stars, the Herbig disks now stand out more prominently compared to the other regions.
References
- Andrews, S. M., Rosenfeld, K. A., Kraus, A. L., & Wilner, D. J. 2013, ApJ, 771, 129 [Google Scholar]
- Andrews, S. M., Huang, J., Pérez, L. M., et al. 2018, ApJ, 869, L41 [NASA ADS] [CrossRef] [Google Scholar]
- Ansdell, M., Williams, J. P., van der Marel, N., et al. 2016, ApJ, 828, 46 [Google Scholar]
- Ansdell, M., Williams, J. P., Manara, C. F., et al. 2017, AJ, 153, 240 [Google Scholar]
- Ansdell, M., Haworth, T. J., Williams, J. P., et al. 2020, AJ, 160, 248 [Google Scholar]
- Astropy Collaboration (Robitaille, T. P., et al.) 2013, A&A, 558, A33 [NASA ADS] [CrossRef] [EDP Sciences] [Google Scholar]
- Astropy Collaboration (Price-Whelan, A. M., et al.) 2018, AJ, 156, 123 [Google Scholar]
- Bae, J., Isella, A., Zhu, Z., et al. 2023, ASP Conf. Ser., 534, 423 [NASA ADS] [Google Scholar]
- Ballering, N. P., Cleeves, L. I., Haworth, T. J., et al. 2023, ApJ, 954, 127 [NASA ADS] [CrossRef] [Google Scholar]
- Baraffe, I., Homeier, D., Allard, F., & Chabrier, G. 2015, A&A, 577, A42 [NASA ADS] [CrossRef] [EDP Sciences] [Google Scholar]
- Beckwith, S. V. W., Sargent, A. I., Chini, R. S., & Guesten, R. 1990, AJ, 99, 924 [Google Scholar]
- Booth, A. S., Leemker, M., van Dishoeck, E. F., et al. 2024, AJ, 167, 164 [NASA ADS] [CrossRef] [Google Scholar]
- Boyden, R. D., & Eisner, J. A. 2020, ApJ, 894, 74 [NASA ADS] [CrossRef] [Google Scholar]
- Brittain, S. D., Kamp, I., Meeus, G., Oudmaijer, R. D., & Waters, L. B. F. M. 2023, Space Sci. Rev., 219, 7 [NASA ADS] [CrossRef] [Google Scholar]
- Castelli, F., & Kurucz, R. L. 2003, IAU Symp., 210, A20 [Google Scholar]
- Cazzoletti, P., Manara, C. F., Baobab Liu, H., et al. 2019, A&A, 626, A11 [NASA ADS] [CrossRef] [EDP Sciences] [Google Scholar]
- Davidson-Pilon, C., Kalderstam, J., Jacobson, N., et al. 2021, https://doi.org/10.5281/zenodo.4579431 [Google Scholar]
- de Boer, J., Ginski, C., Chauvin, G., et al. 2021, A&A, 649, A25 [NASA ADS] [CrossRef] [EDP Sciences] [Google Scholar]
- Díaz-Berríos, J. K., Guzmán, V. V., Walsh, C., et al. 2024, ApJ, 969, 165 [CrossRef] [Google Scholar]
- Eisner, J. A., Arce, H. G., Ballering, N. P., et al. 2018, ApJ, 860, 77 [CrossRef] [Google Scholar]
- Garufi, A., Ginski, C., van Holstein, R. G., et al. 2024, A&A, 685, A53 [NASA ADS] [CrossRef] [EDP Sciences] [Google Scholar]
- Ginski, C., Garufi, A., Benisty, M., et al. 2024, A&A, 685, A52 [NASA ADS] [CrossRef] [EDP Sciences] [Google Scholar]
- Grant, S. L., Espaillat, C. C., Wendeborn, J., et al. 2021, ApJ, 913, 123 [NASA ADS] [CrossRef] [Google Scholar]
- Großschedl, J. E., Alves, J., Meingast, S., et al. 2018, A&A, 619, A106 [Google Scholar]
- Guzmán-Díaz, J., Mendigutía, I., Montesinos, B., et al. 2021, A&A, 650, A182 [NASA ADS] [CrossRef] [EDP Sciences] [Google Scholar]
- Guzmán-Díaz, J., Montesinos, B., Mendigutía, I., et al. 2023, A&A, 671, A140 [NASA ADS] [CrossRef] [EDP Sciences] [Google Scholar]
- Habing, H. J. 1968, Bull. Astron. Inst. Netherlands, 19, 421 [Google Scholar]
- Harris, C. R., Millman, K. J., van der Walt, S. J., et al. 2020, Nature, 585, 357 [NASA ADS] [CrossRef] [Google Scholar]
- Herbig, G. H. 1960, ApJS, 4, 337 [Google Scholar]
- Hildebrand, R. H. 1983, QJRAS, 24, 267 [NASA ADS] [Google Scholar]
- Hunter, J. D. 2007, Comput. Sci. Eng., 9, 90 [NASA ADS] [CrossRef] [Google Scholar]
- Izquierdo, A. F., Facchini, S., Rosotti, G. P., van Dishoeck, E. F., & Testi, L. 2022, ApJ, 928, 2 [NASA ADS] [CrossRef] [Google Scholar]
- Johnson, J. A., Butler, R. P., Marcy, G. W., et al. 2007, ApJ, 670, 833 [Google Scholar]
- Johnson, J. A., Aller, K. M., Howard, A. W., & Crepp, J. R. 2010, PASP, 122, 905 [Google Scholar]
- Kama, M., Folsom, C. P., & Pinilla, P. 2015, A&A, 582, L10 [NASA ADS] [CrossRef] [EDP Sciences] [Google Scholar]
- Kelly, B. C. 2007, ApJ, 665, 1489 [Google Scholar]
- Lagrange, A. M., Bonnefoy, M., Chauvin, G., et al. 2010, Science, 329, 57 [Google Scholar]
- Maaskant, K. M., Honda, M., Waters, L. B. F. M., et al. 2013, A&A, 555, A64 [NASA ADS] [CrossRef] [EDP Sciences] [Google Scholar]
- Marois, C., Macintosh, B., Barman, T., et al. 2008, Science, 322, 1348 [Google Scholar]
- Marois, C., Zuckerman, B., Konopacky, Q. M., Macintosh, B., & Barman, T. 2010, Nature, 468, 1080 [NASA ADS] [CrossRef] [Google Scholar]
- Maucó, K., Manara, C. F., Ansdell, M., et al. 2023, A&A, 679, A82 [NASA ADS] [CrossRef] [EDP Sciences] [Google Scholar]
- McMullin, J. P., Waters, B., Schiebel, D., Young, W., & Golap, K. 2007, ASP Conf. Ser., 376, 127 [Google Scholar]
- Neugebauer, G., Habing, H. J., van Duinen, R., et al. 1984, ApJ, 278, L1 [NASA ADS] [CrossRef] [Google Scholar]
- Nielsen, E. L., De Rosa, R. J., Macintosh, B., et al. 2019, AJ, 158, 13 [Google Scholar]
- Öberg, K. I., Guzmán, V. V., Walsh, C., et al. 2021, ApJS, 257, 1 [CrossRef] [Google Scholar]
- Ohta, Y., Fukagawa, M., Sitko, M. L., et al. 2016, PASJ, 68, 53 [Google Scholar]
- Pinte, C., Price, D. J., Ménard, F., et al. 2018, ApJ, 860, L13 [Google Scholar]
- Pinte, C., van der Plas, G., Ménard, F., et al. 2019, Nat. Astron., 3, 1109 [NASA ADS] [CrossRef] [Google Scholar]
- Ramírez-Tannus, M. C., Bik, A., Cuijpers, L., et al. 2023, ApJ, 958, L30 [CrossRef] [Google Scholar]
- Stapper, L. M., Hogerheijde, M. R., van Dishoeck, E. F., & Mentel, R. 2022, A&A, 658, A112 [NASA ADS] [CrossRef] [EDP Sciences] [Google Scholar]
- Stapper, L. M., Hogerheijde, M. R., van Dishoeck, E. F., et al. 2024, A&A, 682, A149 [NASA ADS] [CrossRef] [EDP Sciences] [Google Scholar]
- Stapper, L. M., Hogerheijde, M. R., van Dishoeck, E. F., et al. 2025, A&A, in press, https://doi.org/10.1051/0004-6361/202450260 [NASA ADS] [CrossRef] [EDP Sciences] [Google Scholar]
- Tobin, J. J., Sheehan, P. D., Megeath, S. T., et al. 2020, ApJ, 890, 130 [CrossRef] [Google Scholar]
- Valegård, P. G., Waters, L. B. F. M., & Dominik, C. 2021, A&A, 652, A133 [NASA ADS] [CrossRef] [EDP Sciences] [Google Scholar]
- Valegård, P. G., Ginski, C., Derkink, A., et al. 2024, A&A, 685, A54 [NASA ADS] [CrossRef] [EDP Sciences] [Google Scholar]
- van Terwisga, S. E., & Hacar, A. 2023, A&A, 673, L2 [CrossRef] [EDP Sciences] [Google Scholar]
- van Terwisga, S. E., van Dishoeck, E. F., Ansdell, M., et al. 2018, A&A, 616, A88 [NASA ADS] [CrossRef] [EDP Sciences] [Google Scholar]
- van Terwisga, S. E., Hacar, A., & van Dishoeck, E. F. 2019, A&A, 628, A85 [NASA ADS] [CrossRef] [EDP Sciences] [Google Scholar]
- van Terwisga, S. E., van Dishoeck, E. F., Mann, R. K., et al. 2020, A&A, 640, A27 [NASA ADS] [CrossRef] [EDP Sciences] [Google Scholar]
- van Terwisga, S. E., Hacar, A., van Dishoeck, E. F., Oonk, R., & Portegies Zwart, S. 2022, A&A, 661, A53 [NASA ADS] [CrossRef] [EDP Sciences] [Google Scholar]
- Vioque, M., Oudmaijer, R. D., Baines, D., Mendigutía, I., & Pérez-Martínez, R. 2018, A&A, 620, A128 [NASA ADS] [CrossRef] [EDP Sciences] [Google Scholar]
- Virtanen, P., Gommers, R., Oliphant, T. E., et al. 2020, Nat. Methods, 17, 261 [Google Scholar]
- Wagner, K., Stone, J., Dong, R., et al. 2020, AJ, 159, 252 [NASA ADS] [CrossRef] [Google Scholar]
- Williams, J. P., Cieza, L., Hales, A., et al. 2019, ApJ, 875, L9 [Google Scholar]
- Zari, E., Brown, A. G. A., de Bruijne, J., Manara, C. F., & de Zeeuw, P. T. 2017, A&A, 608, A148 [NASA ADS] [CrossRef] [EDP Sciences] [Google Scholar]
We adopt a lower disk mass compared to Ansdell et al. (2020) by using a higher disk temperature, 59 K instead of 20 K.
All Tables
Stellar parameters, G0, measured flux, and derived dust mass of the Orion sample used in this work.
All Figures
|
Fig. 1 Positions on the sky of the Herbig disk sample used in this work shown as the gray markers. The numbers next to the markers correspond to the numbers in Table 1. The background is an IRAS 100 μm image (Neugebauer et al. 1984). The positions of six disk surveys are also indicated: σ Ori (Ansdell et al. 2017), ONC (Eisner et al. 2018), OMC-2 (van Terwisga et al. 2019), λ Ori (Ansdell et al. 2020), NGC 2024 (van Terwisga et al. 2020), and L1641 and L1647 (SODA, van Terwisga et al. 2022). |
| In the text | |
|
Fig. 2 Orion Herbig disk dust mass distribution compared to other disk surveys done in Orion. The other surveys are NGC 2024 (van Terwisga et al. 2020), L1641 and L1647 (SODA, van Terwisga et al. 2022), σ Ori (Ansdell et al. 2017), and λ Ori (Ansdell et al. 2020). |
| In the text | |
|
Fig. 3 Spectra of the disks in which 13CO, C18O, or C17O are detected. The spectra are centered on the frequencies of the emission lines and are binned to 1 km s−1. |
| In the text | |
|
Fig. 4 Comparison of the Herbig sample in Orion of this work with the Herbig disks analyzed in Stapper et al. (2022) and Stapper et al. (2024). The left panel presents the cumulative distributions. The right panel shows the fitted log-normal distributions. |
| In the text | |
|
Fig. 5 Similar to Fig. 1, but here the FUV irradiation in G0 is shown as the color of the Herbig disk markers. O- and B-type stars are plotted as the stars, where the color (and size) indicates their spectral type. The Herbig disk with a blue edge was also detected with NOEMA in at least 13CO. For HD 34282, 13CO and C18O were detected with ALMA; for HD 245185 and V1012 Ori, 12CO is very bright and is detected with ALMA (Stapper et al. 2024). |
| In the text | |
|
Fig. 6 External UV irradiation plotted against the dust mass of the Herbig disks. Ionizing stars within 10 pc have been taken into account; the relationship fitted through these data is shown in orange. The gray horizontal lines indicate where the points move if a cutoff of 30 pc is used, and the corresponding fit is shown in blue. The blue marker outlines indicate disks in which CO is detected (see Fig. 3, or Stapper et al. 2024). The relationship found for L1641 and L1647 is shown as the gray line (van Terwisga & Hacar 2023). The region over which this line was fitted is solid, while the dashed line is extrapolated. |
| In the text | |
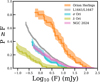 |
Fig. A.1 Same as Fig. 2, but for the fluxes not converted to dust mass. |
| In the text | |
Current usage metrics show cumulative count of Article Views (full-text article views including HTML views, PDF and ePub downloads, according to the available data) and Abstracts Views on Vision4Press platform.
Data correspond to usage on the plateform after 2015. The current usage metrics is available 48-96 hours after online publication and is updated daily on week days.
Initial download of the metrics may take a while.