Fig. 6
Download original image
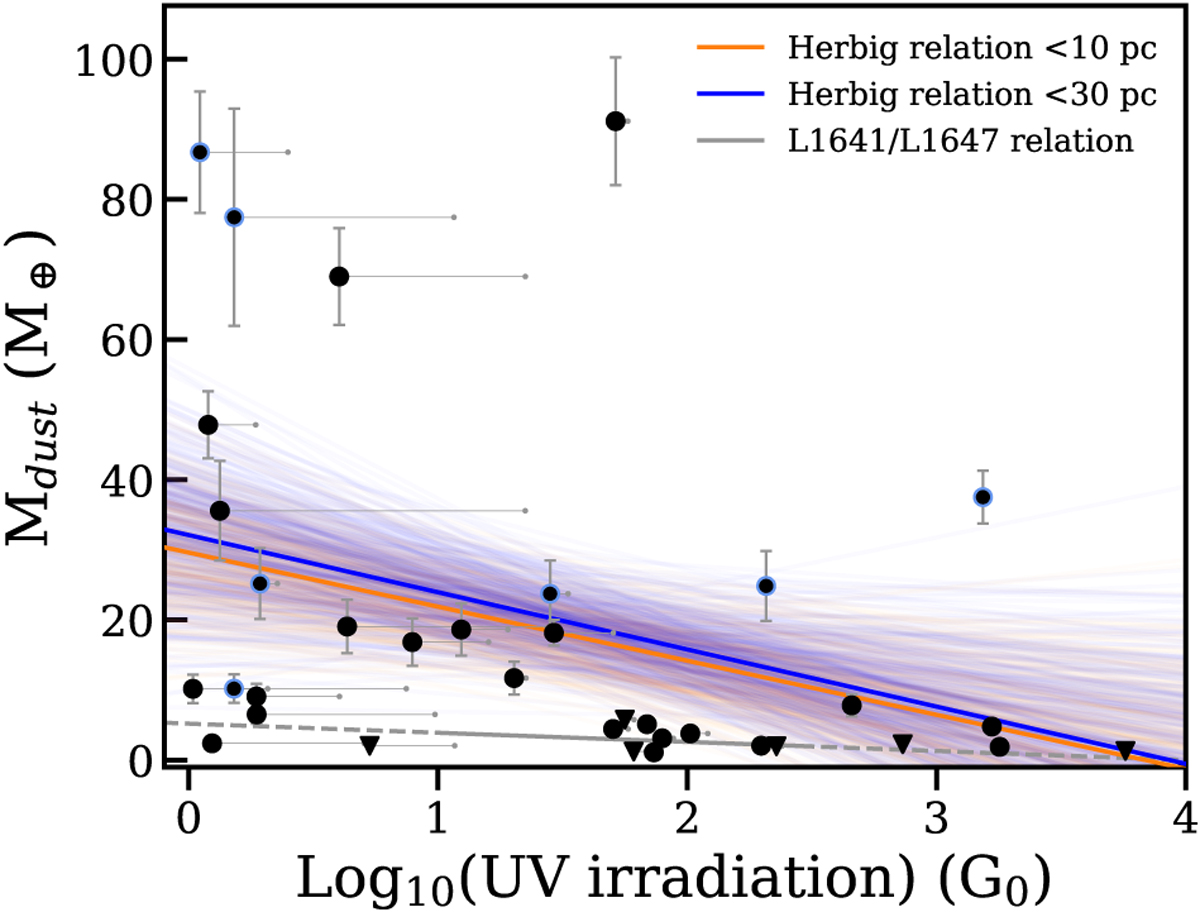
External UV irradiation plotted against the dust mass of the Herbig disks. Ionizing stars within 10 pc have been taken into account; the relationship fitted through these data is shown in orange. The gray horizontal lines indicate where the points move if a cutoff of 30 pc is used, and the corresponding fit is shown in blue. The blue marker outlines indicate disks in which CO is detected (see Fig. 3, or Stapper et al. 2024). The relationship found for L1641 and L1647 is shown as the gray line (van Terwisga & Hacar 2023). The region over which this line was fitted is solid, while the dashed line is extrapolated.
Current usage metrics show cumulative count of Article Views (full-text article views including HTML views, PDF and ePub downloads, according to the available data) and Abstracts Views on Vision4Press platform.
Data correspond to usage on the plateform after 2015. The current usage metrics is available 48-96 hours after online publication and is updated daily on week days.
Initial download of the metrics may take a while.