| Issue |
A&A
Volume 692, December 2024
|
|
|---|---|---|
| Article Number | A124 | |
| Number of page(s) | 12 | |
| Section | Extragalactic astronomy | |
| DOI | https://doi.org/10.1051/0004-6361/202452548 | |
| Published online | 05 December 2024 | |
Euclid: The rb−M* relation as a function of redshift
I. The 5 × 10⁹ M⊙ black hole in NGC 1272⋆
1
Universitäts-Sternwarte München, Fakultät für Physik, Ludwig-Maximilians-Universität München, Scheinerstrasse 1, 81679 München, Germany
2
Max Planck Institute for Extraterrestrial Physics, Giessenbachstr. 1, 85748 Garching, Germany
3
Ludwig-Maximilians-University, Schellingstrasse 4, 80799 Munich, Germany
4
INAF-Osservatorio Astronomico di Brera, Via Brera 28, 20122 Milano, Italy
5
IFPU, Institute for Fundamental Physics of the Universe, Via Beirut 2, 34151 Trieste, Italy
6
INAF-Osservatorio Astronomico di Trieste, Via G. B. Tiepolo 11, 34143 Trieste, Italy
7
INFN, Sezione di Trieste, Via Valerio 2, 34127 Trieste, TS, Italy
8
SISSA, International School for Advanced Studies, Via Bonomea 265, 34136 Trieste, TS, Italy
9
Dipartimento di Fisica e Astronomia, Università di Bologna, Via Gobetti 93/2, 40129 Bologna, Italy
10
INAF-Osservatorio di Astrofisica e Scienza dello Spazio di Bologna, Via Piero Gobetti 93/3, 40129 Bologna, Italy
11
INFN-Sezione di Bologna, Viale Berti Pichat 6/2, 40127 Bologna, Italy
12
INAF-Osservatorio Astrofisico di Torino, Via Osservatorio 20, 10025 Pino Torinese, (TO), Italy
13
Dipartimento di Fisica, Università di Genova, Via Dodecaneso 33, 16146 Genova, Italy
14
INFN-Sezione di Genova, Via Dodecaneso 33, 16146 Genova, Italy
15
Department of Physics “E. Pancini”, University Federico II, Via Cinthia 6, 80126 Napoli, Italy
16
INAF-Osservatorio Astronomico di Capodimonte, Via Moiariello 16, 80131 Napoli, Italy
17
INFN Section of Naples, Via Cinthia 6, 80126 Napoli, Italy
18
Instituto de Astrofísica e Ciências do Espaço, Universidade do Porto, CAUP, Rua das Estrelas, PT4150-762 Porto, Portugal
19
Faculdade de Ciências da Universidade do Porto, Rua do Campo de Alegre, 4150-007 Porto, Portugal
20
Aix-Marseille Université, CNRS, CNES, LAM, Marseille, France
21
Dipartimento di Fisica, Università degli Studi di Torino, Via P. Giuria 1, 10125 Torino, Italy
22
INFN-Sezione di Torino, Via P. Giuria 1, 10125 Torino, Italy
23
INAF-IASF Milano, Via Alfonso Corti 12, 20133 Milano, Italy
24
Centro de Investigaciones Energéticas, Medioambientales y Tecnológicas (CIEMAT), Avenida Complutense 40, 28040 Madrid, Spain
25
Port d’Informació Científica, Campus UAB, C. Albareda s/n, 08193 Bellaterra, (Barcelona), Spain
26
Institute for Theoretical Particle Physics and Cosmology (TTK), RWTH Aachen University, 52056 Aachen, Germany
27
Institute of Cosmology and Gravitation, University of Portsmouth, Portsmouth PO1 3FX, UK
28
INAF-Osservatorio Astronomico di Roma, Via Frascati 33, 00078 Monteporzio Catone, Italy
29
Dipartimento di Fisica e Astronomia “Augusto Righi” – Alma Mater Studiorum Università di Bologna, Viale Berti Pichat 6/2, 40127 Bologna, Italy
30
Instituto de Astrofísica de Canarias, Calle Vía Láctea s/n, 38204 San Cristóbal de La Laguna, Tenerife, Spain
31
Institute for Astronomy, University of Edinburgh, Royal Observatory, Blackford Hill, Edinburgh EH9 3HJ, UK
32
Jodrell Bank Centre for Astrophysics, Department of Physics and Astronomy, University of Manchester, Oxford Road, Manchester M13 9PL, UK
33
European Space Agency/ESRIN, Largo Galileo Galilei 1, 00044 Frascati, Roma, Italy
34
ESAC/ESA, Camino Bajo del Castillo, s/n, Urb. Villafranca del Castillo, 28692 Villanueva de la Cañada, Madrid, Spain
35
Université Claude Bernard Lyon 1, CNRS/IN2P3, IP2I Lyon, UMR 5822, Villeurbanne F-69100, France
36
Institute of Physics, Laboratory of Astrophysics, Ecole Polytechnique Fédérale de Lausanne (EPFL), Observatoire de Sauverny, 1290 Versoix, Switzerland
37
Institut de Ciències del Cosmos (ICCUB), Universitat de Barcelona (IEEC-UB), Martí i Franquès 1, 08028 Barcelona, Spain
38
Institució Catalana de Recerca i Estudis Avançats (ICREA), Passeig de Lluís Companys 23, 08010 Barcelona, Spain
39
UCB Lyon 1, CNRS/IN2P3, IUF, IP2I Lyon, 4 Rue Enrico Fermi, 69622 Villeurbanne, France
40
Department of Astronomy, University of Geneva, Ch. d’Ecogia 16, 1290 Versoix, Switzerland
41
Departamento de Física, Faculdade de Ciências, Universidade de Lisboa, Edifício C8, Campo Grande, PT1749-016 Lisboa, Portugal
42
Instituto de Astrofísica e Ciências do Espaço, Faculdade de Ciências, Universidade de Lisboa, Campo Grande, 1749-016 Lisboa, Portugal
43
INFN-Padova, Via Marzolo 8, 35131 Padova, Italy
44
INAF-Istituto di Astrofisica e Planetologia Spaziali, Via del Fosso del Cavaliere, 100, 00100 Roma, Italy
45
Université Paris-Saclay, Université Paris Cité, CEA, CNRS, AIM, 91191 Gif-sur-Yvette, France
46
Space Science Data Center, Italian Space Agency, Via del Politecnico snc, 00133 Roma, Italy
47
Aix-Marseille Université, CNRS/IN2P3, CPPM, Marseille, France
48
Istituto Nazionale di Fisica Nucleare, Sezione di Bologna, Via Irnerio 46, 40126 Bologna, Italy
49
INAF-Osservatorio Astronomico di Padova, Via dell’Osservatorio 5, 35122 Padova, Italy
50
Dipartimento di Fisica “Aldo Pontremoli”, Università degli Studi di Milano, Via Celoria 16, 20133 Milano, Italy
51
Institute of Theoretical Astrophysics, University of Oslo, P.O. Box 1029 Blindern, 0315 Oslo, Norway
52
Jet Propulsion Laboratory, California Institute of Technology, 4800 Oak Grove Drive, Pasadena, CA 91109, USA
53
Felix Hormuth Engineering, Goethestr. 17, 69181 Leimen, Germany
54
Technical University of Denmark, Elektrovej 327, 2800 Kgs. Lyngby, Denmark
55
Cosmic Dawn Center (DAWN), Denmark
56
Max-Planck-Institut für Astronomie, Königstuhl 17, 69117 Heidelberg, Germany
57
NASA Goddard Space Flight Center, Greenbelt, MD 20771, USA
58
Department of Physics and Helsinki Institute of Physics, Gustaf Hällströmin katu 2, 00014 University of Helsinki, Finland
59
Université de Genève, Département de Physique Théorique and Centre for Astroparticle Physics, 24 Quai Ernest-Ansermet, CH-1211 Genève 4, Switzerland
60
Department of Physics, P.O. Box 64 00014 University of Helsinki, Finland
61
Helsinki Institute of Physics, Gustaf Hällströmin katu 2, University of Helsinki, Helsinki, Finland
62
NOVA Optical Infrared Instrumentation Group at ASTRON, Oude Hoogeveensedijk 4, 7991 PD Dwingeloo, The Netherlands
63
Centre de Calcul de l’IN2P3/CNRS, 21 Avenue Pierre de Coubertin, 69627 Villeurbanne Cedex, France
64
Universität Bonn, Argelander-Institut für Astronomie, Auf dem Hügel 71, 53121 Bonn, Germany
65
INFN-Sezione di Roma, Piazzale Aldo Moro, 2 – c/o Dipartimento di Fisica, Edificio G. Marconi, 00185 Roma, Italy
66
Dipartimento di Fisica e Astronomia “Augusto Righi” – Alma Mater Studiorum Università di Bologna, Via Piero Gobetti 93/2, 40129 Bologna, Italy
67
Department of Physics, Institute for Computational Cosmology, Durham University, South Road, DH1 3LE Durham, UK
68
University of Applied Sciences and Arts of Northwestern Switzerland, School of Engineering, 5210 Windisch, Switzerland
69
Institut d’Astrophysique de Paris, 98bis Boulevard Arago, 75014 Paris, France
70
Institut d’Astrophysique de Paris, UMR 7095, CNRS, and Sorbonne Université, 98 Bis Boulevard Arago, 75014 Paris, France
71
Institut de Física d’Altes Energies (IFAE), The Barcelona Institute of Science and Technology, Campus UAB, 08193 Bellaterra, (Barcelona), Spain
72
School of Mathematics and Physics, University of Surrey, Guildford, Surrey GU2 7XH, UK
73
European Space Agency/ESTEC, Keplerlaan 1, 2201 AZ Noordwijk, The Netherlands
74
School of Mathematics, Statistics and Physics, Newcastle University, Herschel Building, Newcastle-upon-Tyne NE1 7RU, UK
75
DARK, Niels Bohr Institute, University of Copenhagen, Jagtvej 155, 2200 Copenhagen, Denmark
76
Waterloo Centre for Astrophysics, University of Waterloo, Waterloo, Ontario N2L 3G1, Canada
77
Department of Physics and Astronomy, University of Waterloo, Waterloo, Ontario N2L 3G1, Canada
78
Perimeter Institute for Theoretical Physics, Waterloo, Ontario N2L 2Y5, Canada
79
Centre National d’Etudes Spatiales – Centre Spatial de Toulouse, 18 Avenue Edouard Belin, 31401 Toulouse Cedex 9, France
80
Institute of Space Science, Str. Atomistilor, nr. 409 Măgurele, Ilfov 077125, Romania
81
Departamento de Astrofísica, Universidad de La Laguna, 38206 La Laguna, Tenerife, Spain
82
Consejo Superior de Investigaciones Cientificas, Calle Serrano 117, 28006 Madrid, Spain
83
Dipartimento di Fisica e Astronomia “G. Galilei”, Università di Padova, Via Marzolo 8, 35131 Padova, Italy
84
Institut für Theoretische Physik, University of Heidelberg, Philosophenweg 16, 69120 Heidelberg, Germany
85
Institut de Recherche en Astrophysique et Planétologie (IRAP), Université de Toulouse, CNRS, UPS, CNES, 14 Av. Edouard Belin, 31400 Toulouse, France
86
Université St Joseph; Faculty of Sciences, Beirut, Lebanon
87
Departamento de Física, FCFM, Universidad de Chile, Blanco Encalada 2008, Santiago, Chile
88
Universität Innsbruck, Institut für Astro- und Teilchenphysik, Technikerstr. 25/8, 6020 Innsbruck, Austria
89
Institut d’Estudis Espacials de Catalunya (IEEC), Edifici RDIT, Campus UPC, 08860 Castelldefels, Barcelona, Spain
90
Satlantis, University Science Park, Sede Bld 48940, Leioa-Bilbao, Spain
91
Institute of Space Sciences (ICE, CSIC), Campus UAB, Carrer de Can Magrans, s/n, 08193 Barcelona, Spain
92
Centre for Electronic Imaging, Open University, Walton Hall, Milton Keynes MK7 6AA, UK
93
Instituto de Astrofísica e Ciências do Espaço, Faculdade de Ciências, Universidade de Lisboa, Tapada da Ajuda, 1349-018 Lisboa, Portugal
94
Universidad Politécnica de Cartagena, Departamento de Electrónica y Tecnología de Computadoras, Plaza del Hospital 1, 30202 Cartagena, Spain
95
INFN-Bologna, Via Irnerio 46, 40126 Bologna, Italy
96
Kapteyn Astronomical Institute, University of Groningen, PO Box 800 9700 AV Groningen, The Netherlands
97
Infrared Processing and Analysis Center, California Institute of Technology, Pasadena, CA 91125, USA
98
INAF, Istituto di Radioastronomia, Via Piero Gobetti 101, 40129 Bologna, Italy
99
Junia, EPA department, 41 Bd Vauban, 59800 Lille, France
100
NRC Herzberg, 5071 West Saanich Rd, Victoria, BC V9E 2E7, Canada
101
INAF-Osservatorio Astrofisico di Arcetri, Largo E. Fermi 5, 50125 Firenze, Italy
102
Dipartimento di Fisica e Astronomia, Università di Firenze, Via G. Sansone 1, 50019 Sesto Fiorentino, Firenze, Italy
103
Department of Physics and Astronomy, University of British Columbia, Vancouver, BC V6T 1Z1, Canada
⋆⋆ Corresponding author; This email address is being protected from spambots. You need JavaScript enabled to view it.
Received:
9
October
2024
Accepted:
25
October
2024
Abstract
Core ellipticals, which are massive early-type galaxies with almost constant inner surface brightness profiles, are the result of dry mergers. During these events, a binary black hole (BBH) is formed, destroying the original cuspy central regions of the merging objects and scattering stars that are not on tangential orbits. The size of the emerging core correlates with the mass of the finally merged black hole (BH). Therefore, the determination of the size of the core of massive early-type galaxies provides key insights not only into the mass of the black hole, but also into the origin and evolution of these objects. In this work, we report the first Euclid-based dynamical mass determination of a supermassive black hole (SMBH). To this end, we study the center of NGC 1272, the second most luminous elliptical galaxy in the Perseus cluster, combining the Euclid Visible Camera (VIS) photometry coming from the Early Release Observations (EROs) of the Perseus cluster with the Visible Integral-field Replicable Unit Spectrograph (VIRUS) spectroscopic observations at the Hobby-Eberly Telescope (HET). The core of NGC 1272 is detected on the Euclid VIS image. Its size is 1.″29 ± 0.″07 or 0.45 kpc, which was determined by fitting PSF-convolved core-Sérsic and Nuker-law functions. We deproject the surface brightness profile of the galaxy, finding that the galaxy is axisymmetric and nearly spherical. The two-dimensional stellar kinematics of the galaxy is measured from the VIRUS spectra by deriving optimally regularized non-parametric line-of-sight velocity distributions. Dynamical models of the galaxy are constructed using our axisymmetric and triaxial Schwarzschild codes. We measure a BH mass of (5 ± 3)×109 M⊙, which is in line with the expectation from the MBH − rb correlation, but is eight times larger than predicted by the MBH − σ correlation (at 1.8σ significance). The core size, rather than the velocity dispersion, allows one to select galaxies harboring the most massive BHs. The spatial resolution, wide area coverage, and depth of the Euclid (Wide and Deep) surveys allow us to find cores of passive galaxies that are larger than 2 kpc at a redshift of up to 1.
Key words: galaxies: elliptical and lenticular / cD / galaxies: individual: NGC 1272 / galaxies: kinematics and dynamics / galaxies: nuclei / galaxies: photometry
This paper is published on behalf of the Euclid Consortium.
© The Authors 2024
 Open Access article, published by EDP Sciences, under the terms of the Creative Commons Attribution License (https://creativecommons.org/licenses/by/4.0), which permits unrestricted use, distribution, and reproduction in any medium, provided the original work is properly cited.
This article is published in open access under the Subscribe to Open model.
Open access funding provided by Max Planck Society.
1. Introduction
Massive early-type galaxies (ETGs) are commonly found at the centre of galaxy clusters and are the result of mostly dissipationless mergers. During these events, nuclear supermassive black hole (SMBH) binaries are formed. Gravitational slingshots eject stars on radial orbits from the center of the remnant galaxy, destroying the power-law surface brightness distributions found in lower-luminosity ellipticals (Faber et al. 1997). Gravitational wave recoil (Khonji et al. 2024) can enhance the scouring mechanism. Through this core-scouring mechanism, the surface brightness profile I(r) of most massive ETGs becomes almost constant within a break (or core) radius rb, and for r ≤ rb one finds I(r)∝r−γ, with γ < 0.3 (Faber et al. 1997). The break radius rb is tightly correlated with the mass of the central black hole (BH); moreover, it is anti-correlated with the central surface brightness (Mehrgan et al. 2019). A broader correlation between rb and the luminosity or stellar mass of the galaxies is also established (Laine et al. 2003; Rusli et al. 2013a). Moreover, within rb, the distribution of orbits becomes tangentially anisotropic (Thomas et al. 2014), as only stars avoiding the center can survive the scouring (Milosavljević & Merritt 2001; Thomas et al. 2014; Rantala et al. 2018, 2019). Although alternative explanations for the formation of cores have been proposed, such as the “tidal deposition” discussed by Nasim et al. (2021) and the feedback by active galactic nuclei (see Teyssier et al. 2011; Martizzi et al. 2012; Choi et al. 2018), they fail to explain this tangential anisotropy signature.
Black holes with dynamically measured masses of greater than 1010 M⊙, that is, hypermassive black holes (HMBHs), are still rare. They cannot be found using the MBH − σ relation (Saglia et al. 2016): a dissipationless merger of equal-mass galaxies doubles the mass of the resulting BH, maintains or even reduces the velocity dispersion of the system (Lauer et al. 2007; Naab et al. 2009). A large fraction of brightest cluster galaxies (BCGs) in the local Universe have relatively low velocity dispersions: Kluge & Bender (2023) measure on average a velocity dispersion of 250 km s−1 for their large sample of BCGs, with only 10% of objects having σ > 300 km s−1. The MBH − σ relation translates σ = 250 km s−1 into BH masses of around only about 6 × 10⁸ M⊙. Nevertheless, HMBHs are found in BCGs, the largest (4 × 10¹⁰ M⊙) known being in Holm 15A (Mehrgan et al. 2019). The most promising way to search for HMBHs is to select massive ETGs, in particular BCGs, with core radii of the order of or larger than 0.6 kpc (Holm 15A has a core radius of 4 kpc). The Euclid Wide and Deep Surveys will allow us to find these objects in large numbers and out to redshifts of around 1 thanks to their excellent spatial resolution, large area coverage, and depth. Here we report the detection of the  (or 0.45 kpc) core of NGC 1272, which was measured on the Euclid Early Release Observations (EROs) Visible Camera (VIS) (Euclid Collaboration 2024a) image of the Perseus cluster (Cuillandre et al. 2024a,b), and the dynamical determination of the mass of its BH.
The galaxy is the second brightest elliptical galaxy of Perseus. With a total magnitude in the V band corrected for Galactic absorption VT0 of 11.27 (de Vaucouleurs et al. 1991), we compute a luminosity of L = 1.3 × 10¹¹ L⊙ using 72 Mpc as the distance of the cluster (Kluge et al. 2024), with which 1″ translates to 0.35 kpc. The stellar mass of the galaxy is 9 × 10¹¹ M⊙ using our dynamically determined mass-to-light ratio of 7 M⊙/L⊙ (see Sect. 3) and the effective radius quoted in de Vaucouleurs et al. (1991) is 57″ or 20 kpc. With these properties, NGC 1272 belongs to the class of cD galaxies, the most massive ellipticals. We expect such objects to be triaxial with a low V/σ parameter (the ratio between the mean stellar velocity V and the velocity dispersion σ of the galaxy), to be detected as radio sources, and to have extended X-ray emission (Bender et al. 1989). Consistent with this, Veale et al. (2017) present the stellar kinematics of NGC 1272 obtained with the VIRUS-P spectrograph and classify the galaxy kinematically as a slow rotator. Park et al. (2017) detect a faint radio source at its center and McBride & McCourt (2014) study the properties of the double jets emerging from the center of the galaxy (which are bent with a curvature radius of 2 kpc). Arakawa et al. (2019) detect and study the X-ray minicorona of the galaxy, measuring a temperature of 0.63 keV and a size of 1.2 kpc.
The structure of the paper is as follows. In Sect. 2 we describe the photometric and spectroscopic observations of NGC 1272. The dynamical modeling is presented in Sect. 3. We draw our conclusions in Sect. 4, where we discuss the prospect of exploiting the Euclid survey (Euclid Collaboration 2024b) to find large cores up to redshift 1 in order to probe the formation redshift of the most massive BHs in galaxies.
2. Observations
NGC 1272 was observed during the early days of the Euclid survey as part of the pointings covering the Perseus galaxy cluster (Cuillandre et al. 2024b), one of the objects selected for the EROs program. The VIS (Euclid Collaboration 2024a) and Near-Infrared Spectrometer and Photometer (NISP) (Euclid Collaboration 2024c) ERO images of the cluster were reduced as described in Cuillandre et al. (2024a). Based on this dataset, studies of the Perseus intracluster light and intracluster globular clusters are described in Kluge et al. (2024) and a study of its dwarf galaxy population is presented by Marleau et al. (2024).
In Sect. 2.1 we make quantitative use of the VIS image of NGC 1272, with pixel size and resolution of  and
and  , respectively. We used the near-infrared images (with
  pixels) to assess the absence of dust in the central regions of the galaxy. The complementary spectroscopic information is described in Sect. 2.2.
2.1. Photometry
Figure 1 shows a cutout of the Euclid VIS image of NGC 1272. The isophote shape analysis was performed following Bender & Moellenhoff (1987). Figure 2 shows the resulting surface brightness profile calibrated to the V band for compatibility with the results of Rusli et al. (2013a). We perform the calibration by integrating the profile in circular apertures, which we shift to reproduce the aperture photometry listed in Hyperleda1. Finally, we adopt the correction for Galactic absorption and cosmological surface brightness dimming adopted in de Vaucouleurs et al. (1991) by matching our aperture magnitude within 57″ –which is the half-luminosity radius– to VT0 + 2.5log102 –which is half the total luminosity of the galaxy. We measure the photometry out to 147″ from the center, down to 24.9 mag arcsec−2; this is five times the distance reached by our stellar kinematics. The galaxy is round, with ellipticities smaller than 0.15 and isophotes showing only small deviations from perfect ellipses. For radii of greater than about 45″, the center of the isophotes starts to drift toward the direction of NGC 1275 and the position angle twists by 70°. In the inner  , the surface brightness increase toward the center slows down, pointing to the presence of a core.
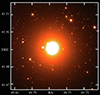 |
Fig. 1. Cutout of the Euclid VIS image of NGC 1272. |
The sizes of the cores of ETGs have been determined in the past using the Nuker law (Faber et al. 1997) and the core-Sérsic law (Graham et al. 2003). The advantages and disadvantages of the two approaches have been discussed at length in the literature and depend on how well the outer parts of a galaxy can be described by either law. In the following, we rely on both approaches as a way to estimate the systematic effects that affect our measurements.
We begin the process of deriving the size of the core of NGC 1272 by fitting a 5000 × 5000 pixel (250″ × 250″) image extracted from the VIS mosaic with the PSF-convolved core-Sérsic function provided by the Imfit code2 of Erwin (2015), using the image of a star extracted in the vicinity of the galaxy as the PSF. Fitting larger cutouts requires prohibitively large computing time without improving the determination of the core size. As implemented in Erwin (2015), the core-Sérsic function is
![Mathematical equation: $$ \begin{aligned} I_{\rm CS}(r) = I^{\prime }\left[1+\left(\frac{r_{\rm b}}{r}\right)^{\alpha _{\rm CS}}\right]^{\gamma _{\rm CS}/\alpha _{\rm CS}} \exp \left[-b_n\left( \frac{r^{\alpha _{\rm CS}}+r_{\rm b}^{\alpha _{\rm CS}}}{r_{\rm e}^{\alpha _{\rm CS}}} \right)^{1/n\alpha _{\rm CS}}\right], \end{aligned} $$](/articles/aa/full_html/2024/12/aa52548-24/aa52548-24-eq6.gif) (1)
(1)
where
![Mathematical equation: $$ \begin{aligned} I^{\prime }=I_{\rm CS,b}2^{-\gamma _{\rm CS}/\alpha _{\rm CS}} \exp \left[b_n\left(2^{1/{\alpha _{\rm CS}}}\frac{r_{\rm b}}{r_{\rm e}}\right)^{1/n}\right], \end{aligned} $$](/articles/aa/full_html/2024/12/aa52548-24/aa52548-24-eq7.gif) (2)
(2)
and bn ∼ 2n − 1/3 + 4/405n. Similarly, the Sérsic function is
![Mathematical equation: $$ \begin{aligned} I_{\rm S}(r) = I_{\rm e}\exp \left[-b_n \left(\frac{r}{r_{\rm e}}\right)^{1/n}\right]. \end{aligned} $$](/articles/aa/full_html/2024/12/aa52548-24/aa52548-24-eq8.gif) (3)
(3)
Here, re is the half-luminosity radius, Ie the intensity at re, n the Sérsic index, rb the break radius, and ICS, b is the intensity at rb. Also, −γCS is the slope of the power-law inner profile, and αCS specifies the sharpness of the transition to the outer, Sérsic profile. In Tables 1 and 2, we provide the values of μV(re) and μV(rb) that calibrate the surface brightness profiles μS = −2.5 log10 IS/Ie + μV(re) and μCS = −2.5 log10 ICS/ICS, b + μV(rb) to the V band.
Parameters of the core-Sérsic best fits.
Parameters of the second Sérsic component.
The core-Sérsic model reproduces the surface brightness of the galaxy accurately, with residuals of less than 0.1 mag, even if it has a constant ellipticity and position angle. The resulting parameters of the fit are given in Table 1; in particular, the size of the core is perfectly resolved by the spatial resolution of the VIS image. According to Thomas et al. (2016), we expect this to match the size of the sphere of influence of the central black hole of the galaxy. The best fitting value of n (21.1) is unrealistically large, as is that of re, which is two orders of magnitudes larger than the size of the fitted image; this stems from the almost power-law behavior of the outer profile, which is typical of BCGs (Kluge & Bender 2023). Both parameters are to be considered as a convenient parametrization of the galaxy profile out to the limit of the image and increasing with the image size. More importantly, the values of rb and γCS show no significant dependency on this choice. The statistical errors listed in Table 1 (and further below in Tables 2 and 3) are minute, because there are a great many independent points in the image. We have rounded them up to the first or second digit. Fitting the surface brightness of Fig. 2 with a one-dimensional Sérsic profile without PSF convolution delivers similar results within the systematic errors estimated below.
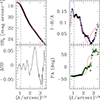 |
Fig. 2. Photometry profiles of NGC 1272. Top Left: Surface brightness profile of NGC 1272 measured from the Euclid VIS image, calibrated to the V band, and corrected for Galactic absorption and cosmological dimming, as a function of the 1/4 power of the semi-major distance A on the sky in arcsec. Bottom Left: Difference ΔSB between the surface brightness profile of NGC 1272 and the surface brightness of the core-Sérsic+Sérsic model. Right: Ellipticity 1 − B/A, where B is the semi-minor axis length on the sky (top) and PA (bottom) as a function of the 1/4 power of A. The solid red lines show the core-Sérsic+Sérsic model. The dashed lines show its core radius. The blue line shows the ellipticity profile of the axisymmetric deprojection. The green line shows the PA profile of the triaxial deprojection. |
Parameters of the Nuker best fit.
We further explore the systematic errors affecting the estimation of the core radius by fitting the same image with the Imfit implementation of the (PSF-convolved) Nuker-law:
![Mathematical equation: $$ \begin{aligned} I_{\rm N}(r) = I_{\rm N,b} 2^{(\beta _{\rm N}-\gamma _{\rm N})/\alpha _{\rm N}} \left(\frac{r_{\rm b}}{r}\right)^{\gamma _{\rm N}}\left[1+\left(\frac{r}{r_{\rm b}}\right)^{\alpha _{\rm N}}\right]^{(\gamma _{\rm N}-\beta _{\rm N})/\alpha _{\rm N}}. \end{aligned} $$](/articles/aa/full_html/2024/12/aa52548-24/aa52548-24-eq9.gif) (4)
(4)
Here, −γN is the asymptotic logarithmic slope inside rb, −βN is the asymptotic outer slope, and the αN parameter describes the sharpness of the break; IN, b is the intensity at rb and the surface brightness profile μN(r) = − 2.5log10IN/IN, b + μV(rb) is calibrated to the V band through the value of μV(rb) given in Table 3. The Nuker fit delivers a core-size determination similar to that found using the core-Sérsic function (see Table 3) and, as noted above, describes the outer power-law behavior of the galaxy profile reasonably well.
Inspection of the NIR images (see Fig. 3) confirms that the central region of NGC 1272 is not strongly affected by dust: core sizes of between  and
and  are obtained when fitting these images. The slope of the surface brightness profile inside rb is between 0.1 (from the Nuker fit) and 0.2 (from the core-Sérsic fit), which is within the range expected for core ellipticals (Faber et al. 1997).
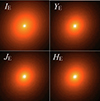 |
Fig. 3. The IE, YE, JE, and HE cutouts of the inner 6″ × 6″ of NGC 1272. |
A more realistic estimate of the effective radius of the galaxy that better catches the varying ellipticity and Position Angle (PA) profiles (see Fig. 2) is obtained by fitting a two-component model: an inner core-Sérsic plus an outer Sérsic profile. The results are listed in Tables 1 and 2. The core radius is somewhat larger and the inner slope γCS of the profile somewhat shallower than above. Fig. 4 shows the fractional residuals between the image and the model, the absolute values of which are always smaller than 0.1. The surface brightness is reproduced with a root mean square (RMS) of 0.028 mag (see Fig. 2).
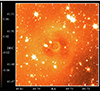 |
Fig. 4. Percentage residuals after subtraction of the core-Sérsic + Sérsic model. |
de Rijcke et al. (2009) collected F555W and F814W ACS images of NGC 1272 with the Hubble Space Telescope (HST), obtaining a factor two better pixel size and resolution than our Euclid VIS images. We performed core-Sérsic fits to 179″ × 184″ images with Imfit, fixing the value of n to the result obtained from the VIS image. The results are given in Table 1, where we calibrate μb = −2.5log Ib to the V band as above. We measured  and
and  in the two bands, demonstrating that possible color gradients do not strongly affect the determination of rb.
The statistical errors reported in Tables 1, 2, and 3 are very small due to the large number of pixels fitted. More significant are the systematic errors that come from the different fitting functions used to measure rb. Averaging the five estimates of rb presented above, we obtain  , or 0.45 kpc, with a RMS of
  , which we adopt as our measurement error.
We deproject the surface brightness profile using the axisymmetric deprojection code of Magorrian (1999), assuming that the galaxy is edge-on, as is usually done in such cases (Lipka & Thomas 2021). Other options are explored below, when triaxial deprojections are considered. The blue line in Fig. 2 shows that this deprojection reproduces the ellipticity profiles, but cannot reproduce the PA profile (assumed to be constant in axisymmetric deprojections). The intrinsic flattening profile q(r) –where q = c/a and a and c are the major and minor semi-axes of the galaxy– derived in this way is around 0.9 (see Fig. 5).
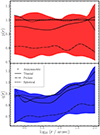 |
Fig. 5. Profiles of p(r) and q(r) (where p = b/a, q = c/a, and a, b, and c are the major, intermediate, and minor semi-axis of the galaxy) derived from the axisymmetric (dotted), triaxial (full line), spherical (dashed line), and prolate (dashed-dotted line) deprojections of the galaxy, as a function of distance r from the center. The red and blue shaded areas show the whole range of allowed deprojections with RMS ≤ 1.2 × RMSmin (de Nicola et al. 2020, 2022a,b). |
We also explore the range of possible triaxial deprojections following de Nicola et al. (2020). The reconstructed p and q profiles (where p = b/a and b is the intermediate semi-axis of the galaxy) are shown in Fig. 5 and demonstrate that the galaxy is almost spherical and close to axisymmetric, with p ≈ 1 and q ≈ 0.9. For some viewing angles, the strong PA radial variation (see Fig. 5) forces a twist of the principal axis with radius, which explains why the p and q profiles can become larger than one at the same distance (de Nicola et al. 2020).
The deprojection with the lowest RMS in surface brightness is obtained at angles of (θ, ϕ, ψ) = (64 ° ,124 ° ,23 ° ), roughly 26° above the equatorial plane and about 34° away from the intermediate axis. However, it is clear that reconstructing the true orientation of the galaxy is almost impossible given its almost spherical geometry. The green line in Fig. 2 shows that this deprojection indeed reproduces the PA profile (in addition to the ellipticity profile). We further explore alternative deprojections with comparably good surface brightness RMS: a (mildly) prolate and an (almost) spherical deprojection (similar to the axisymmetric one, but matching the PA twist). Both are obtained assuming that the line of sight is along the major axis of the galaxy and starting the deprojection routine with constant profiles q(r) = 0.7 and q(r) = 0.95 in the prolate and spherical cases, respectively.
2.2. Spectroscopic observations and kinematics
We observed NGC 1272 spectroscopically with the Visible Integral-field Replicable Unit Spectrograph (VIRUS) at the Hobby-Eberly Telescope (HET) on 3 March 2022. The pointing of the telescope was optimized to observe NGC 1275; as a result, the integral field unit (IFU) covering NGC 1272 was slightly off-center and did not uniformly cover the galaxy. The seeing reported during the observations was  . The diameter of the single fiber is
  . Given the size of the core measured above (a diameter of
  ), the spatial resolution of this data set is marginally sufficient to resolve the sphere of influence of the central BH of the galaxy. Rusli et al. (2013b) find that in such cases, an unbiased recovery of the BH mass is possible if the dark matter (DM) halo of the galaxy is taken into account in the dynamical modeling, as done here; see below. The data cover a wavelength interval ranging from 3470 Å to 5540 Å with a spectral resolution of 5.6 Å.
We used the Voronoi tessellation method of Cappellari & Copin (2003) to spatially bin the spectral data for a target average signal-to-noise ratio (S/N) of 40. With this target S/N, spectra were only binned together starting approximately 3″ from the center of the galaxy, thus maximizing the spatial resolution of our data within the core region. This resulted in a total of 110 spatial bins. We measured the stellar kinematics using WINGFIT (Thomas, in prep.), which delivers optimally smoothed non-parametric line-of-sight velocity distributions (LOSVDs) using the model optimization approach of Thomas & Lipka (2022). The stellar kinematic fits were performed using the MILES library (Sánchez-Blázquez et al. 2006) of stellar templates. Following the strategy laid out in Mehrgan et al. (2023), we performed a careful pre-selection of templates in order to minimize distortions of the LOSVDs due to template mismatch. To this end, we fitted the average spectrum of the central 2″ of the galaxy using all the templates of the MILES library with a Gauss-Hermite LOSVD that was fixed to be symmetric around a line-of-sight velocity of zero. We selected the set of 18 templates that in the best fit received a non-zero weight. Using this set, we fitted all bins of the galaxy with non-parametric LOSVDs without the symmetry costraint. Also following Mehrgan et al. (2023), we used no additive polynomials in the fit and only a minimal third-order multiplicative polynomial. Fits were performed in the wavelength interval between 4700 and 5400 Å. The resulting two-dimensional kinematic maps are shown in Fig. 6; the corresponding radial profiles can be seen in Fig. 7. We measured the stellar kinematics out to a maximum distance of 38″, or 0.66 times the effective radius quoted by de Vaucouleurs et al. (1991). The galaxy has small mean rotation (at most v = 20 km s−1), a relatively low velocity dispersion σ of around 250 km s−1, increasing to 270 km s−1 toward the center (admittedly with only one point within 1 arcsec of the center), an almost zero third-order Hermite parameter h3, and a zero fourth-order Hermite parameter h4, which decreases to about −0.05 toward the center. The data presented by Veale et al. (2017) match these findings, though the h4 obtained by these authors is always approximately zero. We averaged (v2 + σ2)0.5, with equal or luminosity weights, to get an estimate of σe, that is, the velocity dispersion within the half-luminosity radius (even if our stellar kinematics only reach out to two-thirds of re; see above). We find σe = 247 ± 3 km s−1, which we adopt in Sect. 4.
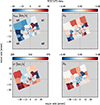 |
Fig. 6. Two-dimensional stellar kinematics of NGC 1272. The horizontal and vertical dashed lines show the major and minor axes of the galaxy, respectively. North is up and east is to the left. |
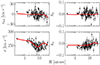 |
Fig. 7. Radial stellar kinematics of NGC 1272. The red lines show the axisymmetric fit to the stellar kinematics of the galaxy (black data points with error bars) as a function of the distance R from the center of the galaxy on the sky. |
For the subsequent dynamical analysis, we sampled and fit the non-parametric LOSVDs between ±1400 km s−1 with Nvel = 25 velocity bins, and no Hermite parameters. An example LOSVD measured near the center of the galaxy is shown in Fig. 8, where the red line connects the values produced by the best-fitting base model. Finally, to ensure that we are able to estimate the uncertainties of our dynamical models, we split our data into four quadrants (indicated by q1, q2, q3, and q4 in Fig. 6) along the minor and major axes of the galaxy for the axisymmetric dynamical models, and into two halves (quadrants q1/q4, northern, and q2/q3, southern) split by the major axis for the triaxial analysis. By modeling quadrants or halves independently, we can estimate the uncertainties of our best-fit modeling parameters from the scatter between them. However, the orientation and positioning of the IFU give us a much better coverage of the q3 and q4 quadrants, or the east side of the galaxy. Therefore, we expect the most reliable dynamical constraints to come from these regions.
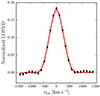 |
Fig. 8. Line-of-sight velocity distribution measured at 4 arcsec from the center of NGC 1272 (filled circles with error bars). The red line connects the values provided by the base model. |
3. Dynamical modeling
Given the results presented in Fig. 5 (NGC 1272 is almost spherical and axisymmetric, but triaxiality and a prolate shape cannot be excluded), we construct both axisymmetric and triaxial Schwarzschild models of the galaxy. The axisymmetric modeling is similar to that of Mehrgan et al. (2024), with the following modifications. We fit the four quadrants both independently and together, determining the mass of the central BH MBH and the stellar mass-to-light ratio Υ* (i.e., no radial variations of Υ* are considered because of the rather coarse and sparse sampling of our stellar kinematics). We use a spherical Zhao (1996) halo with α = 1 and β = 3, defined by ρ10; the DM density at 10 kpc; rs, the scale radius of the halo, which is allowed to vary up to the largest distance probed by our kinematics (Lipka et al. 2024); and γDM ≥ 0, the inner slope of the DM halo:
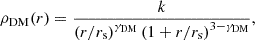 (5)
(5)
and k = ρ10(10 kpc/rs)γDM(1+10 kpc/rs)3 − γDM.
The triaxial modeling follows de Nicola et al. (2024) and uses the Schwarzschild code SMART (Neureiter et al. 2021) to determine MBH and Υ*, considering a DM halo that is triaxial, described by its shape parameters pDM and qDM plus ρ10 and γDM, fixing rs to a large value (158 kpc). We model the northern (quadrants q1 and q4 in Fig. 6) and southern (quadrants q2 and q3 in Fig. 6) halves of the galaxy separately to assess the systematic uncertainties.
In both the axisymmetric and triaxial cases, we maximize the quantity  to determine the orbital weights. Here χ2 is calculated from the model fit to the observed non-parametric LOSVDs, and S is the Boltzmann entropy (Thomas et al. 2004). The deprojected light distributions are used as a constraint and the parameter
  is the smoothing of the models, which is determined following the prescriptions of Lipka & Thomas (2021) and Thomas & Lipka (2022), which involve the determination of the effective degrees of freedom meff. The parameters MBH, Υ*, ρ10, and rs (in both the axisymmetric and triaxial cases), plus pDM and qDM in the triaxial case, are determined by minimizing the generalized Akaike information criterion AICp = χ2 + 2 meff over a grid of
  values.
The resulting axisymmetric best fits to the kinematics are shown in Fig. 7; the derived parameters for the different fit types are listed in Table 4. Our base result is the axisymmetric model of the entire stellar kinematic data set; it fits the kinematics very well (see red line in Fig. 7), delivering a reduced χ2 of χ2/(Ndata − meff) = 0.91. Figure 9 shows MBH, Υ*, V, ρ10, and γDM as a function of the quality of the fit measured by the AICp value. Every parameter is well constrained, with small statistical errors (so small that we do not quote them in Table 4). In particular, we detect a BH of 5 × 10⁹ M⊙, a mass-to-light ratio Υ*, V of 7.1 M⊙/L⊙, in between the values derived from our stellar population analysis for the Kroupa or the Salpeter initial mass function (IMF, see below), a DM density at 10 kpc (approximately 30″) similar to the values reported for other massive elliptical galaxies (Mehrgan et al. 2024), and a cored DM density profile. We compute the radius rSOI of the sphere of influence of the BH as the distance from the center where the total mass (stellar plus DM without a BH) is equal to MBH (Thomas et al. 2016). Our rSOI matches the value of rb and is larger than half the FWHM of the seeing of the spectroscopic observations. This, together with the modeling of the DM halo of the galaxy, allows an unbiased estimate of the BH mass (Rusli et al. 2013b).
 |
Fig. 9. Results of the axisymmetric modeling of NGC 1272 of the complete stellar kinematic dataset. As a function of the quality of the fits measured by the AICp we show: from left to right, and from top to bottom: the BH mass MBH; the dynamical V-band mass-to-light ratio Υ*, V; the DM density at 10 kpc ρ10; and the inner slope of the DM density profile γDM. The gray points show the individual models, the red dots show the best-fitting model, and the black lines show the lower envelope of the distributions of gray points. |
Parameters of the axisymmetric and triaxial dynamical modeling.
We gauge our (systematic) errors by looking first at the axisymmetric modeling of the two quadrants covering larger parts of the galaxy, q3 and q4. Here the BH mass can be as low as 1.8 × 10⁹ M⊙ and Υ*, V as large as 8.9 M⊙/L⊙, with slightly larger DM densities. Further insights into our systematic errors are gained from the triaxial SMART modeling. All models fit the kinematic data well, with χ2/(Ndata − meff) between 0.6 and 1.0 The best-fitting triaxial model delivers MBH = (5.9 ± 1.7)×109 M⊙, averaging over the two halves of the galaxy; the smallest and largest values for the BH mass are obtained when fitting the southern half of the galaxy (where the kinematic coverage is relatively sparse) in the prolate and spherical cases, respectively. The dynamical stellar mass-to-light ratio Υ*, V ranges from 4 to 7.7 M⊙/L⊙. The density of the DM halo (log10ρ10/[M⊙ kpc−3] = 7.3 ± 0.3, averaging over all triaxial models and halves) agrees with the axisymmetric result. The slope γDM of the DM density profile is smaller than 1, but possibly steeper than the cored halo determined axisymmetrically. The errors quoted in Table 4 for our base result are the RMSs of the nine listed best-fitting models. Finally, the best-fitting shape of the DM halo is spherical (pDM = qDM = 1), with only the prolate case delivering pDM = 0.9.
Figure 10 summarizes the spherically averaged stellar and total mass profiles derived by the dynamical models we considered. The total mass distribution is robustly determined in the region probed by the measured kinematics, with only small deviations between the different models. Inside the sphere of influence (roughly the size of the core), the differences between the profiles reflect the observed scatter in the BH mass. The stellar mass profiles scale according to the derived Υ*, V values. The DM mass is equal to the stellar mass at approximately the outermost radius probed by our stellar kinematics. Using the best-fit value of Υ*, V = 7.1 M⊙/L⊙, we estimate the total stellar mass of the galaxy from the total luminosity L = 1.3 × 10¹¹ L⊙ quoted in Sect. 1 to be 9 × 10¹¹ M⊙, which we use in Sect. 4.
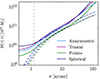 |
Fig. 10. Spherically averaged mass profiles of NGC 1272. The solid and dashed lines show the total and stellar profiles, respectively. The triaxial, prolate, and spherical models are averaged over the two sides. The vertical dashed line shows the position of the core radius. |
The anisotropy β profile (where β = 1 − σT2/σR2, and σT and σR are the spherical tangential and radial velocity dispersions, respectively) is not particularly well constrained, but displays the typical feature of core ellipticals (Thomas et al. 2014). Figure 11 shows that the β profile of the base model becomes tangentially anisotropic within the core radius (the result of core scouring) and more isotropic in the outer part, similarly to the spherical model. The triaxial model is overall mildly tangentially anisotropic, while the prolate model is radially anisotropic outside the core.
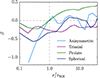 |
Fig. 11. Anisotropy profiles β (where β = 1 − σT2/σR2, and σT and σR are the spherical tangential and radial velocity dispersions, respectively) of the different models. The triaxial, prolate, and spherical models are averaged over the two sides. The distances to the center are in units of the core radius. |
Measuring Lick indices and fitting them with the simple stellar population models of Thomas et al. (2003) and Maraston (2005), we find that the best fit has a simple stellar population as old as the Universe, a metallicity of slightly above solar, and is more than a factor of two overabundant in α-elements. The derived V-band mass-to-light ratio is 6 M⊙/L⊙ with a Kroupa IMF and 8 M⊙/L⊙ with a Salpeter IMF. This matches the dynamically determined Υ*, V, without unambiguously preferring one of the two options.
Finally, we estimate the mass that has been expelled from the core during its formation. We consider the core-Sérsic solution obtained with the second Sérsic component (see second line of Table 1) and consider the Sérsic function with n = 12.1,  , and μV(re) = 23.57, which reproduces the core-Sérsic solution outside the core region. We integrate the luminosity difference, or the luminosity deficit Ldef, between the two functions out to 8″, finding Ldef = 2.7 × 10⁹ L⊙. Using the dynamically determined Υ*, V = 7 M⊙/L⊙, this translates into a mass deficit of Mdef = 1.9 × 10¹⁰ M⊙, or 3.8 MBH, in the range found by Rusli et al. (2013a). According to the simulations of Gualandris & Merritt (2008), mass deficits of up to 5 × MBH can result from single dry mergers.
4. Conclusions
We present a measurement of the size (0.45 kpc) of the core of NGC 1272 based on the VIS image of the Perseus cluster taken as part of the Euclid ERO campaign. The dynamical modeling of the stellar kinematics collected with the VIRUS spectrograph at the HET allows us to measure the mass (5 ± 3)×109 M⊙ of the BH at the center of the galaxy. While in line with expectations from the MBH − rb correlation of Thomas et al. (2016), the central surface brightness versus MBH correlation of Mehrgan et al. (2019), and the MBH − M* relation of Saglia et al. (2016), the BH mass of NGC 1272 is a factor of 8 larger than predicted by the MBH − σ relation of Saglia et al. (2016), or 1.8 times the 1σ error combined with the intrinsic scatter in the relation (see Fig. 12). This corroborates the conclusion that the velocity dispersion is not the best indicator of the BH mass for core galaxies with stellar masses of the order of or larger than 1012 M⊙: five out of the six galaxies with such a stellar mass in Fig. 12 have BH masses larger than predicted by the MBH − σ relation. Therefore, the most efficient and rapid method to search for galaxies harboring the most massive BHs is to look for passive objects with large cores and low central surface brightness. In the local Universe, a galaxy with a core size of 1 kpc contains a BH with a mass of 1010 M⊙.
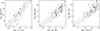 |
Fig. 12. Position of NGC 1272 (in red) on the MBH − rb (left), the MBH − M* (middle), and the MBH − σ (right) relation. The black data points are from Rusli et al. (2013a), Saglia et al. (2016), Thomas et al. (2016), Mehrgan et al. (2019), Neureiter et al. (2023), and de Nicola et al. (2024). The blue data points are core ellipticals with a stellar mass of greater than 1012 M⊙. While the galaxy follows the MBH − rb given by Thomas et al. (2016) and the MBH − M* relation of Saglia et al. (2016) for the sample of CorePowerE, it deviates by a factor of 8.4 from the MBH − σ relation of Saglia et al. (2016), or by a factor of 1.8 of the 1σ error combined with the intrinsic scatter in the relation (shown by the dotted lines). |
The Euclid VIS images in the IE band deliver a PSF with FWHM ≈  and a pixel size of
  , with a depth of 24.5 mag in the Wide Survey (at 10σ for extended sources) and 2 mag deeper in the Deep Survey. Near-infrared YE, JE, and HE images provide photometry with
  pixels. Combined with ground-based images, the surveys will deliver not only photometric redshifts for each detected source, but also physical parameters, such as stellar masses and sizes. At the end of the mission, the Wide Survey will cover about 14 000 deg2 of extragalactic sky, along with 50 deg2 at the Deep Survey. This unprecedented dataset will allow us to search for galaxies with cores that are larger than 2 kpc out to a redshift of 1 (where they will subtend an angle of
  on the sky) as a function of stellar mass. We plan to establish the redshift up to which the correlation between rb and total stellar mass exists (see Fig. 13) and study its possible evolution with a large statistical sample, indirectly probing the possible coevolution of BHs and galaxy properties at the highest BH mass end. For example, the blue cross in Fig. 13 shows the position of the BCG of the EDISCS cluster CL1216 at a redshift of 0.8 (Saglia et al. 2010). We measured the size of its core in the available HST images, deriving 1.5 kpc (or
  ) from a core-Sérsic fit, and 2.21 kpc (or
  ) from a Nuker fit. Such a core will be measurable in the VIS mosaics of the Wide survey. With a stellar mass of log10M*/M⊙ = 11.82, the BCG appears to have a larger core than local core ellipticals of similar mass. Using the local rb − MBH relation, we estimate that an HMBH with a mass of greater than 1010 M⊙ could be already in place at such a high redshift in this galaxy. Spectroscopic follow-up (possible at the Extremely Large Telescope) of selected galaxies with similarly large and bright cores will deliver the dynamical mass confirmation.
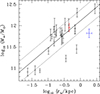 |
Fig. 13. Correlation between the core radius rb and stellar mass M*. The black datapoints are from Rusli et al. (2013a), Saglia et al. (2016), Thomas et al. (2016), Mehrgan et al. (2019), Neureiter et al. (2023), and de Nicola et al. (2024). NGC 1272 is shown in red. The blue cross shows the position of the BCG on the EDISCS cluster CL1216 (Saglia et al. 2010). The black solid line shows log10(M*/M⊙) = 0.64log10(rb/kpc)+12.1; the dotted lines show the ±1σ scatter (0.26 dex) in the relation. |
Acknowledgments
This work has made use of the Early Release Observations (ERO) data from the Euclid mission of the European Space Agency (ESA), 2024, https://doi.org/10.57780/esa-qmocze3. The Euclid Consortium acknowledges the European Space Agency and a number of agencies and institutes that have supported the development of Euclid, in particular the Agenzia Spaziale Italiana, the Austrian Forschungsförderungsgesellschaft funded through BMK, the Belgian Science Policy, the Canadian Euclid Consortium, the Deutsches Zentrum für Luft- und Raumfahrt, the DTU Space and the Niels Bohr Institute in Denmark, the French Centre National d’Etudes Spatiales, the Fundação para a Ciência e a Tecnologia, the Hungarian Academy of Sciences, the Ministerio de Ciencia, Innovación y Universidades, the National Aeronautics and Space Administration, the National Astronomical Observatory of Japan, the Netherlandse Onderzoekschool Voor Astronomie, the Norwegian Space Agency, the Research Council of Finland, the Romanian Space Agency, the State Secretariat for Education, Research, and Innovation (SERI) at the Swiss Space Office (SSO), and the United Kingdom Space Agency. A complete and detailed list is available on the Euclid website (https://www.euclid-ec.org). RS, RB and MF acknowledge support by the Deutsches Zentrum für Luft- und Raumfahrt (DLR) grant 50 QE 1101. RS, RB, ML thank the Hobby Eberly Telescope (HET) project for allocating the observations and the technical support. The Hobby-Eberly Telescope is a joint project of the University of Texas at Austin, the Pennsylvania State University, Ludwig-Maximilians-Universität München, and Georg-August Universität Gottingen. The HET is named in honor of its principal benefactors, William P. Hobby and Robert E. Eberly. The HET Collaboration acknowledges the support and resources from the Texas Advanced Computing Center. We thank the Resident Astronomers and Telescope Operators at the HET for the skillful execution of our observations with VIRUS. We would like to acknowledge that the HET is built on Indigenous land. Moreover, we would like to acknowledge and pay our respects to the Carrizo & Comecrudo, Coahuiltecan, Caddo, Tonkawa, Comanche, Lipan Apache, Alabama-Coushatta, Kickapoo, Tigua Pueblo, and all the American Indian and Indigenous Peoples and communities who have been or have become a part of these lands and territories in Texas, here on Turtle Island.
References
- Arakawa, N., Fabian, A. C., & Walker, S. A. 2019, MNRAS, 488, 894 [NASA ADS] [CrossRef] [Google Scholar]
- Bender, R., & Moellenhoff, C. 1987, A&A, 177, 71 [NASA ADS] [Google Scholar]
- Bender, R., Surma, P., Doebereiner, S., Moellenhoff, C., & Madejsky, R. 1989, A&A, 217, 35 [Google Scholar]
- Cappellari, M., & Copin, Y. 2003, MNRAS, 342, 345 [Google Scholar]
- Choi, E., Somerville, R. S., Ostriker, J. P., Naab, T., & Hirschmann, M. 2018, ApJ, 866, 91 [NASA ADS] [CrossRef] [Google Scholar]
- Cuillandre, J.-C., Bertin, E., Bolzonella, M., et al. 2024a, A&A, submitted [arXiv:2405.13496] [Google Scholar]
- Cuillandre, J.-C., Bolzonella, M., Boselli, A., et al. 2024b, A&A, submitted [arXiv:2405.13501] [Google Scholar]
- de Nicola, S., Saglia, R. P., Thomas, J., Dehnen, W., & Bender, R. 2020, MNRAS, 496, 3076 [CrossRef] [Google Scholar]
- de Nicola, S., Saglia, R. P., Thomas, J., et al. 2022a, ApJ, 933, 215 [NASA ADS] [CrossRef] [Google Scholar]
- de Nicola, S., Neureiter, B., Thomas, J., Saglia, R. P., & Bender, R. 2022b, MNRAS, 517, 3445 [NASA ADS] [CrossRef] [Google Scholar]
- de Nicola, S., Thomas, J., Saglia, R. P., et al. 2024, MNRAS, 530, 1035 [NASA ADS] [CrossRef] [Google Scholar]
- de Rijcke, S., Penny, S. J., Conselice, C. J., Valcke, S., & Held, E. V. 2009, MNRAS, 393, 798 [NASA ADS] [CrossRef] [Google Scholar]
- de Vaucouleurs, G., de Vaucouleurs, A., Corwin, H. G., et al. 1991, Third Reference Catalogue of Bright Galaxies (New York: Springer) [Google Scholar]
- Erwin, P. 2015, ApJ, 799, 226 [Google Scholar]
- Euclid Collaboration (Cropper, M. S., et al.) 2024a, A&A, in press, https://doi.org/10.1051/0004-6361/202450996 [Google Scholar]
- Euclid Collaboration (Mellier, Y., et al.) 2024b, A&A, in press, https://doi.org/10.1051/0004-6361/202450810 [Google Scholar]
- Euclid Collaboration (Jahnke, K., et al.) 2024c, A&A, in press, https://doi.org/10.1051/0004-6361/202450786 [Google Scholar]
- Faber, S. M., Tremaine, S., Ajhar, E. A., et al. 1997, AJ, 114, 1771 [NASA ADS] [CrossRef] [Google Scholar]
- Graham, A. W., Erwin, P., Trujillo, I., & Asensio Ramos, A. 2003, AJ, 125, 2951 [CrossRef] [Google Scholar]
- Gualandris, A., & Merritt, D. 2008, ApJ, 678, 780 [NASA ADS] [CrossRef] [Google Scholar]
- Khonji, N., Gualandris, A., Read, J. I., & Dehnen, W. 2024, ApJ, 974, 204 [NASA ADS] [CrossRef] [Google Scholar]
- Kluge, M., & Bender, R. 2023, ApJS, 267, 41 [NASA ADS] [CrossRef] [Google Scholar]
- Kluge, M., Hatch, N. A., Montes, M., et al. 2024, A&A, in press, https://doi.org/10.1051/0004-6361/202450772 [Google Scholar]
- Laine, S., van der Marel, R. P., Lauer, T. R., et al. 2003, AJ, 125, 478 [Google Scholar]
- Lauer, T. R., Faber, S. M., Richstone, D., et al. 2007, ApJ, 662, 808 [NASA ADS] [CrossRef] [Google Scholar]
- Lipka, M., & Thomas, J. 2021, MNRAS, 504, 4599 [NASA ADS] [CrossRef] [Google Scholar]
- Lipka, M., Thomas, J., Saglia, R., et al. 2024, ApJ, 976, 17 [NASA ADS] [CrossRef] [Google Scholar]
- Magorrian, J. 1999, MNRAS, 302, 530 [NASA ADS] [CrossRef] [Google Scholar]
- Maraston, C. 2005, MNRAS, 362, 799 [NASA ADS] [CrossRef] [Google Scholar]
- Marleau, F. R., Cuillandre, J.-C., Cantiello, M., et al. 2024, A&A, in press, https://doi.org/10.1051/0004-6361/202450799 [Google Scholar]
- Martizzi, D., Teyssier, R., & Moore, B. 2012, MNRAS, 420, 2859 [CrossRef] [Google Scholar]
- McBride, J., & McCourt, M. 2014, MNRAS, 442, 838 [NASA ADS] [CrossRef] [Google Scholar]
- Mehrgan, K., Thomas, J., Saglia, R., et al. 2019, ApJ, 887, 195 [NASA ADS] [CrossRef] [Google Scholar]
- Mehrgan, K., Thomas, J., Saglia, R., Parikh, T., & Bender, R. 2023, ApJ, 948, 79 [NASA ADS] [CrossRef] [Google Scholar]
- Mehrgan, K., Thomas, J., Saglia, R., et al. 2024, ApJ, 961, 127 [NASA ADS] [CrossRef] [Google Scholar]
- Milosavljević, M., & Merritt, D. 2001, ApJ, 563, 34 [Google Scholar]
- Naab, T., Johansson, P. H., & Ostriker, J. P. 2009, ApJ, 699, L178 [Google Scholar]
- Nasim, I. T., Gualandris, A., Read, J. I., et al. 2021, MNRAS, 502, 4794 [NASA ADS] [CrossRef] [Google Scholar]
- Neureiter, B., Thomas, J., Saglia, R., et al. 2021, MNRAS, 500, 1437 [Google Scholar]
- Neureiter, B., Thomas, J., Rantala, A., et al. 2023, ApJ, 950, 15 [NASA ADS] [CrossRef] [Google Scholar]
- Park, S., Yang, J., Oonk, J. B. R., & Paragi, Z. 2017, MNRAS, 465, 3943 [NASA ADS] [CrossRef] [Google Scholar]
- Rantala, A., Johansson, P. H., Naab, T., Thomas, J., & Frigo, M. 2018, ApJ, 864, 113 [Google Scholar]
- Rantala, A., Johansson, P. H., Naab, T., Thomas, J., & Frigo, M. 2019, ApJ, 872, L17 [Google Scholar]
- Rusli, S. P., Erwin, P., Saglia, R. P., et al. 2013a, AJ, 146, 160 [CrossRef] [Google Scholar]
- Rusli, S. P., Thomas, J., Saglia, R. P., et al. 2013b, AJ, 146, 45 [NASA ADS] [CrossRef] [Google Scholar]
- Saglia, R. P., Sánchez-Blázquez, P., Bender, R., et al. 2010, A&A, 524, A6 [NASA ADS] [CrossRef] [EDP Sciences] [Google Scholar]
- Saglia, R. P., Opitsch, M., Erwin, P., et al. 2016, ApJ, 818, 47 [Google Scholar]
- Sánchez-Blázquez, P., Peletier, R. F., Jiménez-Vicente, J., et al. 2006, MNRAS, 371, 703 [Google Scholar]
- Teyssier, R., Moore, B., Martizzi, D., Dubois, Y., & Mayer, L. 2011, MNRAS, 414, 195 [NASA ADS] [CrossRef] [Google Scholar]
- Thomas, J., & Lipka, M. 2022, MNRAS, 514, 6203 [CrossRef] [Google Scholar]
- Thomas, D., Maraston, C., & Bender, R. 2003, MNRAS, 339, 897 [NASA ADS] [CrossRef] [Google Scholar]
- Thomas, J., Saglia, R. P., Bender, R., et al. 2004, MNRAS, 353, 391 [NASA ADS] [CrossRef] [Google Scholar]
- Thomas, J., Saglia, R. P., Bender, R., Erwin, P., & Fabricius, M. 2014, ApJ, 782, 39 [Google Scholar]
- Thomas, J., Ma, C.-P., McConnell, N. J., et al. 2016, Nature, 532, 340 [NASA ADS] [CrossRef] [Google Scholar]
- Veale, M., Ma, C.-P., Thomas, J., et al. 2017, MNRAS, 464, 356 [Google Scholar]
- Zhao, H. 1996, MNRAS, 278, 488 [Google Scholar]
All Tables
All Figures
|
Fig. 1. Cutout of the Euclid VIS image of NGC 1272. |
| In the text | |
|
Fig. 2. Photometry profiles of NGC 1272. Top Left: Surface brightness profile of NGC 1272 measured from the Euclid VIS image, calibrated to the V band, and corrected for Galactic absorption and cosmological dimming, as a function of the 1/4 power of the semi-major distance A on the sky in arcsec. Bottom Left: Difference ΔSB between the surface brightness profile of NGC 1272 and the surface brightness of the core-Sérsic+Sérsic model. Right: Ellipticity 1 − B/A, where B is the semi-minor axis length on the sky (top) and PA (bottom) as a function of the 1/4 power of A. The solid red lines show the core-Sérsic+Sérsic model. The dashed lines show its core radius. The blue line shows the ellipticity profile of the axisymmetric deprojection. The green line shows the PA profile of the triaxial deprojection. |
| In the text | |
|
Fig. 3. The IE, YE, JE, and HE cutouts of the inner 6″ × 6″ of NGC 1272. |
| In the text | |
|
Fig. 4. Percentage residuals after subtraction of the core-Sérsic + Sérsic model. |
| In the text | |
|
Fig. 5. Profiles of p(r) and q(r) (where p = b/a, q = c/a, and a, b, and c are the major, intermediate, and minor semi-axis of the galaxy) derived from the axisymmetric (dotted), triaxial (full line), spherical (dashed line), and prolate (dashed-dotted line) deprojections of the galaxy, as a function of distance r from the center. The red and blue shaded areas show the whole range of allowed deprojections with RMS ≤ 1.2 × RMSmin (de Nicola et al. 2020, 2022a,b). |
| In the text | |
|
Fig. 6. Two-dimensional stellar kinematics of NGC 1272. The horizontal and vertical dashed lines show the major and minor axes of the galaxy, respectively. North is up and east is to the left. |
| In the text | |
|
Fig. 7. Radial stellar kinematics of NGC 1272. The red lines show the axisymmetric fit to the stellar kinematics of the galaxy (black data points with error bars) as a function of the distance R from the center of the galaxy on the sky. |
| In the text | |
|
Fig. 8. Line-of-sight velocity distribution measured at 4 arcsec from the center of NGC 1272 (filled circles with error bars). The red line connects the values provided by the base model. |
| In the text | |
|
Fig. 9. Results of the axisymmetric modeling of NGC 1272 of the complete stellar kinematic dataset. As a function of the quality of the fits measured by the AICp we show: from left to right, and from top to bottom: the BH mass MBH; the dynamical V-band mass-to-light ratio Υ*, V; the DM density at 10 kpc ρ10; and the inner slope of the DM density profile γDM. The gray points show the individual models, the red dots show the best-fitting model, and the black lines show the lower envelope of the distributions of gray points. |
| In the text | |
|
Fig. 10. Spherically averaged mass profiles of NGC 1272. The solid and dashed lines show the total and stellar profiles, respectively. The triaxial, prolate, and spherical models are averaged over the two sides. The vertical dashed line shows the position of the core radius. |
| In the text | |
|
Fig. 11. Anisotropy profiles β (where β = 1 − σT2/σR2, and σT and σR are the spherical tangential and radial velocity dispersions, respectively) of the different models. The triaxial, prolate, and spherical models are averaged over the two sides. The distances to the center are in units of the core radius. |
| In the text | |
|
Fig. 12. Position of NGC 1272 (in red) on the MBH − rb (left), the MBH − M* (middle), and the MBH − σ (right) relation. The black data points are from Rusli et al. (2013a), Saglia et al. (2016), Thomas et al. (2016), Mehrgan et al. (2019), Neureiter et al. (2023), and de Nicola et al. (2024). The blue data points are core ellipticals with a stellar mass of greater than 1012 M⊙. While the galaxy follows the MBH − rb given by Thomas et al. (2016) and the MBH − M* relation of Saglia et al. (2016) for the sample of CorePowerE, it deviates by a factor of 8.4 from the MBH − σ relation of Saglia et al. (2016), or by a factor of 1.8 of the 1σ error combined with the intrinsic scatter in the relation (shown by the dotted lines). |
| In the text | |
|
Fig. 13. Correlation between the core radius rb and stellar mass M*. The black datapoints are from Rusli et al. (2013a), Saglia et al. (2016), Thomas et al. (2016), Mehrgan et al. (2019), Neureiter et al. (2023), and de Nicola et al. (2024). NGC 1272 is shown in red. The blue cross shows the position of the BCG on the EDISCS cluster CL1216 (Saglia et al. 2010). The black solid line shows log10(M*/M⊙) = 0.64log10(rb/kpc)+12.1; the dotted lines show the ±1σ scatter (0.26 dex) in the relation. |
| In the text | |
Current usage metrics show cumulative count of Article Views (full-text article views including HTML views, PDF and ePub downloads, according to the available data) and Abstracts Views on Vision4Press platform.
Data correspond to usage on the plateform after 2015. The current usage metrics is available 48-96 hours after online publication and is updated daily on week days.
Initial download of the metrics may take a while.