Fig. 5.
Download original image
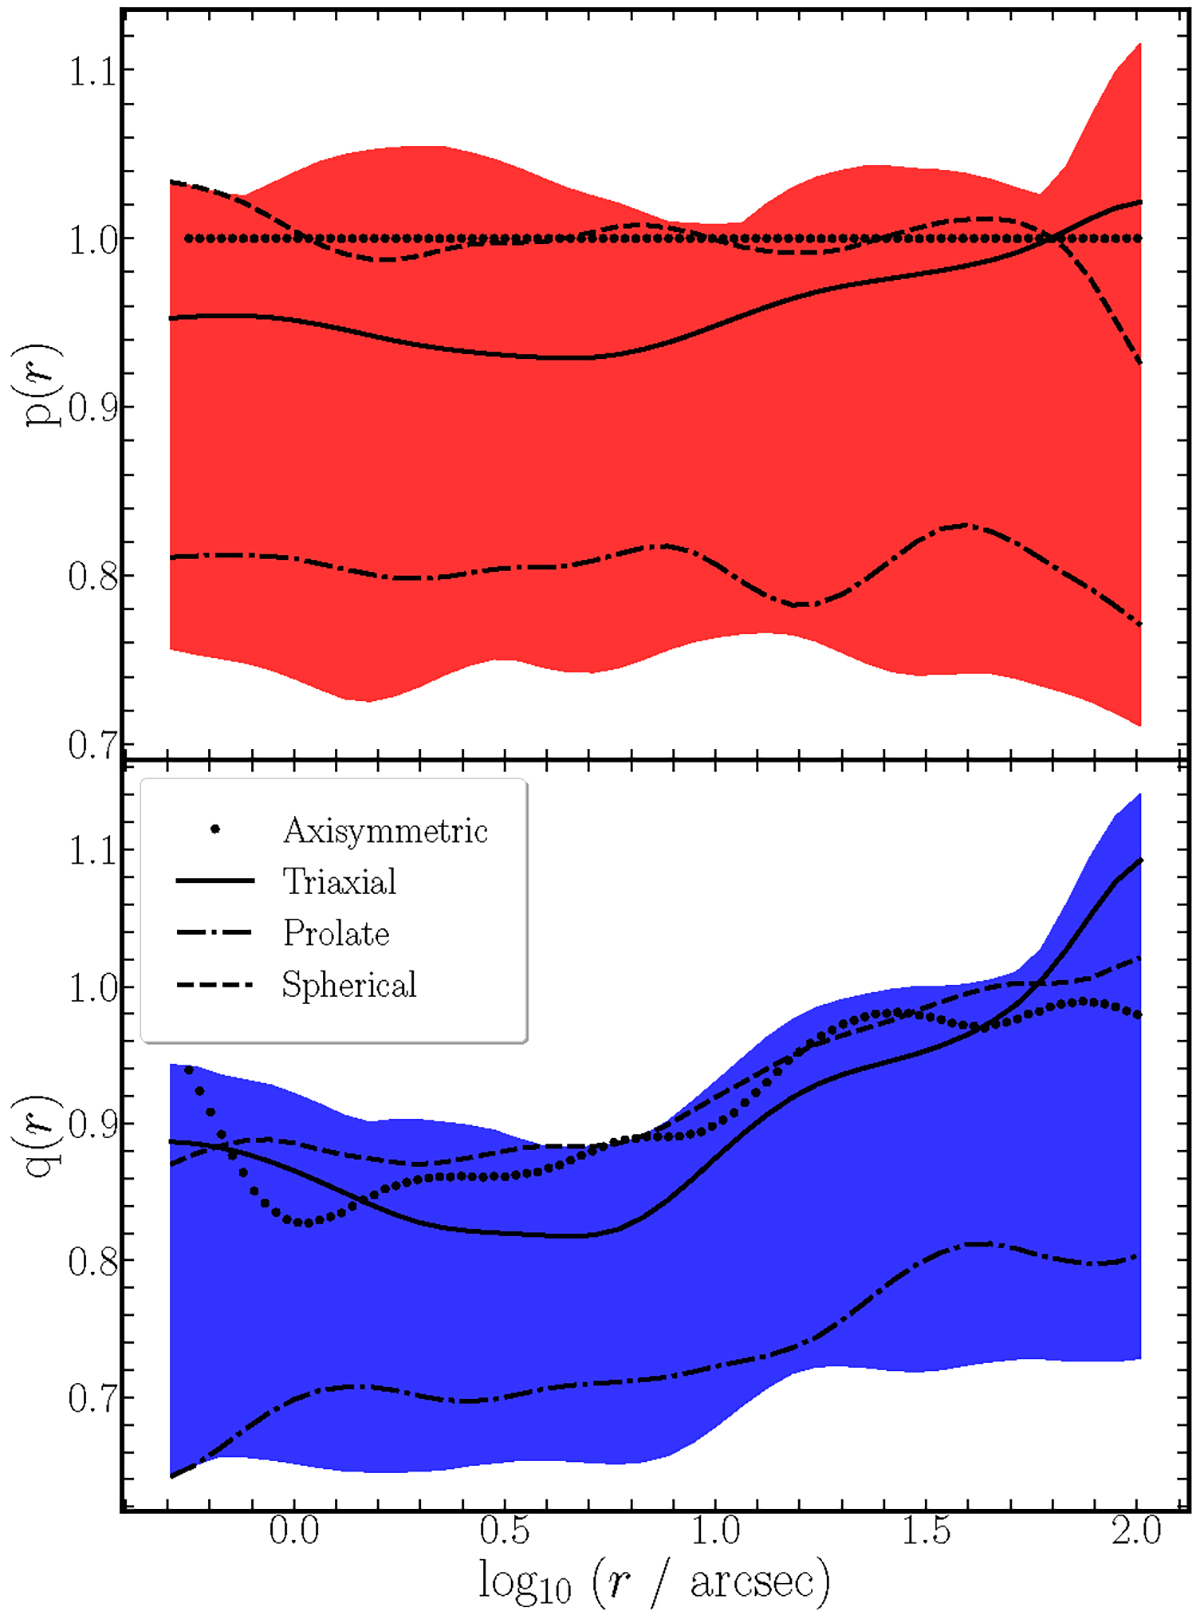
Profiles of p(r) and q(r) (where p = b/a, q = c/a, and a, b, and c are the major, intermediate, and minor semi-axis of the galaxy) derived from the axisymmetric (dotted), triaxial (full line), spherical (dashed line), and prolate (dashed-dotted line) deprojections of the galaxy, as a function of distance r from the center. The red and blue shaded areas show the whole range of allowed deprojections with RMS ≤ 1.2 × RMSmin (de Nicola et al. 2020, 2022a,b).
Current usage metrics show cumulative count of Article Views (full-text article views including HTML views, PDF and ePub downloads, according to the available data) and Abstracts Views on Vision4Press platform.
Data correspond to usage on the plateform after 2015. The current usage metrics is available 48-96 hours after online publication and is updated daily on week days.
Initial download of the metrics may take a while.