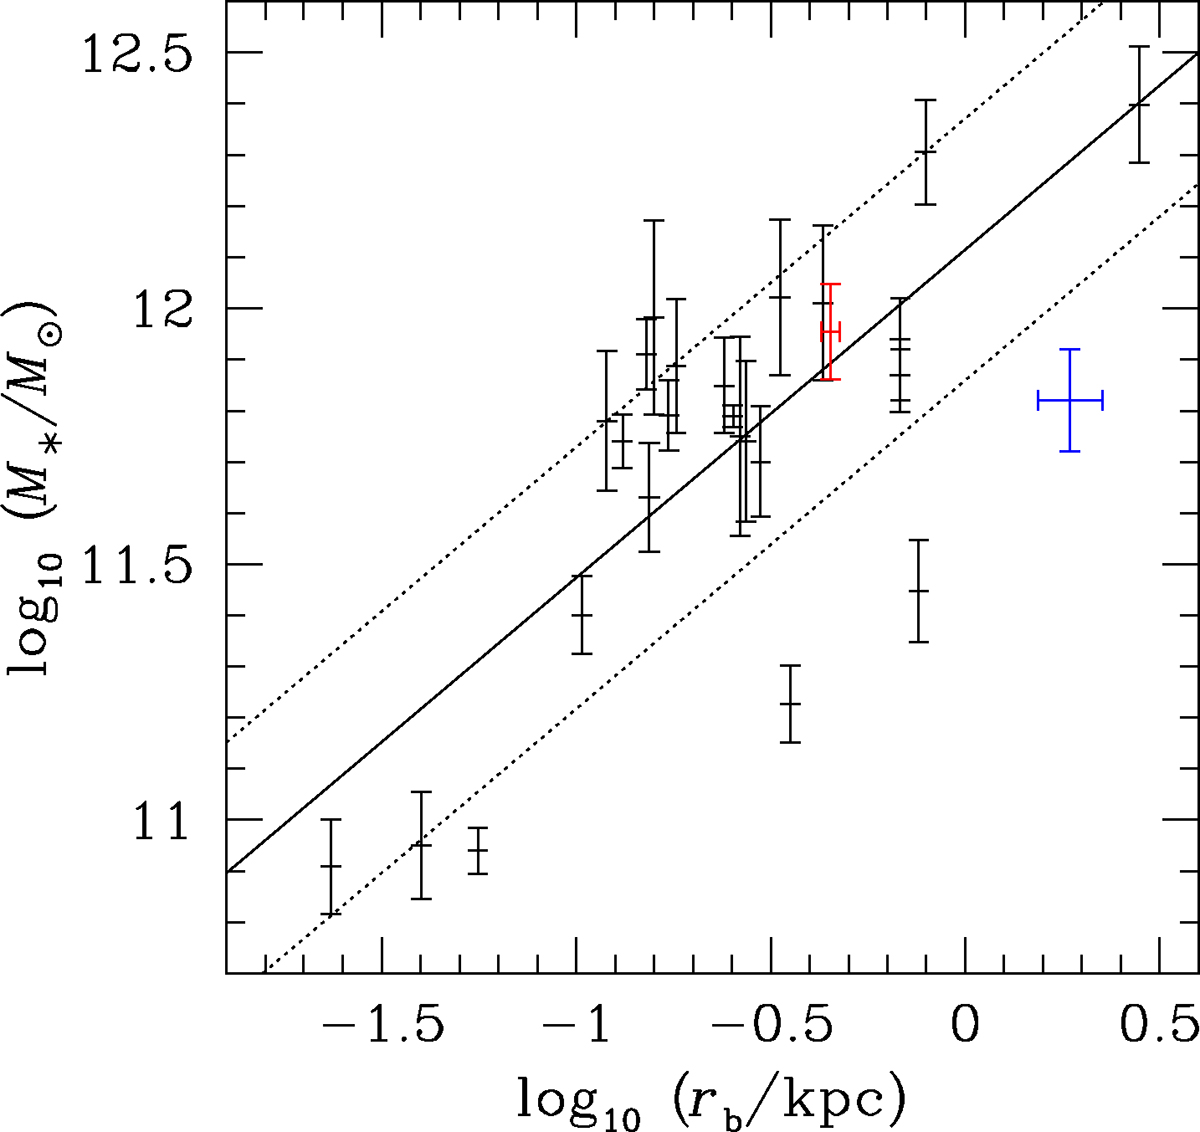
Fig. 13.
Download original image
Correlation between the core radius rb and stellar mass M*. The black datapoints are from Rusli et al. (2013a), Saglia et al. (2016), Thomas et al. (2016), Mehrgan et al. (2019), Neureiter et al. (2023), and de Nicola et al. (2024). NGC 1272 is shown in red. The blue cross shows the position of the BCG on the EDISCS cluster CL1216 (Saglia et al. 2010). The black solid line shows log10(M*/M⊙) = 0.64log10(rb/kpc)+12.1; the dotted lines show the ±1σ scatter (0.26 dex) in the relation.
Current usage metrics show cumulative count of Article Views (full-text article views including HTML views, PDF and ePub downloads, according to the available data) and Abstracts Views on Vision4Press platform.
Data correspond to usage on the plateform after 2015. The current usage metrics is available 48-96 hours after online publication and is updated daily on week days.
Initial download of the metrics may take a while.