| Issue |
A&A
Volume 692, December 2024
|
|
|---|---|---|
| Article Number | A193 | |
| Number of page(s) | 27 | |
| Section | Interstellar and circumstellar matter | |
| DOI | https://doi.org/10.1051/0004-6361/202450404 | |
| Published online | 13 December 2024 | |
The MeerKAT view on Galactic supernova remnants
1
INAF, Osservatorio Astrofisico di Catania,
Via Santa Sofia 78,
95123
Catania,
Italy
2
School of Physics and Astronomy, University of Leeds,
Leeds
LS2 9JT,
UK
3
National Radio Astronomy Observatory,
520 Edgemont Road,
Charlottesville,
VA
22903,
USA
4
South African Radio Astronomy Observatory,
2 Fir Street,
Observatory
7925,
South Africa
5
SKA Observatory,
2 Fir Street,
Observatory
7925,
South Africa
6
Department of Physics and Astronomy, West Virginia University,
Morgantown,
WV
26506,
USA
7
Adjunct Astronomer at the Green Bank Observatory,
P.O. Box 2,
Green Bank,
WV
24944,
USA
8
Center for Gravitational Waves and Cosmology, West Virginia University,
Chestnut Ridge Research Building,
Morgantown,
WV
26505,
USA
9
Department of Mathematical Sciences, University of South Africa,
Cnr Christian de Wet Rd and Pioneer Avenue, Florida Park,
1709,
Roodepoort,
South Africa
10
Department of Physics and Astronomy, Faculty of Physical Sciences, University of Nigeria,
Carver Building, 1 University Road,
Nsukka,
Nigeria
★ Corresponding author; This email address is being protected from spambots. You need JavaScript enabled to view it.
Received:
16
April
2024
Accepted:
16
October
2024
Abstract
Context. The integrated radio spectrum of supernova remnants (SNRs) and the spatial variation of the spectral indices across these extended sources are powerful tools for studying the shocks and particle acceleration processes occurring in different SNR regions. Characterization of these processes requires sensitive flux density measurements and high-resolution images, which are not always available due to observing difficulties.
Aims. We want to show the potentiality of the high-resolution SARAO MeerKAT legacy Galactic Plane Survey (SMGPS) images regarding the morphological and spectral characterization of 29 known galactic SNRs.
Methods. We used the SMGPS data at 1.284 GHz coupled with data from the GaLactic and Extragalactic All-sky Murchison Widefield Array (GLEAM) survey (0.072–0.231 GHz) to characterize the integrated spectrum of each source and search for spatial spectral variation through analysis of sensitive spectral index maps.
Results. We were able to redefine the exact morphology of four SNRs (G024.7–00.6, G051.4+00.7, G348.7+0.3, and G351.9+00.1), distinguishing them from unrelated sources or identifying new emission regions associated with them and never observed before. In many other cases, we identified in the SMGPS images several H II regions overlaid with the remnants, and we were able to estimate their spectral contribution through inspection of the spatial variation of the spectral indices across the remnants. The integrated spectral indices show a more uniform distribution with respect to what is obtained by considering the values reported in the literature.
Conclusions. We show that new sensitive and high-resolution data are crucial to firmly constraining both the integrated and spatially resolved spectrum of SNRs, especially for the less studied objects of the southern hemisphere. The comparison of our SMGPS-GLEAM spectral index maps with IR, molecular, and γ-ray images allowed us to investigate the nature of the peculiar remnant regions.
Key words: radiation mechanisms: non-thermal / ISM: supernova remnants / radio continuum: general
© The Authors 2024
 Open Access article, published by EDP Sciences, under the terms of the Creative Commons Attribution License (https://creativecommons.org/licenses/by/4.0), which permits unrestricted use, distribution, and reproduction in any medium, provided the original work is properly cited.
This article is published in open access under the Subscribe to Open model. This email address is being protected from spambots. You need JavaScript enabled to view it. to support open access publication.
1 Introduction
Supernova remnants (SNRs) result from the interaction between the stellar mass ejected during a supernova explosion and the surrounding material. The time and morphological evolution of these objects is strongly related to their interaction with an often anisotropic circumstellar medium (CSM) or interstellar medium (ISM; Dubner & Giacani 2015). These interactions make SNRs very complex objects with phenomenologically different regions related to local interaction with both atomic and molecular clouds (MCs), pulsar wind nebulae (PWNe) association, filamentary structures, and halos. The peculiar physical conditions associated with each SNR region suggest the presence of different particle populations, each with its own characteristic energy distribution and undergoing different acceleration mechanisms (Egron et al. 2017).
In the radio band, the SNR spectrum is mainly characterized by the synchrotron emission from relativistic electrons, resulting in the typical power-law shape (flux density Sν ∝ να with α ~ −0.5). This trend may change at low frequencies (below ~100 MHz) due to a thermal absorption turnover and at high frequencies (above ~10 GHz), with a possible cutoff related to the maximum energy of the accelerated electrons. The integrated spectral index and the cutoff frequency depend on the SNR evolutionary stage and are crucial parameters for constraining particle acceleration theories (Urošević 2014). Local spectral variations can also be observed within the remnant, tracing the sites where particle acceleration take place, the possible existence of PWNe, and the presence of superimposed or embedded unrelated sources.
In this scenario, a comprehensive understanding of the different radiation mechanisms occurring in SNRs can be achieved only through a detailed study of the global spectral index, the curvature of the integrated spectrum, and the local variations of the spectral index within the remnant (Dubner & Giacani 2015). This characterization requires sensitive flux density measurements in a wide frequency range (ideally ~0.1−~100 GHz) and high-resolution images at different radio frequencies. The first element is not easily achievable since for most of the known SNRs, little and often puzzling data are available in the literature. In addition, a significant dispersion of the integrated flux densities at the same frequency is usually observed due to acquisition with different instruments and in very different ages (Urošević 2014). This is especially true for the known SNRs in the southern hemisphere, for which few large radio surveys have been carried out so far. The availability of high-resolution images is crucial to precisely identifying the SNR features, distinguishing them from adjacent or overlapping unrelated sources, and providing a more correct estimation of their integrated flux density.
The different spectral features, both from an integrated and a spatially resolved point of view, are related to the age and the morphology of the SNRs, but they are also strongly affected by the peculiar environmental conditions. Therefore, a detailed study performed with a single instrument of a large sample of galactic SNRs is crucial to better understanding the morphological and evolutionary classification of these complex objects.
In this context, a great step forward is going to be achieved thanks to the new generation of radio telescopes, to which the Square Kilometre Array (SKA) pathfinders and precursors belong. The Murchison Widefield Array (MWA) SKA LOW precursor has already demonstrated its high performance on the study of candidate and new SNRs in the southern sky by exploiting the high resolution (~2 arcmin) reached in the GaLactic and Extragalactic All-sky Murchison Widefield Array (GLEAM) survey (345 deg< l < 60 deg and 180 deg< l < 240 deg) at low radio frequencies (0.072–0.231 GHz) (Hurley-Walker et al. 2019b; Hurley-Walker et al. 2019a). Recent full Stokes MeerKAT observations (856–1712 MHz) of 36 high latitude SNRs were presented by Cotton et al. (2024). They showed the potential of MeerKAT to recover complex SNR morphologies and discuss the magnetic field structure across the remnants.
Using the data acquired with MeerKAT at the central frequency of 1.284 GHz during the SARAO MeerKAT Galactic Plane Survey (SMGPS; Goedhart et al. 2024), we provide a new view of the southern SNRs with unprecedented detail. The high resolution (~8 arcsec) is crucial to correctly recovering the entire morphology of complex objects such as SNRs, highlighting both their bright and sharp, and diffuse and extended features.
In this paper, we present the SMGPS images of a selected sample of 29 Galactic SNRs and the related integrated flux density measurements. We also calculated the integrated flux densities of each SNR from the public GLEAM images and used them with the SMGPS measurements and those available in the literature to characterize the integrated spectrum of each object. By coupling SMGPS and GLEAM data, we obtained sensitive 0.155-1.284 GHz spectral index maps that are able to reveal spectral variations related to a strong interaction with the CSM or ISM, resulting from PWN or unrelated sources superimposed with the remnant structure (in almost all cases H II regions). In many cases, we observed that the SNRs are located in very crowded regions where the presence of H II regions, other SNRs, dense MCs, and young stellar objects (YSOs) reveals strong star formation activity. In these cases, the combination of high-resolution images and sensitive spectral index maps allowed us to distinguish the spectral contribution of unrelated sources from the remnants and to constrain hints regarding a possible evolutionary connection between the studied SNRs and the nearby star formation regions.
In Sect. 2 we present the SMGPS data, while in Sect. 3 the GLEAM data are briefly described. We present our results, in terms of both integrated and spatially resolved spectral characterization, in Sect. 4. A detailed treatment of each target is provided in Appendix B. In Sect. 5, we discuss the main findings obtained in the view of the overall evaluation of the SNR sample. Section 6 summarizes our conclusions.
2 SMGPS data
In the framework of the SMGPS, continuum L-band (886–1678 MHz) observations of a large portion of the Galactic plane were carried out with the 60-antenna configuration, covering 2° < l < 60°, 252° < l < 358° and |b| < 1.5°. After a mosaicking procedure, the images were provided in a set of 57 tiles, with each covering an area of 3 × 3 deg2. The final images have a synthesized beam of ~8 × 8 arcsec2, and a theoretical largest angular scale (LAS) in the range between 21 and 40 arcmin, according to the minimum baseline of 29 m. The RMS brightness distribution was estimated to be ~10–15 μJy/beam in the regions where the dynamical range is not limited by very strong sources. A full description of the observations and data products is reported in Goedhart et al. (2024).
The SMGPS data of the Galactic plane were reduced using the OBIT wide–band, wide–field imager MFIMAGE task to produce data cubes containing an intensity plane at an effective frequency of 1359.7 MHz, a spectral index plane, and 14 individual frequency planes in the frequency range 908.142–1656.724 MHz and with bandwidth ranging from 43.5 to 73.6 MHz (Goedhart et al. 2024). The first data release (DR1) of the SMGPS is available at the DOI1.
In the SMGPS catalog of extended sources, Bordiu et al. (2024) identified 260 known SNRs through crossmatching with Green’s catalog for SMGPS’s covered area (Green 2019, Green 2022). The very high detection ratio value shows the excellent capabilities of SMGPS on imaging extended, and in some cases faint, sources as well as those in the confused regions of the Galactic plane.
SMGPS images provide a deep view of the Galactic plane thanks to an unprecedented sensitivity in the southern hemisphere coupled with a high resolution. These characteristics allowed us to appreciate the complex morphology of SNRs with great detail and to extend this capability to a very large sample of objects.
3 Ancillary data
3.1 MWA data
We used the MWA public maps of the GLEAM survey available at the GLEAM Postage Stamp Service2 to compute the flux density of our targets in the 0.072–0.231 GHz frequency range. The GLEAM images have an angular resolution of ~100 arcsec, a sensitivity of 6–10 mJy/beam, and an LAS greater than 4 deg. The MWA images were released as 20 “narrowband” images (bandwidth of 7.68 MHz) or as four “wideband” images (bandwidth ~30 MHz and central frequency: 0.088, 0.118, 0.155 and 0.200 GHz). We chose to use the wideband images for their higher sensitivity (Hurley-Walker et al. 2019b), which allow more reliable flux density measurements in the case of extended and often low-brightness sources, such as SNRs, to be obtained. We calculated the flux densities through aperture photometry with background subtraction. We calculated errors adding in quadrature the calibration errors (as reported by Hurley-Walker et al. 2017) and the statistical errors. The evaluation of the statistical errors is the same as described in Sect. 4.2 for the SMGPS data. The frequency span between GLEAM and SMGPS data allowed us to improve the accuracy of the integrated spectral index evaluation for both integrated and spatially resolved spectral studies.
4 Results
4.1 The SNR sample
Our aim was to include a wide variety of SNRs ranging from typical shell-type to more complex mixed-morphology objects in order to investigate spectral features and spectral variations in connection with the age and the peculiar conditions of the local ISM.
We identified 260 known SNRs across the SMGPS-covered area, including: 157 known SNRs from Green’s catalog (Green 2022); 74 new SNR candidates from The HI, OH, Recombination line survey of the Milky Way (THOR survey; Anderson et al. 2017); 15 SNR candidates confirmed with GLEAM (Hurley-Walker et al. 2019b), and 14 new SNRs proposed by Hurley-Walker et al. (2019a) on the basis of GLEAM data. Starting from these SNRs, we selected 29 objects by following the following main criteria:
We considered the SNRs with a size less than 30 arcmin in the SMGPS images in order to avoid flux density losses related to the MeerKAT LAS.
With the aim of producing spectral index maps combining SMGPS and GLEAM data, we considered a lower limit on the SNR dimension of ~15 arcmin, which is about three times that of the MWA angular resolution at 0.155 GHz (~5.1 × 4.7 arcmin2).
We set a mean brightness threshold between GLEAM maps at 0.155 GHz and SMGPS maps at 1.284 GHz to guarantee an average uncertainty of 0.1 on the spectral index maps (see Sect. 4.3 for more details).
Among the SNRs that satisfied these criteria, we excluded the SNRs G338.1+00.4 and G351.4+0.2, which are located in complex regions where the diffuse emission and the proximity to other bright unrelated sources prevented us from properly subtracting the background. We also excluded G049.2-00.7, which was imaged between two tiles and thus difficult to mosaic, and G352.2-0.1, which is located in a region of the tile where the mosaicking procedure introduced strong artifacts. The selected SNRs are as follows: G003.8+0.3, G018.8-0.3, G021.8-0.6, G022.7-0.2, G023.3-0.3, G024.7-0.6, G032.8-0.1, G033.2-0.6, G035.6-0.4, G040.5-0.5, G045.7-0.4, G046.8-0.3, G51.26+0.09 and G51.04+0.07, G286.5-01.2, G289.7-0.3, G290.1-0.8, G291.0-0.1, G292.2-0.5, G293.8+0.6, G296.7-0.9, G296.8-0.3, G301.4-1.0, G332.4+0.1, G335.2+0.1, G337.3+1.0, G348.7+0.3, G351.7+0.8, and G351.9+0.1. We describe each SNR of the sample in Appendix B.
Most of the selected SNRs have been poorly studied so far, as demonstrated in Table B.2, where we report the flux density measurements available in the literature. This is often the case in the southern hemisphere, which has been less studied with large radio interferometric surveys. Some SNRs (e.g., G286.5-1.2 and G301.4-1.0) have only one radio flux measurement in the literature, and for them, we provide the first spectral index measurement. In several other cases, the flux densities in the literature are old (i.e., acquired with instruments limited by sensitivity, resolution, and confusion) and/or of poor quality, often obtained with different instruments, leading to a highly scattered spectrum and an imprecise spectral index estimation.
We summarize in Table 1 the general characteristics of our 29 SNRs, including the source name, the center equatorial coordinates, the angular extent as measured in the SMGPS images, and the SNR type. We also indicate in the notes column some information such as any other names with which the SNR is known, interaction with MCs, detection of the parent pulsar and/or PWN, and the overlap with H II regions. For the last point, we used the WISE catalog of the Galactic H II regions (Anderson et al. 2014), where these objects are divided into categories of “known”, when both radio recombination line (RRL) and Hα emission are measured; “candidates”, when the infrared detection is spatially coincident with radio continuum emission but RRL or Hα emission have not yet been measured; and “groups”, WISE candidates positionally coincident with known H II region complexes.
4.2 Integrated spectral characterization
We used the 14 SMGPS frequency maps (see Sect. 2) to produce total-intensity images at the central frequency of 1.284 GHz by fitting each tile, pixel by pixel, with a power-law function and using a linear function when a negative pixel is encountered. From these 1.284 GHz SMGPS maps, we obtained the images and the spectral characterization presented in this work.
In order to calculate the flux densities, two important steps were done: the careful choice of the source extraction region and the estimation of the background contribution. The latter is mainly performed due to the contamination from faint-diffuse emission, particularly in the Galactic plane region, and the presence of very large sources that overlap our targets (mostly associated with H II regions or unknown large structures, as cataloged in Bordiu et al. 2024). Artifacts related to the imaging of interferometric data, which result in artificial structures where there are negative brightness values, are possible as well. Both of these factors have an impact that depends on the peculiar region of the map. The first is dominant near the Galactic plane, while the latter is more incisive at the map edges or near very extended sources.
A precise evaluation of the spatial spectral variations requires background subtraction to be performed on the whole map, including in the SNR regions. For this reason, we fitted the SMGPS maps with a third-order polynomial function evaluated on a polygonal region and carefully chosen in order to include the diffuse emission surrounding the target and exclude the emission contribution from near unrelated sources. This procedure ensures us a zero-flux background in the regions of the maps free from emission sources. We calculated the flux density uncertainties by adding in quadrature the calibration errors (8%) and the statistical errors evaluated as σ × (Nbeams)0.5, where σ is the standard deviation associated with the background region and Nbeams is the number of beam solid angles contained in the extraction area of the target.
We analyzed the integrated spectrum of each target by using our SMGPS flux density measurements at 1.284 GHz; the GLEAM data at 0.088, 0.118, 0.155, and 0.200 GHz; and the flux densities available in the literature. We collected the literature data following the references in Green’s catalog (Green 2022) and using the flux densities reported by Trushkin (1999). The latter are available at the CATS database3 and include RATAN-600 radio telescope data and most of the measurements available in the literature. For the SNRs G032.8-0.1, G033.2-0.6, and G035.6-0.4, we also considered the flux densities calculated by Dokara et al. (2023) at 1.4 GHz with THOR and VLA Galactic Plane Survey (VGPS) data, 2.7 GHz (Effelsberg), 5.8 GHz (GLOSTAR combination), and 10.5 GHz (Nobeyama survey). All the literature data we used are reported in Table B.2. In many cases, Trushkin (1999) reported low-frequency data (below ~100 MHz), which are useful to identify possible turnovers due to the thermal plasma free–free absorption. We modeled the integrated spectrum of each source by using a simple synchrotron power-law function (Sν ∝ να) and excluding the low-frequency (≲100 MHz) data when present. We calculated the integrated spectral indices and compared them with those reported in Green’s catalog (Green 2022). The spectra and related fits are shown in the Zenodo repository4 (Figs. A.29 – A.33).
General characteristics of the selected SNRs extracted from the SMGPS images.
4.3 Spectral index maps
We produced spectral index maps from SMGPS data at 1.284 GHz and GLEAM data at 0.155 GHz. Among the four GLEAM frequency bands, we chose this one to provide the best trade-off between resolution and flux density reliability. The SMGPS and GLEAM data are characterized by a different uv coverage, providing an LAS of ~30 arcmin (at 1.284 GHz) and of ~10 degrees (at 0.155 GHz, Kapińska et al. 2017), respectively. To avoid flux density contamination from diffuse emission or unrelated sources with angular scales larger than our targets, which contribute differently in SMGPS and GLEAM images, we subtracted the background contribution in both images by fitting it with a third-order polynomial function. We used the CASA tasks CONVOLVE2D and IMREGRID to convolve the SMGPS images to the MWA beam and to regrid them onto the MWA coordinate system and pixel size, respectively. We masked both the SMGPS and GLEAM images by considering a threshold of 4σ in order to restrict the spectral index calculation only in the map regions with a significant signal in both of the frequencies. We calculated the spectral index errors by applying the error propagation law. The resulting error maps are shown in Fig. A.1 – A.28 (bottom-left). We also applied a cut to the spectral index maps for spectral index errors above 0.2–0.3 to ensure that all the spectral index map regions are meaningful. All the spectral index maps are shown in Fig. 1 with the same color scale range in order to more easily compare the spatial spectral variation of the SNRs in the sample.
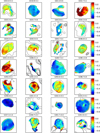 |
Fig. 1 Spectral index maps of the 29 known SNRs investigated in this work. They are obtained from the SMGPS and GLEAM data in the 0.155–1.284 GHz frequency range. The same color scale was used for comparison. The gray contours indicate the intensity levels related to the SMGPS maps convolved and regridded to the GLEAM beam and pixel size. They are the same as those reported in Figs. A1 – A.28. |
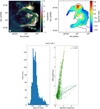 |
Fig. 2 Spatially resolved spectral index study of the SNR G023.3-00.3. Upper left: SMGPS image. The yellow circles indicate the four “known” H II regions overlapping the remnant. Upper right: spectral index map. Bottom: statistical graphs. Brightness is expressed in Jy beam−1. |
4.4 Spectral behavior through the SNR sample
The fairly high number of objects in our sample allowed us to highlight common spectral trends and attempt to associate them with SNR characteristics, such as the evolutionary phase and/or the interaction with the ISM. To identify possible spectral features, for each SNR we produced a histogram of the spectral index values across the remnant and a pixel-wise scatter plot between the SMGPS and GLEAM brightness (hereafter the “BB-plot”). The spectral inspection graphs for each SNR are reported on the Zenodo repository starting from Fig. A.34.
The two graphs allowed us to identify the contribution of unrelated sources with characteristic spectral indices, even when they are spatially overposed with the remnant. The identification of these sources by eye on the SNR maps can be difficult, particularly in the lower resolution MWA images. An example is provided in Fig. 2 (SNR G023.3-0.3), where two different spectral contribution are clearly evident in the BB-plot. In the figure, several points show a very flat trend compared to the remaining bulk (likely belonging to the SNR). Four “known” H II regions are indeed located in the northern SNR rim (indicated with yellow circles in Fig. 2), but their emission is completely embedded in the remnant, making them indistinguishable in the SMGPS image. In these cases, we fitted the two spectral components with a linear model by using the RANSAC Regressor algorithm (Fischler & Bolles 1981) implemented by the Python library SCIKIT-LEARN5 (Pedregosa et al. 2011). This method iteratively guesses inliers and outliers within the data set and is particularly robust for fitting a linear model to faulty data, allowing us to identify possible different linear tracks inside the main data pattern. We also cross-checked the goodness of this method by modeling the BB-plot of some SNRs with the Hough Transform algorithm, which led to consistent results.
For G023.3-0.3, we obtained a spectral index of −0.54 associated with the remnant and α = 0.667 for the superimposed H II regions. This method provides a more correct estimation of the SNR spectral index than both the mean spectral index calculated from the two starting maps, from which it is difficult to carefully identify and discard unrelated sources, and the integrated spectral index from the SED that is often affected by strong scattering among the measurements. We also noted that, in this particular case, the two contributions are not revealed by the histogram, probably because the four H II regions are located close to each other and their emission appears spread and smoothed on a large region of the SNR shell. This is also why, although the presence of these H II regions is also evident in spectral index map, the calculation of the related spectral index from the map is difficult.
5 Discussion
Supernova remnants are morphologically complex objects where regions with different phenomena (filaments, halos, atomicmolecular cloud interactions, and PWNe) can coexist. Furthermore, these objects often evolve into very crowded regions that can include star forming regions with related H II regions, other SNRs, and background diffuse emission. A crucial point arising in the study of SNRs is to strictly constrain the remnant morphology and distinguish it from unrelated sources. This work sheds new light on this aspect, as it allows SNRs to be distinguished from other sources (such as H II regions or PWNe) co-spatial or adjacent to the remnant structures. We executed this kind of diagnostic through the complementary use of the morphological details provided by the high-resolution SMGPS images, the spatial distribution of the spectral indices observed in the spectral index maps, and the possibility to distinguish the different spectral contributions on the graphs obtained from the combined inspection of the spectral index and brightness maps.
The combined use of different spectral investigation methods is crucial to studying a wide sample of SNRs in a systematic way, as the spectral characteristics are extremely heterogeneous because they depend on multiple factors (i.e., progenitor, age, environmental conditions, and other sources both interacting or simply superimposed along the line of sight). By studying our sample, we encountered different possibilities to identify unrelated sources, depending on the peculiar SNR characteristics. In the best cases, such as that of G045.7-00.4 and G296.7-0.9, we were able to identify the superimposed H II regions with all three methods. In general, this is possible when the co-spatial H II regions are bright compared to the environmental SNR structures and extended so that their spectral component is well resolved in the spectral index map. Under these conditions, the different sources result in significant peaks in the histogram and in a distinguishable spectral trend in the BB-plot. In these cases, we were able to estimate the spectral indices of the remnant and the H II region by fitting the related spectral components identified in the BB-plot. In cases such as that of G022.7-00.2, the co-spatial H II regions are detected in the SMGPS map, and their contribution is distinguishable in the spectral index map, while the related spectral components are not distinguishable in the graphs. This occurs when the H II regions are small in size and fainter than the remnant structure.
Despite the high resolution of the SMGPS images, other sources overlapping the SNRs are not always detectable, depending on their brightness and the complexity of the remnant structures with which they can be confused. In cases such as G023.3-0.3, G51.26+0.9, and G51.04+0.7, we could not distinguish the co-spatial H II regions from the remnant in the brightness map, but their spectral contribution was evident in the spectral index map as well as in the spectral index histogram and/or in the BB-plot. Finally, for some SNRs (e.g., G046.8-0.3), we identified a co-spatial H II regions only in the spectral index map. In this case, the H II regions are faint and both their morphological and spectral contributions are hidden by those of the remnant.
This kind of study is also useful for identifying different spectral behaviors associated with peculiar regions of the remnant. This is the case for G289.7-0.3, G292.2-0.5, and G337.3+1.0, where different bright regions result from peculiar shock and environmental conditions, implying different spectral trends. In the cases where a region-dependent spectral behavior is observed in the spectral index map but without a clear association with the brightness features or with a spectral difference that is not marked enough, the spectral components are not distinguishable in the graphs, as we observed for G301.4-1.0 and G335.2+00.1..
To evaluate the impact of the new SMGPS and GLEAM flux density measurements on the integrated spectral characterization of known SNRs, we compared the distribution of the integrated spectral indices estimated in this work (αint column in Table B.1) to the distribution obtained from the spectral index values reported in the literature, in reference to the same SNR sample. For the latter, we considered the values provided by Green (2022), with the exceptions of G033.2-0.6, whose spectral index is indicated as “varies” in Green (2022) and for which we considered the integrated spectral index obtained by Dubner et al. (1996); G051.04+0.07, which is not cataloged in Green (2022), so we used the integrated spectral index estimated by Supan et al. (2018); and G351.9+0.1, which is a new SNR candidate and is thus not included in the Green (2022) catalog, so we used the value estimated by Hurley-Walker et al. (2019a). We also excluded from this investigation G286.5-1.2 and G301.4-1.0, for which we have provided the first spectral characterization. The literature spectral indices are reported in the column αlit in Table B.1. The result of this comparison is shown in the Fig. 3. We also produced a scatter plot of the two spectral distributions in order to check for possible systematic effects on our integrated spectral index measurements. The resulting plot (Fig. 4) shows that the points do not follow any specific trend, ruling out a correlation between the published and our spectral indices. While the literature provides spectral indices between −0.5 and −0.6 for a large number of objects, as expected on the basis of the diffusive shock acceleration theory (DSA; Dubner & Giacani 2015), our integrated spectral indices are more evenly distributed, with a flatter peak value centered at approximately −0.35. Our distribution better reflects the heterogeneity of the SNR sample since the new SMGPS and GLEAM flux measurements recover the contribution of the peculiar SNR characteristics well (e.g., environmental conditions, age, morphology). This result also points out that the interaction between the remnant and its surrounding material plays an important role in the SNR spectral behavior, particularly for the objects located in crowded Galactic regions.
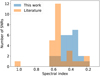 |
Fig. 3 Comparison between the spectral index distribution of our SNR sample from integrated spectral indices estimated in this work (αint in Table B.1) and that obtained by considering the previous integrated spectral index values available in the literature for the same SNRs. |
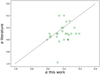 |
Fig. 4 Scatter plot between the SNR spectral indices from this work and those from the literature. The αliterature = αthiswork line is shown for reference. |
6 Summary and conclusion
We have presented the integrated and spatially resolved spectral analysis of 29 known Galactic SNRs by using the data from SMGPS at 1.284 GHz and from GLEAM between 0.088 and 0.200 GHz. The large frequency span between the new SMGPS and MWA allowed us to determine for the first time the integrated spectrum of very poorly studied objects such as G286.5-1.2 and G301.4-1.0, to verify the spectral trend of the SNRs for which only two flux densities were available in the literature (G003.8+0.3, G292.2-0.5, G296.7-0.9, G351.7+0.8, and G351.9+0.1), and to better constrain the integrated spectral index of SNRs whose previous measurements were highly scattered (as in the cases of G023.3-0.3, G046.8-0.3, and G348.7+0.3). For G024.7-00.6 and G291.0-0.1, the high-resolution SMGPS images allowed us to redefine the SNR morphology and better determine their boundaries or reveal new associated regions. In the G024.7-00.6 SMGPS image, we detected an extended bubble of diffuse emission never observed before (Fig. A.6), and we included it in the GLEAM and SMGPS extraction regions used to evaluate the flux densities. In the case of G291.0-0.1, a cloak-like diffuse emission extending north from the main SNR structure is clearly detected in our image (see Fig. A.17) and is probably associated with a breakout portion of G291.0-0.1 that is expanding into a rarefied medium. For each of these sources, we provide the first spectral characterization, both integrated and spatially resolved.
We used the 0.155–1.284 GHz spectral index maps to firmly constrain the remnant structures and their spectral behavior. For G332.4+0.1, we identified the main shell and the blowout region as two different spectral regions. This information, coupled with the morphological details in the SMGPS image and the IR comparison, gave us a hint that the blowout region is a new SNR co-located with G332.4+0.1. Through the spectral index map of G348.7+0.3, we were able to exclude two extended regions from the remnant, which we have demonstrated to be most probably associated with adjacent H II regions.
For several SNRs, we were able to distinguish the spectral contribution of H II regions embedded in the remnant structure as clear thermal features in the spectral index maps. This is the case of SNR G046.8-0.3, where the thermal emission of the radio quiet H II region G046.792-00.264 is clearly revealed (see Fig. A.12). In other cases, we distinguished the SNR spectral component from the H II region ones in the BB-plots, obtaining an estimation of their spectral index. We applied this method to seven SNRs of our sample (G023.3-00.3, G045.7-00.4, G51.21+0.11, G291.0-0.1, G292.2-0.5, G293.8+0.6, and G296.7-0.9), and it provided a better spectral index estimation for these SNRs. This method also allowed us to distinguish other interesting regions of the remnants, for example those associated with PWN (e.g., for G293.8+0.6) or regions where different particle acceleration mechanisms take place (e.g., for G289.7-00.3). We demonstrated that the complementary use of high-resolution brightness images, sensitive spectral index maps, and the different plots obtained from the combined inspection of the spectral index and brightness maps provides a powerful tool to constrain the particle acceleration theories.
For some SNRs located in complex ISM or CSM regions, we performed a preliminary multi-wavelength study by coupling our radio results with IR, molecular, and γ-ray data in order to distinguish between the different phenomenological regions of the remnants. This allowed us to place constrains on the leptonic or hadronic origin of CRs accelerated in the remnant (e.g., in the case of G040.5-0.5) and to redefine the nature of some regions, which we proved not to be associated with the SNR (e.g., in the case of G332.4+0.1).
Finally, we investigated the spectral index distribution of our SNR sample and compared it with the distribution obtained by considering the spectral indices reported in the Green catalog for the same objects (Green 2022). We observed that the distribution from the literature reflects well the spectral trend expected on the basis of the DSA theory, while in our distribution the spectral indices vary within a wider range of values that better recovers the heterogeneity of the sample and reflects the different SNR characteristics (e.g., environmental conditions, age, morphology).
In this work, we have demonstrated the potentiality of the high-resolution SMGPS images and of the sensitive GLEAMSMGPS spectral index maps regarding the characterization of the Galactic SNRs, especially with regard to the investigation of the spectral behavior in the different remnant regions. High-resolution spectral index maps can be used in combination with IR, molecular, and γ-ray images, providing a powerful tool to constrain the particle acceleration mechanisms that result in the SNR regions from peculiar shock conditions and/or ISM interaction. In this context, the possibility to produce higher-quality spectral index maps by exploiting MeerKAT data at other frequencies, for example those that will be obtained in the S-band, will be crucial to reaching a broader understanding of these complex objects.
Data availability
Appendix A, including images, graphs and tables, is published on the Zenodo repository: https://doi.org/10.5281/zenodo.13950279.
Acknowledgements
The MeerKAT telescope is operated by the South African Radio Astronomy Observatory, which is a facility of the National Research Foundation, an agency of the Department of Science and Innovation. The National Radio Astronomy Observatory is a facility of the National Science Foundation operated under cooperative agreement by Associated Universities, Inc. The Centre for Astrophysics Research at the University of Hertfordshire kindly provided access to their HPC facilities for data processing and storage. In this work, we used the data from the FOREST Unbiased Galactic Plane Imaging survey (FUGIN) carried out with the Nobeyama45-m telescope, a legacy project in the Nobeyama 45-m radio telescope. This work was supported in part by the Italian Ministry of Foreign Affairs and International Cooperation, grant number ZA23GR03. C.T. and G.U. acknowledge support from PRIN MUR 2022 (20224MNC5A), “Life, death and after-death of massive stars”, funded by European Union – Next Generation EU.
Appendix A Supplementary images and tables
Supplementary images and tables are stored on the Zenodo repository: https://zenodo.org/records/13950279.
Appendix B Individual target characterization
We compared our results, in terms of morphological details and both integrated and spatially resolved spectral indices, with those available in the literature to highlight new aspects revealed by SKA precursor observations. We studied the integrated spectrum of each SNR (Fig. A.29 – A.33) through a simple power-law fit of our SMGPS and GLEAM flux densities together with the literature ones (Table B.2). Where it has been possible to distinguish more than one spectral component, we also estimated the integrated spectral indices through the RANSAC fit of the BB-plots (Fig. A.34 – A.47). A detailed discussion for each SNR is given below. The references to the (1) SMGPS, GLEAM and spectral index maps, (2) the integrated spectra and (3) the spectral inspection graphs, are indicated at the beginning of each section to facilitate the reading in the consultation of material related to each SNR.
B.0.1 G003.8+0.3
G003.8+0.3 (Fig. A.1, A.29, A34) was proposed as a candidate SNR by Gray (1994) on the basis of MOST observations at 843 MHz and then confirmed as such by the 327-MHz Giant Metrewave Radio Telescope (GMRT) observations (Bhatnagar 2002). The authors presented G003.8+0.3 as an incomplete shell with the bulk of the emission from the northern rim. The absence of the southern part of the shell was tentatively attributed by Bhatnagar (2002) to a coincident deep negative region observed both in the MOST and GMRT images. No other studies of this object are available in the literature either in the radio or in other bands.
The SMGPS image (Fig. A.1 upper-left) confirms the morphology described in the previous studies, but the SNR contours are sharper, also in the southern part, and more details of the northern and western-bright regions are detected. We also observed the south-negative region, which is instead not present in GLEAM image (Fig. A.1 upper-right). This is probably due to the difficulty to clean properly the diffuse emission from the Galactic plane, clearly visible in the GLEAM image.
The G003.8+0.3 integrated spectrum is shown in Fig. A.29. The new and old data are consistent with each other within 2σ, showing an integrated spectral index of −0.39 ± 0.08.
The spectral index map (Fig. A.1, bottom-left) traces the bright northwestern/northeastern shell. The northern-bright arc region, visible in the SMGPS image and corresponding to a just detectable emission bump in the GLEAM map, corresponds to a slightly flatter circular region (α ~ −0.23), while steeper spectral indices are related to the eastern-bright filament (α ~ −0.36).
The histogram in Fig. A.34 is peaked at ~ −0.21, tracing the contribution of the northern bright region. The BB-plot (Fig. A.34) shows a single spectral component with a strong dispersion, which reflects the presence of different spectral components that are confused with each other. Under this condition the RANSAC tool tries to fit these components as if they were a single, providing a meaningless spectral index that does not represent any of them.
B.0.2 G018.8-0.3
In the radio band, the SNR G018.8-0.3 (also known as Kes 67) (Fig. A.2, A.29, A.34) looks like an incomplete shell with an elongated shape parallel to the Galactic plane direction (Castelletti et al. 2021). The brightest regions are located in the northeastern and southern edges. The emission ridges appear sharp and strongly flattened in the eastern and southern parts. Radio studies both in continuum, HI, CO and OH lines highlighted the presence of a MC complex extending along these SNR edges (Dubner et al. 1999). Based on high-resolution CO investigations, Dubner et al. (2004) were able to distinguish two clumps composing the MC and to observe a strong positional matching of the northern one with the shock front position, providing further confirmation of the SNR-MC interaction. In the same region, Paron et al. (2012) detected some YSOs with ages comparable with the SN explosion one, in contrast with the hypothesis of a star formation triggered by the SNR shock. In its northwestern part, the SNR shell is instead less defined, with a diffuse and faint emission. High-resolution 13CO studies showed a low-density ISM environment in this region, which has been interpreted as a blow-out part of the SNR (Tian et al. 2007).
In our SMGPS image (Fig. A.2, upper-left), we clearly detect the asymmetric shell morphology of this SNR: the sharp and flat edges in the southeastern and southwestern direction appear well defined as well as the fainter-diffuse emission in the western shell side. Compared to the highest-resolution image available (FIRST VLA Survey at 1.4 GHz, Dubner 2017), the SMGPS image better resolves the highly filamentary structure of the northern part of the shell and the fainter filaments of the central region. We also can distinguish eight H II regions located at the east (G018.762+00.270, G018.766+00.262, G018.761+00.262, G018.741+00.250, indicated as the group 1 in Fig.B.1) and south SNR edges (G018.594+00.321, G018.632+00.256, G018.630+00.309, G018.584+00.344, indicated as the group 2 in Fig.B.1) and the faint shell of the nearby SNR G019.1+00.2 (indicated with the yellow circle in Fig.B.1). This last feature is also well detected in the 0.155-GHz MWA image (Fig. A.2, upper-right). We note that, both in the SMGPS and in the GLEAM images, we did not detect the faint “plume” observed by Castelletti et al. (2021). This structure could be associated with the arc emission of the SNR G019.1+00.2 affected by artifacts in the Very Large Array Low-Frequency Sky Survey Redux (VLSSr) map (Castelletti et al. 2021, Lane et al. 2014).
We fitted the G018.8+0.3 spectrum (Fig. A.29) by excluding the 31 MHz measurement (Kassim 1988) related to the free-free absorption spectral turnover. We obtained an integrated spectral index of −0.41 ± 0.04, which is consistent with the values obtained by Kovalenko et al. (1994) between 30.9 MHz and 8.4 GHz (α = −0.42 ± 0.11), and by Sun et al. (2011) in the 0.330-8.4 GHz frequency range (α = −0.46 ± 0.02), while it is steeper than the spectral index calculated by Castelletti et al. (2021) by using a power law function with an exponential turnover (α = −0.373 ± 0.010).
As we can see in Fig. A.2 (bottom-left), spectral indices vary in a narrow range of values (~ −0.40 − ~ −0.55). The southeast SNR edge is an exception, where we observed a spectral flattening up to α ~ −0.1 that clearly traces the contribution of the H II regions located in close proximity. An average spectral index of α ~ −0.46 (flatter with respect to the other surrounding SNR regions) seems to be associated with the bright shell in its northeastern part, in agreement with what observed by Castelletti et al. (2021) in their 74 MHz −1.4 GHz spectral index map (covering the only bright shell region of the SNR). A spectral flattening across this region is expected as a result of the interaction of the SNR blast wave and the molecular clump here located. We can identify different spots with steep spectrum across the remnant, seemingly related to the bright SNR filaments, the steepest of which (with an average α value of ~ −0.54) is located to the southwest edge (roughly corresponding with the final part of the SNR shell). Finally, a region with flatter spectral index (~ −0.40) is observed in the western side of the map, stretching toward the southwestern direction and roughly overlapping the fainter SNR region.
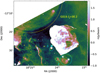 |
Fig. B.1 SMGPS image at 1.284 GHz of G018.8+0.3. We chose the color scale to emphasize the emission from the nearby SNR and H II regions. The cyan circles labeled with the number 1 refer to the H II regions G018.762+00.270, G018.766+00.262, G018.761+00.262, G018.741+00.250, while those tagged with the number 2 indicate the H II regions G018.594+00.321, G018.632+00.256, G018.630+00.309, G018.584+00.344 (Anderson et al. 2014). The SNR G019.1+00.2 is indicated with the yellow circle. |
In the BB-plot shown in (Fig. A.34), we can identify a single spectral component.
B.0.3 G021.8-0.6
G021.8-0.6 (also known as Kes 69) (Fig. A.3, A.29, A.35) is classified as a mixed-morphology (MM) SNR composed of a main incomplete shell, mainly extended along the southwest-northeast direction, with a fainter radio extension in the northeast, and a central thermal X-ray emission (Yusef-Zadeh et al. 2003). A cataloged H II region (G021.884-00.318, Anderson et al. 2014) overlaps the northern SNR region. Mid-infrared and molecular (12CO) emissions were observed well coincident with the southern radio arc, along with HCO+ emission from the radio peak region. Extended OH masers are detected in the southeastern rim of the remnant shell, consistently with the observed molecular emission (Zhou et al. 2009). This multiwavelength picture of the main shell strongly suggests the interaction between the SNR and the MC located in this region. No γ-ray emission was detected from G021.8-0.6 (Sezer et al. 2018). Sezer et al. (2018) attributed the lack of GeV emission, which is generally expected from MM SNRs, to a dominant contribution from X-ray emitting plasma with respect to cosmic rays (CRs) accelerated by the SNR shocks.
In the SMGPS image shown in (Fig. A.3, upper-left), we clearly detect both the southern shell and the northern structure, which extends from the previous one through a faint emission bridge to the east. Our image shows the filamentary structure of the SNR shell with unprecedented detail. This complex structure confirms the scenario of the SNR shock expanding into an inhomogeneous molecular medium with dense and clumpy regions, probably resulting from the stellar wind of the SNR progenitor in the pre-existing interstellar molecular gas (Zhou et al. 2009). The northern region appears as a fairly clean arc structure in its southern side that becomes more complex going northern, showing a clumpy and more diffuse emission. A zoom view of this region is shown in Fig.B.2 (upper panel). Here, we can identify at least three circular structures of ~ 0.9 arcmin in radius and centered at (α, δ) = (18h32m34.51s, -9°57’ 10.6”), (α, δ) = (18h32m2.27s, -9°56’ 42.03”), (α, δ) = (18h32m14.52s, -9°57’ 58.15”). Their location is indicated with the yellow arrows in Fig.B.2. In Fig.B.2 (bottom panel), we compared our image with the 8 μm from GLIMPSE, revealing a spatial coincidence between the radio and infrared emission across all three regions. Based on the size, the circular morphology and the infrared counterpart, we tentatively ascribe these regions to evolved stars. The ring structures appear surrounded by the remnant filament, and future detailed studies (exploiting high-resolution radio and infrared data coupled with molecular investigation) on this region will be crucial to assess their interaction and the possible action of the SNR shock on the stellar evolution.
The H II region G021.884-00.318, identified by Anderson et al. (2014) in coincidence with the northern SNR structure, results indistinguishable from the remnant in this region. However, the IR 8 μm emission seems to embed the northernmost diffuse radio structure, suggesting that this faint region could be related to the H II region.
The integrated spectrum Fig. A.29) shows a low-frequency turnover highlighted by the literature data at 0.0299, 0.0309 and 0.0575 GHz, and ascribable to free-free absorption processes. We have not considered these measurements to model the spectrum. We executed the fit by using both a simple power-law and an exponential cutoff model (gray line in (Fig. A.29). This last is well represented by the function
![Mathematical equation: $\[S(\nu)=K\left(\frac{\nu}{\nu_{0}}\right)^{-\alpha} e^{-\frac{\nu}{\nu_{0}}},\]$](/articles/aa/full_html/2024/12/aa50404-24/aa50404-24-eq1.png) (B.1)
(B.1)
where K is a normalization constant and ν0 is the cutoff frequency. It takes into account the trend suggested by the highest frequency data available in the literature (Langston et al. 2000) as result of the synchrotron energy losses of the emitting electrons. We notice that both SMGPS and GLEAM points are consistent with the trend suggested by the literature measurements, even if these are affected by a significant scatter, in particular at 0.408, 2.7 and 5 GHz. The exponential cutoff model allowed us to calculate, for the first time in G021.8-0.6, a cutoff frequency of 9.56 ± 0.02 GHz. From this, we calculated a maximum electron energy of 14 GeV, by using the equation ![Mathematical equation: $\[E=14.7\left(\frac{\nu_{c} / \mathrm{GHz}}{B / \mu \mathrm{G}}\right)^{\frac{1}{2}} ~\mathrm{GeV}\]$](/articles/aa/full_html/2024/12/aa50404-24/aa50404-24-eq2.png) (Reynolds 2008) and assuming a magnetic field strength of ~ 10 μG, as the compression theory of the ambient magnetic field predicts (Dubner & Giacani 2015). This value is in agreement with the synchrotron break energy of ≳ 10 GeV predicted by leptonic models applied on γ-ray data of other middle-aged SNRs (Ackermann et al. 2013). However, we cannot exclude that magnetic field amplification or compression processes are occurring in this SNR, for which MC association was established on the basis of shock-cloud interaction evidences highlighted by X-ray studies (Bocchino et al. 2012). Radio and γ-ray spectral studies applied on the MM SNR W44, for which an enhanced magnetic field of 1.4 μG in the SNR-MC interaction regions was inferred by Cardillo et al. (2016), revealed a lower value of the maximum electron energy (1.6 GeV), arising from a significant emission contribution from secondary electrons produced by proton interactions in the SNR crushed clouds regions. Unlike this and other similar MM SNR, G021.8-0.6 is the only one not detected in the γ-ray band (both in the GeV and TeV energy range), despite its proven interaction with MCs (Sezer et al. 2018). This makes G021.8-0.6 an intriguing case for the study of accelerated CRs, and other sensitive high-frequency radio measurements (5 − 20 GHz) will be crucial to firmly constrain our model and the maximum particle energy.
(Reynolds 2008) and assuming a magnetic field strength of ~ 10 μG, as the compression theory of the ambient magnetic field predicts (Dubner & Giacani 2015). This value is in agreement with the synchrotron break energy of ≳ 10 GeV predicted by leptonic models applied on γ-ray data of other middle-aged SNRs (Ackermann et al. 2013). However, we cannot exclude that magnetic field amplification or compression processes are occurring in this SNR, for which MC association was established on the basis of shock-cloud interaction evidences highlighted by X-ray studies (Bocchino et al. 2012). Radio and γ-ray spectral studies applied on the MM SNR W44, for which an enhanced magnetic field of 1.4 μG in the SNR-MC interaction regions was inferred by Cardillo et al. (2016), revealed a lower value of the maximum electron energy (1.6 GeV), arising from a significant emission contribution from secondary electrons produced by proton interactions in the SNR crushed clouds regions. Unlike this and other similar MM SNR, G021.8-0.6 is the only one not detected in the γ-ray band (both in the GeV and TeV energy range), despite its proven interaction with MCs (Sezer et al. 2018). This makes G021.8-0.6 an intriguing case for the study of accelerated CRs, and other sensitive high-frequency radio measurements (5 − 20 GHz) will be crucial to firmly constrain our model and the maximum particle energy.
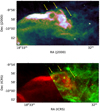 |
Fig. B.2 Detail of the clumpy emission from the northern arc of G035.6-00.4. Upper: Zoomed-in view of the northern portion of G035.6-00.4 as seen with SMGPS at 1.284 GHz. Bottom: Two-color image of the same region obtained from the SMGPS image (red) and the GLIMPSE image at 8 μm (green). In both images, the yellow arrows indicate the location of the circular structures discussed in the text. |
As can be seen in our spectral index map (Fig. A.3), the spectrum of the brightest radio arc of the main shell is flatter than the adjacent fainter and more diffuse emission (α ~ −0.52). We observed a flatter spectrum in the northern arc region than the whole main shell, with a mean spectral index of ~ −0.36. The spectral index map does not provide any spatially resolved information about the H II region G021.884-00.318, and the related spectral component cannot be distinguished on the statistical graphs (Fig. A.35).
B.0.4 G022.7-0.2
The SNR G022.7-0.2 (Fig. A.4, A.29, A.35) appears as a faint radio shell, slightly elongated in the northwest-southeast direction and brighter in its eastern side, where a concave structure is also present (Su et al. 2014). It is located in a crowded Galactic region that includes the nearby SNR G23.3-0.3 (W41) and several H II regions, some of which are superimposed on G022.7-0.2. Infrared studies revealed several 5.8–8 μm filaments well correlated with the radio features (Reach et al. 2006). CO molecular studies highlighted the spatial and kinematic association of G022.7-0.2 with the giant molecular cloud (GMC) G23.0-0.4 located in correspondence of the eastern part of the remnant, providing evidences of SNR–MC interaction (Su et al. 2015). Su et al. (2015) suggested a correlation between the SNR, the GMC and the H II region G022.761-00.492 (cataloged as ‘known’ by Anderson et al. 2014, Lockman 1989). A very high energy (VHE) source (H.E.S.S. J1832-093) is located in the southwestern edge of G022.7-0.2, overlapping the southern part of the GMC G23.0-0.4 (H.E.S.S. Collaboration 2015).
In the SMGPS image (Fig. A.4, upper-left), the four H II regions G022.724-00.010, G022.730-00.239, G022.757-00.246 and G022.780-00.401 (all cataloged as ‘known’ by Anderson et al. 2014, Anderson et al. 2011) overlapping with G022.7-00.2, are resolved (they are indicated with yellow circles in Fig. A.4). They are completely confused with the remnant emission in the literature images, as well as in the GLEAM one (Fig. A.4, upper-right). The SMGPS image well recovers both the eastern bright region and the diffuse emission in the central and norther parts, the latter almost completely absent in the previous images.
We calculated the integrated flux density of G022.7-0.2 both including the H II regions and not, obtaining a value of 49.0 ± 3.9 Jy and 46.6 ± 4.0 Jy, respectively. The H II region contribution is therefore negligible in this case. The integrated spectrum of the SNR G022.7-0.2 is shown in Fig. A.29. It is somehow controversial, considering the discrepancy between the literature measurements and our more recent SMGPS and GLEAM data. The low-frequency flux densities, in particular the point at 57.5 MHz, suggest a spectral turnover associated with the thermal free–free absorption. GLEAM measurements show a flat spectrum and a low flux density compared to the other measurements around the same frequencies. We attributed this disagreement to evident issues in the MWA images probably associated with a difficult background subtraction in this crowed region of the Galactic plane. Taking into account of the unreliability of the GELAM images and flux densities, we excluded MWA points from the fit. We also excluded the 57.5 MHz point in order to ignore the possible low-frequency turnoff. The SMGPS data at 1.284 GHz seems to be consistent with the literature, in particular with the trend suggested by the points at 0.408 and 5.0 GHz (Shaver & Goss 1970). Indeed, we observed that the literature data at 1.414, 2.695 and 5.0 GHz (Altenhoff et al. 1970) have very small uncertainties (around the 1 per cent of the flux), and may be underestimated by considering the epoch of the observations, the map quality and the procedure used to calculate the integrated flux densities (Altenhoff et al. 1970). For this reason, we decided to exclude them from the study of the integrated spectrum. We obtained a spectral index of −0.34 ± 0.07, significantly flatter than the value of −0.6 reported in the Green (2022) catalog. We point out that further sensitive observations in the ~ 0.1 − 5 GHz frequency range are required to firmly constrain the G022.7-0.2 integrated spectrum.
The issues in the background subtraction of the GLEAM maps are also reflected in the G022.7-0.2 spectral index map, which shows an unreliable mean spectral index of 0.06 with a standard deviation of 0.15. For consistency with other SNRs of the sample, we reported anyway in Fig. A.4 (bottom-left) and in Fig. A.35 the spectral index map and the related spectral distribution graphs, respectively.
B.0.5 G023.3-0.3
G023.3-0.3 (also known as W11) (Fig. A.5, A.29, A.36) is an evolved SNR (estimated age of 60 − 200 kyr, Tian et al. 2007) located in a very crowded region, including the nearby SNR G022.7-0.2 (see Sect. B.0.4). In the radio band, it was observed as an asymmetric shell (Kassim 1992). Its boundaries are irregular and several knots of emission are distributed throughout the shell (Castelletti et al. 2021), mostly associated with H II regions overlapping the remnant, while prominent filament structures are observed in the western side of the shell (Tian et al. 2007). Both G023.3-0.3 and the majority of the nearby/overlapping H II regions are thought to be part of the giant MC G23.0-0.4 (Castelletti et al. 2021).
Our SMGPS image (Fig.B.3) revealed the complex morphology of this SNR, including the three clumps associated with the H II regions G023.299-00.281 (classified as ‘candidate’ by Anderson et al. 2014), G023.249-00.312 and G023.240-00.240, classified as ‘known’ by Anderson et al. (2014) and Anderson et al. (2011), and located approximately in the remnant center (indicated in Fig.B.3 with the cyan circles 3, 4 and 6, respectively). Non-thermal X-ray (Tian et al. 2007) and γ-ray emissions (TeV source H.E.S.S. J1834-087) were detected in the same regions, suggesting enhanced π0-decay processes, and resulting hadronic emission, arising from the SNR-GMC interaction (Castro et al. 2013). We detected the two compact H II regions G023.271-00.256 and G023.240-00.114, indicated in Fig.B.3 with the cyan circles number 5 and 10, respectively. The two H II regions G023.455-00.201 and G023.435-00.153 (cataloged as “group” by Anderson et al. 2014) are also distinguishable in the northern SNR rim (they are indicated with the yellow circles 3 and 6 in Fig.B.3). In the same region, we detected the H II region G023.354-00.136 (yellow circle number 8 in Fig.B.3) previously cataloged as “radio quiet” by Anderson et al. (2014). The SMGPS image also shows a detailed view of the filamentary morphology of the western shell boundary and provides the best reconstruction of the very faint and diffuse emission in the eastern SNR side.
Although well resolved, we included the central bulge emission related to the H II regions (cyan circles with indices from 1 to 7 in Fig.B.3) on the SMGPS integrated flux density calculation, for consistency with the previous measurements. The integrated spectrum of the SNR G023.3-0.3 (Fig. A.29) shows a significant scatter between the measurements, which are carried out at very different epoch and with different instruments. The low-frequency turnover indicated by Trushkin (1999) below ~ 0.250 GHz is not confirmed by our GLEAM measurements. We performed a simple power-law fit on the spectrum, by excluding the low-frequency points below the 0.201 GHz and the literature data with very low, and probably underestimated uncertainties at 1.414, 2.695 and 5 GHz (Altenhoff et al. 1970). We obtained an integrated spectral index of −0.24 ± 0.06, where our SMGPS data lies within 3σ from the fit (black line in Fig. A.29). We also ran a simple power-law fit restricted to our SMGPS and GLEAM data to highlight the spectral trend of flux densities calculated with the same method by using most recent and homogeneous data. The resulting fit is indicated with the gray line in Fig. A.29 and shows an integrated spectral index of −0.31 ± 0.03. We point out that the complexity of this SNR requires more sensitive measurements between ~ 0.3 and 5 GHz to correctly investigate its integrated spectrum, also taking into account of the bright H II regions located inside the remnant.
The 0.155-1.284 GHz spectral index map (Fig. A.5, bottom-left) indicates an average spectral index of −0.43 from the brightest filament of the southern side of the shell, which steepens northward corresponding to the western bright filament (α ~ −0.53) and flattens toward its northeastern extremity (up to a minimum averaged value of ~ − 0.42 at the last bright filament). A thermal spectrum (average α ~ 0.21) is detected at the northern SNR edge, coinciding with the brightest northern emission spot. This feature clearly traces the H II regions G023.389-00.148, G023.439-00.187, G023.423-00.216 and G023.438-00.241 (Anderson et al. 2014) located inside this region, which cannot be distinguished from the SNR emission through a visual inspection. The significant flattening toward the central region is also attributable to the H II region contribution.
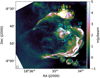 |
Fig. B.3 SMGPS image at 1.284 GHz of the SNR G023.3-00.3. The yellow circles indicate the H II regions G023.438-00.241 (1), G023.423-00.216 (2), G023.455-00.201 (3), G023.439-00.187 (4), G023.458-00.179 (5), G023.435-00.153 (6), G023.389-00.148 (7), G023.354-00.136 (8). The cyan circles indicate the H II regions G023.317-00.300, G023.313-00.289, G023.299-00.281, G023.249-00.312, G023.271-00.256, G023.240-00.240, G023.253-00.240, G023.240-00.114, G023.155-00.321, G023.156-00.264. |
The graphs resulting from the inspection of the brightness and spectral index map (Fig. A.36) allowed us to distinguish the spectral components associated with the G023.3-0.3 and the several H II regions, providing integrated α values of −0.54 and 0.66, respectively. The steeper value of the SNR spectral index with respect to the integrated one is expected as it is not affected by the H II region contribution. This result confirms the potentiality of the BB-plots in estimating the spectral index of SNRs co-located with other sources. Regarding the H II region spectral index, we point out that such a high value at our frequencies is expected for young and dense objects, like compact and ultra-compact (UC) H II regions, which typically present a frequency turnover from the optically thick to the thin regime up to ~ 5 GHz (Yang et al. 2021, Kurtz 2005).
B.0.6 G024.7-0.6
G024.7-0.6 (Fig. A.6, A.29, A.36) is a poorly studied SNR identified in the radio band as an incomplete shell with a bright arc aligned perpendicular to the Galactic plane. In all previous observations, including the most sensitive one carried out with the VLA at 1.47 GHz (Green 2019), only the arc structure was identified, suggesting that the rest of a possible ring structure could have been completely blown out (Dubner et al. 1993). Our SMGPS image (Fig. A.6, upper-left) revealed instead a well-defined bubble emission centered at (α, δ) = (18h38m54.109s, -7°5’ 18.24”) and with radius of ~ 9.4 arcmin. This structure shows the typical shell-type morphology, with filamentary structures aligned in the southwest-northeast direction and coincident in its southwest edge with the known G024.7-0.6 arc. We detected the same bubble structure, although less detailed, in all the four GLEAM bands.
The overlapping region between the bubble and the arc appears a bit complex in the high-resolution SMGPS image, with the filaments of the two regions roughly perpendicular and intertwined with each other. From a morphological point of view, the interpretation of this region is difficult since its characteristics could be attributable to both an interaction region or the connection between parts of the same SNR. The detection of X-ray emission in the overlapping region could provide stronger evidences of interaction, but to date no X-ray observations of this region were performed.
Taking also into account the difficulty of distinguishing the new bubble from the arc structure historically associated with G024.7-0.6 in both SMGPS and GLEAM images, we studied this SNR by considering both the regions. For this reason, the integrated flux densities from the literature are underestimated with respect to our measurements. In Fig. A.29, we show the G024.7-0.6 integrated spectrum and the simple power-law fit performed on the SMGPS and in the GLEAM data. We point out that the SMGPS and GLEAM data are consistent with each other in a wide frequency span, ruling out the low-frequency cutoff due to free-free absorption processes and indicating a flatter spectrum (α = −0.30 ± 0.04, most typically observed in evolved SNRs) than the previous estimations (α = −0.5, Clark et al. 1975, Green 2022).
By analyzing the 0.155-1.284 GHz spectral index map (Fig. A.6), we calculated an average spectral index of ~ −0.31 associated with the brightest region of the main G024.7-00.6 arc, with a significant spectral steepening (averaged α ~ −0.37) in its southeastern extremity, where two faint filaments are resolved in the SMGPS image. The bubble structure has an average spectral index of ~ −0.32, which is consistent with a non-thermal nature. To better assess this point, we compared the SMGPS map with the IR WISE images at 12 μm and 22 μm. No IR emission is observed in correspondence to the bubble region, ruling out a possible H II region association. On the basis of its morphological characteristics, the spectral index value and the lack of IR emission in spatial correspondence, we attribute the bubble emission to a SNR. It would be part of G024.7-0.6, for example a blow-out region that is expanding rapidly in a rarefied medium (as observed in some evolved SNRs like G166.0+4.3 and IC443). Moreover, the bubble could be a separate SNR simply superimposed or interacting with G024.7-0.6. The spectral index map also traces the spectral behavior of the bubble edges, highlighting a flat spectrum (ranging between ~ −0.15 and ~ −0.28) in the shell-arc overlapping region. Detailed spatially resolved spectral index studies performed on the morphologically similar SNR IC443 (Egron et al. 2017, Castelletti et al. 2011) did not show such a spectral feature at the interface between the main shell and the blowout region. This aspect, together with the filamentary configuration of the radio emission observed in the SMGPS map, makes the interpretation of two distinct and interacting SNRs the most likely. Other investigations, in particular X-ray and optical (Hα) studies, will be crucial to investigate the new-identified shell-like structure and clarify its connection with G024.7-00.6.
A single spectral component is identified both in the histogram and the BB-plot (Fig. A.36).
B.0.7 G032.8-0.1
G032.8-0.1 (Fig. A.7, A.30, A.37), better known as Kes 78, is a middle-aged SNR (with estimated age of ~ 6000 yr, Zhou & Chen 2011) evolving in a crowded environmental region. Its radio morphology consists of an elongated shell in the northsouth direction with two bright arcs at its ends, both southeast-northwest oriented.
Spatially resolved X-ray observations revealed the SNR interaction with a large MC along its east side (Miceli et al. 2017). The same MC overlaps with the γ-ray emission from the source HESS J1852-000 (Kosack et al. 2011), suggesting an enhanced CR acceleration in this region. An OH maser was detected along the eastern SNR edge, tracing the interaction between the SNR shock and the nearby MC (Koralesky et al. 1998).
In cases like this, the co-spatial study of the radio, X-ray and γ-ray emission is crucial to disentangle: the particle acceleration mechanisms, including CRs reacceleration and compression mechanisms in crushed SNR regions interacting with MCs; the specific environmental conditions, such as magnetic field amplification; the energetic of both hadronic and leptonic CRs, including secondary electrons produced by hadronic interactions in regions with strong post-shock densities.
The SMGPS image (Fig. A.7, upper-left) provides the higher-resolution view of this SNR, revealing the complex structure of the two main arcs. The northern one presents an inhomogeneous emission consisting of different irregular bumps, while the southern one is mainly composed of two bright spots from which roughly parallel filaments depart. The two bright structures immediately southwest of the northern arc (yellow circles 1 and 2 in Fig. A.7) and the filament located in the western shell (circle 3 in Fig. A.7) are respectively associated with the ‘known’ H II regions G032.823+00.072, G032.835+00.017 and the ‘candidate’ G032.775-00.048 (Anderson et al. 2014, Anderson et al. 2011). We also clearly detect the more compact ‘candidate’ H II region G032.749-00.065 and the ‘known’ G032.761-00.151 (Anderson et al. 2011) (region 4 and 5, respectively in Fig. A.7).
The integrated spectrum (Fig. A.30) shows the agreement of the SMGPS data with the trend suggested by the GLEAM and the literature measurements, although the latter are subject to a significant scatter. We also point out the consistency of our SMGPS point with the THOR+VGPS flux density at 1.4 GHz measured by Dokara et al. (2023). Our spectral index estimation (α = −0.45 ± 0.04) is significantly lower than the value reported by Green (2022) (α = −0.2, indicated as uncertain) and that obtained by Dokara et al. (2023) (−0.27 ± 0.04), but it is consistent with the spectral index of α = −0.5 obtained by Kassim (1992) by excluding the Caswell et al. (1975) data, which are considered by the authors to be unreliable.
Our spectral index map (Fig. A.7, bottom-left) reveals similar spectral indices in the two main arcs, with averaged value of ~ −0.47. The spectral values significantly flatten in correspondence of the west side of the northern arc (~ −0.10), likely due to the contribution of the H II regions G032.823+00.072 and G032.835+00.017. An indication of spectral steepening is observed toward the eastern bridge (reaching a mean value of ~ −0.53 in its southern side), where the interaction between the adjacent MC and the SNR shock is thought to enhance the hadronic emission from the co-spatially γ-ray source HESS J1852-000.
The graphs in Fig. A.37 show a main spectral component, associated with G032.8-00.1, and a second-flatter one likely related to the H II regions contribution. The latter is identifiable in the histogram and in the BB-plot, but in both cases with a certain dispersion probably due to the fact that the H II regions are not very bright and their emission blurring with the SNR one. This makes it difficult to accurately determine the related spectral index.
B.0.8 G033.2-0.6
G033.2-0.6 (Fig.A.8, A.30, A.37) is a poorly studied SNR located in a region with strong diffuse emission. Infrared observations placed this SNR at a distance of 4.9 kpc (Lee et al. 2020). The VHE γ-ray source HESS J1852-000 (H.E.S.S. Collaboration 2011) was detected in the region between G033.2-0.6 and the other SNR G32.8-0.1. 12CO observations highlighted a large MC adjacent to the northern edge of G033.2-0.6 (Sofue et al. 2021). However, detailed studies on G033.2-0.6 have been carried out in the radio band only. In all previous images from the literature, this SNR was observed as an incomplete shell with the bright part orientated along the Galactic plane, suggesting a past blowout of the residual shell. (Dubner et al. 1996). We observed the same morphology in the GLEAM images, at all four frequencies. The high sensitivity of SMGPS image (Fig. A.8, upper-left) allows us to reveal, for the first time, the diffuse emission in the inner part of G033.2-0.6 and the southeastern-fainter rim of the remnant shell.
The integrated spectrum of G033.2-0.6 is shown in Fig. A.30. As pointed out by Trushkin (1999), the literature points (in particular those at 0.0309 and 0.102 GHz) seem to suggest a concave-up spectral curvature. However, our GLEAM measurements does not indicate the same trend at low frequencies, and they are more in agreement with the simple power-law model. We ascribed the slight discrepancy of the SMGPS measurement and the literature data at about the same frequency to having included the southern-diffuse emission on the SMGPS flux density calculation.
Taking into account the concave-up shape of the literature data, Green (2022) indicate the spectral index of G033.2-0.6 as ‘varies’. However, Dubner et al. (1996) obtained a spectral index of −0.63 from a power-law fit of the data between 0.030 and 5 GHz, while in the most recent study, Dokara et al. (2023) obtained α = −0.29 ± 0.05 between 0.2 and 5.8 GHz. We obtained a spectral index of −0.45 ± 0.06 as a result of the fact that: the literature data refer only to the brighter portion of the shell; there is a discrepancy between the GLEAM measurements and the other low frequency literature data.
The 0.155-1.284 GHz spectral index map (Fig. A.8) shows a significant spectral variation across the remnant, even if there is no clear association between spectral and brightness features. The southern rim of the shell is the steeper spectral region, with averaged spectral index of ~ −0.38. The northern region is globally flatter, but with spectral indices ranging from a minimum value of ~ −0.39 to a maximum of ~ −0.19. This radio spectral flattening could be indicative of the interaction between the SNR shock and the adjacent MC, which often results in strong post-shock densities and enhanced magnetic fields. Optical and IR follow-up observations of this region could be useful to trace the SNR-MC interaction.
From the graphs in Fig. A.37, we identify a single spectral component characterized by a fairly high dispersion, indicative of the significant and smooth spectral variation across the remnant.
B.0.9 G035.6-0.4
G035.6-0.4 (Fig. A.9, A.30, A.38) was recently re-identified as SNR by Green (2009) by using the VGPS data at 1.4 GHz and the 10-GHz Nobeyama data. It is a poorly studied SNR. Other radio continuum observations were performed with the GMRT at 0.610 and 1.4 GHz, but flux density was not measured at the latter frequency because the SNR was resolved out (Paredes et al. 2014). Through GLOSTAR observations at 4 − 8 GHz, Dokara et al. (2023) detected linearly polarized emission from G035.6-0.4 and hinted at a break in its integrated spectrum between 200 MHz and 1.4 GHz.
With an estimated age of ~ 2300 yr (Zhu et al. 2013), G035.6-0.4 is located in a region rich of diffuse Galactic emission. It shows a shell morphology elongated in the northwest-southeast direction. The SMGPS map of G035.6-0.4 (Fig. A.9, upper-left) well reproduce the remnant morphology, consistently with the recent GLOSTAR image (Dokara et al. 2023). However, the remnant contours are better defined in our image, and the diffuse “plume” structure in the northwestern edge is more defined. We also detected the small-circular H II region G035.576-00.586 (identified as radio quiet by Anderson et al. 2014) in the southeastern corner of the remnant. It was also revealed in the GMRT (Paredes et al. 2014) and GLOSTAR image (Dokara et al. 2023), while it was considered part of G035.6-0.4 in the VLA maps (Green 2009).
The γ-ray source HESS J1858+020 was detected roughly centered in the H II region position, but including also part of the southern portion of the SNR (Paron & Giacani 2010). Another H II region, catalogued by Lockman (1989) and morphologically confirmed by Paredes et al. (2014) through 610 MHz GMRT studies, is located in southwestern SNR corner, corresponding with the brightest radio region. However, its structure is difficult to distinguish from the remnant features in the SMGPS map. G035.6-0.4 also results in positional and kinematic overlap with an extended MC, for which the interaction with the SNR shock is suggested (Paron & Giacani 2010). The southern clump of this cloud is coincident with HESS J1858+020, suggesting a γ-ray hadronic emission enhanced by the interaction between CRs accelerated in the SNR and those present in the cloud. The co-spatial presence of six YSO candidates makes this region a probable active star formation site (Paron & Giacani 2010). Finally, two known pulsar are located inside the remnant without confirmed association: PSR J1857+0210 and PSR J1857+0212. The latter is detected in our SMGPS image. We summarized this intriguing picture in Fig.B.4, where the 1.284 GHz SMGPS image is overlaid with the location of the two H II regions (blue circles), the HESS J1858+020 position (red circle), the region associated with the 13 CO clump reported by Paron & Giacani (2010) (green contours) and the location of the two pulsars (yellow crosses).
The integrated spectrum of G035.6-0.4 is shown in Fig. A.30. We excluded from the fit the GMRT flux density at 0.610 GHz by Paredes et al. (2014) because of its value oddly lower than expected at this frequency and probably mistakenly reported (see Table B.1) We obtained a flatter spectral index (α = −0.20 ± 0.03) than the literature one (−0.47 ± 0.07, Green 2009) calculated between 1.4 and 10 GHz, but consistent with the more recent estimation of Dokara et al. (2023) (α −0.28 ± 0.03, from the TT-plot fit). Our integrated spectrum does not confirm the break in the 0.2 − 1.4 GHz frequency range (Dokara et al. 2023), but the GLEAM data suggest a turnover below ~ 0.1 GHz, probably associated with the thermal free–free absorption.
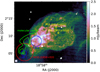 |
Fig. B.4 SMGPS image at 1.284 GHz of the SNR G035.6-0.4. Blue circles indicate the H II region G035.576-00.586 (H II 1) and the H II region cataloged by Lockman (1989) (H II 2). The yellow crosses indicate the pulsar positions. Green contours trace the 13 CO emission integrated in the 51 − 59 km s−1 velocity range at 1.43 and 2.7 K km s−1. The red circle indicates the location of the γ ray source HESS J1858+020. |
The 0.155-1.284 GHz spectral index map (Fig. A.9 upper-left) shows strong spectral index variations across the remnant. Very flat spectral indices (α ~ −0.05 − −0.15) correspond with the southeastern bright region. This spectral feature is in perfect positional coincidence with the Lockman (1989) H II region. The remaining northwestern part of the remnant shows overall steeper spectral indices ranging from −0.22 in the inner part to −0.28 in the outer regions. An exception to this trend is represented by a flatter spot located southwest of the center, with α = −0.17. It does not seem associated with any particular morphological structure in the SMGPS map, but it interestingly lies right next to the PSR J1857+0210. We also noticed a correspondence between the flat spectrum spot and the western extension of the 4σ HESS J1858+020 significance contour as shown by Paredes et al. (2014). In Fig. B.5, we showed the SMGPS-GLEAM spectral index map overlaid on the significance contours of HESS J1858+02 and with the location of the pulsars PSR J1857+0210 and PSR J1857+0212. The positional coincidence with both PSR J1857+0210 and the γ-ray feature makes us suppose that the spectral flattening of this region would trace the emission contribution from an associated PWN, whose presence is morphologically not evident in the brightness maps. We note that no polarization emission was observed in this region (Dokara et al. 2023) as in general expected for the PWNe. However, in some cases the polarized radio emission is not detected as result of different conditions (Mitchell & Gelfand 2022). Moreover, taking into account the low-significance of the γ-ray feature in the H.E.S.S. contour level, this statement shall be confirmed through both higher resolution radio and γ-ray followups.
The H II region contribution, whose flattening is quite evident in the spectral index map, is not highlighted in the BB-plot (Fig. A.38), which shows a single spectral component, even if with a high dispersion. The SNR and H II region contributions are instead distinguishable in the spectral index histogram, with their respective peaks at ~ −0.3 and ~ −0.1.
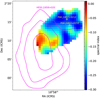 |
Fig. B.5 Spectral index map at 0.155-1.284 GHz of the SNR G035.6-00.4. The magenta contours trace the HESS J1858+020 source at 4, 5 and 6 σ significance levels (HESS Galactic plane survey data as reduced and analyzed by Aharonian et al. 2008). The yellow crosses indicate the pulsar locations. |
B.0.10 G040.5-0.5
G040.5-0.5 (Fig. A.10, A.30, A.38) is cataloged as a middleaged SNR with estimated age and distance respectively of 20 − 40 kyr (Downes et al. 1980) and 8.7 kpc (Duvidovich et al. 2020). The highest resolution image (51.1 × 39.5 arcsec2) available in the literature was carried out with the VLA at 1.5 GHz, revealing the shell morphology of the remnant: a bright and well-defined edge in the northeast direction, and a fainter and diffuse emission in its southwest portion (Duvidovich et al. 2020). Our very high resolution SMGPS image (Fig. A.10 upper-left) confirms this morphology and also reveals the filamentary structures that branch out from the bulk emission to the central region. The known pulsar PSR J1907+0631 lies nearby the remnant geometrical center, likely associated with G040.5-0.5 (Lyne et al. 2017). As the previous radio images, the SMGPS map does not reveal any PWN associated with this pulsar.
The VHE γ-ray source VER J1907+062 was observed with different instruments (Milagro, Abdo et al. 2007; H.E.S.S, Aharonian et al. 2009; VERITAS, Aliu et al. 2014), extending toward the southern part of G40.5-0.5. The VER J1907+062 emission also overlaps the PSR J1907+0602, a γ-ray pulsar with a probably associated compact PWN that could be responsible for the southern γ-ray peak emission through the leptonic mechanism (Duvidovich et al. 2020). However, the northern portion of VER J1907+062 would seem more likely associated with G40.5-0.5, which could contribute to the γ-ray emission through hadronic mechanism enhanced by the SNR-MC interaction. The VER J1907+062 nature is still debated. Two main scenarios were proposed: the superposition of two γ-ray sources produced from leptonic and hadronic mechanisms respectively or a single source powered at the same time by the pulsar and the SNR (Duvidovich et al. 2020).
The integrated spectrum of G40.5-0.5 is shown in Fig. A.30, where we also included the flux densities at 0.750 and 1.4 GHz from Pauliny-Toth et al. (1966) reported by Downes et al. (1980) with correction for the Baars flux scale, and the high frequency measurement (8.35 GHz) by Langston et al. (2000). This latter shows indications of a slight spectral steepening toward high frequencies. For this reason, we applied to the spectrum both a simple power-law and a power-law with exponential cutoff fit models. Either way, we excluded the three lowest frequency points that, as indicated by Trushkin (1999), suggest a thermal free-free turnoff. We also noted that the measurements at 0.083 and 0.111 GHz (Kovalenko et al. 1994) result significantly over-estimated with respect to the GLEAM flux densities, which are more compatible with the other high-frequency measurements and do not show a low-frequency turnover. We also excluded from the simple power-law fit the 8.35 GHz measurement, by obtaining a spectral index of −0.26 ± 0.03, significantly flatter than the previous value reported in the literature of −0.41 ± 0.08 (Sun et al. 2011). From the exponential cutoff fit, we obtained a spectral index of −0.266 ± 0.003 and a frequency cutoff at 42.12 ± 3.87 GHz.
In our 0.155-1.284 GHz spectral index map (Fig. A.10), we identified a relatively steep spectral region ranging from α ~ −0.54 to α ~ −0.29, corresponding to the north-northwestern bright edge of G040.5-00.5. Flatter spectral indices, with an average value of ~ −0.16, characterize the fainter and diffuse inner part of the remnant. We investigated the possible shock/cloud interaction in this spectral flatter region by cospatial comparison between the SMGPS image at 1.284 GHz and the related spectral index map; the 12CO emission (J = 1 − 0) integrated over a velocity range of −100 − 200 km s−1 from the FOREST Unbiased Galactic Plane Imaging2 (FUGIN) survey based on observations at the Nobeyama Radio Observatory (NRO); and the TeV γ-ray emission detected with VERITAS (Aliu et al. 2014). The resulting image is shown in Fig. B.6, where our radio spectral index map is plotted together with 12CO (blue lines) and the TeV emission contours (yellow lines). As already highlighted in previous studies (Aliu et al. 2014, Duvidovich et al. 2020), we also noticed a spatial correspondence between some feature of the G40.5-0.5 radio emission (mainly located in the southern, southeastern and southwestern edges), the MCs traced by the 12CO emission and the γ-ray source. Duvidovich et al. (2020) also calculated a kinematic distance of the 12CO emission ranging from 3.7 and 8.7 kpc, which results compatible within the errors with the distance of 5.5 − 8.5 kpc estimated for G40.5-0.5 by Downes et al. (1980) on the basis of the Σ − D relation. On this base, Duvidovich et al. (2020) suggested the presence of a γ-ray source of hadronic origin produced by the SNR-MC interaction. This scenario has been observed in evolved SNRs like W44, where the γ-ray emission is produced by π0 decay as result of an enhanced proton-proton interaction at the SNR shock front that is expanding in a molecular environment. In these cases, spatially resolved radio studies showed a correlation between the γ-ray emission and radio bright flat-spectrum SNR regions, suggesting an enhanced CR acceleration both of hadronic and leptonic origin (Egron et al. 2017). Our SMGPS radio image and spectral index map of G40.5-0.5 confirm a spatial correspondence between the γ-ray/12CO emissions and the radio regions with flatter spectral indices. The fact that, unlike other SNR, these γ-ray/radio flat regions do not correspond to the brighter radio features of the remnant is peculiar, and could be compatible with a dominant hadronic emission at high energies. In this framework, our radio investigation would support the scenario suggested by Duvidovich et al. (2020) and Li et al. (2021), according to which VER J1907+062 consists of two γ-ray sources: one of hadronic origin related to the G40.5-0.5-MC interaction and explaining the GeV spectrum below 10 GeV; a second one of leptonic origin associated with the pulsar PSR J1907+0602 observed in the southern part of the γ-ray emission (not visible in our map in Fig. B.6).
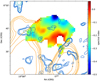 |
Fig. B.6 Spectral index map of G040.5-0.5 in the 0.155-1.284 GHz frequency range from SMGPS and GLEAM images with superposed contour levels of the 12 CO (blue lines) and TeV emission from VERITAS (yellow lines). The 12CO emission is integrated on the −100 − 200 km s−1 velocity interval and the contours correspond to the temperature levels at 4.6, 5.06, 5.52, 6.9, 9.2, 13.8 K. The TeV contours correspond to the significance levels at 3.65, 3.74, 3.83, 4.02, 4.38, 5.48. |
The spectral index inspection graphs (Fig. A.38) cannot distinguish the different spectral components, which result in a slight dispersion of the BB-plot points.
B.0.11 G045.7-0.4
Very few information are available in the literature on the SNR G045.7-0.4 (Fig. A.11, A.30, A.39). Its only radio image is reported by Fuerst et al. (1987) based on Effelsberg observations at 4.75 GHz. The authors defined G045.7-0.4 as a shell-type SNR with a bright emission from the southeastern edge and a very poorly defined northwestern rim that makes it difficult to establish the actual size of the object.
Our SMGPS image at 1.284 GHz allows us to take a significant step forward on the morphological characterization of this SNR. In Fig. A.11 (upper-left), we can appreciate the elongated shell structure toward the northeast-southwest direction with the bulk radio emission coming from the northeastern half shell, which shows very sharp edges. We also can clearly distinguish from the remnant the two extended H II regions G045.838-00.296 and G045.825-00.291 (Anderson et al. 2014), located near the northern rim of this brightest half shell, and that we excluded from the extraction region used for the flux density measurement of G045.7-00.4. The fainter southwestern shell is also well detected and still well distinguishable from the background. It shows an extremely filamentary structure, in turn mainly oriented in the northwest-southeast direction, and ending in the northern part with a filled-bright circular structure ((α, δ) = (19h15m51.464s, +11°13’ 16.35”); radius ~ 2 arcmin).
In Fig. A.30, we show the integrated spectrum of G045.7-0.4. Our SMGPS measurement at 1.284 GHz follows the trend suggested by the higher-frequency literature data, although the latter show a significant scatter. We also noted that the low-frequency turnover suggested in previous studies by the points at 0.102, 0.327 and 0.960 GHz (Trushkin 1999) is not confirmed by the new MWA data. For this reason, we did not include these literature data in the spectral modeling.
The 0.155 − 1.284 GHz spectral index map (Fig. A.11, bottom-left) reveals a different spectral behavior between the two half shells: the brightest one shows a flatter spectrum (with a mean value of ~ −0.34); the fainter southwestern one presents steeper spectral indices, with values up to ~ −0.7, except in the region corresponding to the northern circular feature, where the spectrum turns back very flat (α ~ −0.1) with smooth radial steepening. The spectral trend of this latter region and its radio morphology could be attributed two scenarios: a possible association with a PWN; the superposition of the remnant with an H II region, even if there are no cataloged H II regions in spatial correspondence (Anderson et al. 2014).
To disentangle the two possibilities, we compared the radio emission of this region with the public 8 μm Spitzer/GLIMPSE data6. The latter seem to suggest an excess of emission surrounding the northern circular radio source, as expected from PAHs and hot dust in typically observed in the H II regions. This would therefore appear to be the most plausible hypothesis, even if the mid-infrared emission is faint and not completely exhaustive. Future radio (including recombination lines) and infrared followups could be useful to better assess the nature of this region.
The different spectral trend of the two half shells could be instead associated with peculiar environmental condition. The bright/flattest spectrum region could result from strong post-shock densities and enhanced magnetic fields. While the faint/steeper spectrum shell could be a filamentary halo region resulting from the expansion of the SNR into a rarefied medium.
Through both the histogram and the BB-plot shown in Fig. A.39, we can clearly distinguish and measure the spectral contribution of the two H II regions (α = 0.95) and that of the SNR (α = −0.27). A spectral index of 0.95 up to 1.284 GHz would be indicative of young and dense H II regions, as those belonging to the compact and UC H II region categories (Yang et al. 2021, Kurtz 2005).
B.0.12 G046.8-0.3
G046.8-0.3 (Fig. A.12, A.30, A.39), also known as HC30, is a typical shell SNR with a radio emission almost perfectly circular. The bulk of the radio emission is located in the north-northwest and south-southeast external arcs, giving rise to a bipolar symmetry. The filamentary structure of these regions was detected with the VLA image at 1.4 GHz (Dubner et al. 1996) and it is definitely resolved in our SMGPS image (Fig. A.12, upper-left).
The radio spectrum of G046.8-0.3 is well covered between 0.031 and 11.2 GHz, even if the most recent literature data dates back to 1996. It is shown in Fig. A.30, including our SMGPS and GLEAM measurements. A significant spread across the measurements is probably due to the different instruments and epochs of data acquisition (see Table B.2). However, the SMGPS point does not indicate significant variations from the trend suggested by the literature data. Also the MWA data are roughly consistent with the literature ones, although all four points seem to indicate an underlying trend. We modeled the spectrum with a simple power-law function, by excluding the measurements at 0.0309, 0.038 and 0.080 GHz that are associated with a free-free absorption turnover. We note that there is no indication for a high-frequency spectral steepening possibly associated with an energy decrease of the emitting electrons. This could indicate that the particle acceleration mechanisms are still very efficient, as expected for young SNRs (Urošević 2014).
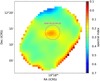 |
Fig. B.7 Spectral index map of the SNR G046.8-0.3 in the 0.155 − 1.284 GHz frequency range with the overlapping region reported by Anderson et al. (2014) for the H II region G046.792-00.264. |
The 0.155 − 1.284 GHz spectral index map of G046.8-0.3 (Fig. A.12 bottom-left) is not resolved enough to trace the spectral behavior of the filaments, but it preserves the bipolar configuration observed in the total intensity map. We observed steep spectral indices (around ~ −0.43) corresponding to the bright-cup regions and flat values (~ −0.27) in the faint-central region. This behavior is in contrast to what observed for some young SNRs with similar bipolar radio configuration, where the bright caps have flat spectrum, while a spectral steepening is observed toward the fainter region as a consequence of a strong and a weak magnetic field amplification, respectively. To investigate the origin of the central spectral-flat spot, we check on the H II region catalog provided by Anderson et al. (2014) for a possible contamination. We found an impressive spatial correspondence between this region in the spectral index map and the H II region G046.792-00.264, cataloged as radio quiet. From this, we infer that the quite strange spectral variation between the radio faint central region and the bright caps is due to the significant contribution of this H II region. Our spectral index map provides evidence that G046.792-00.264 is not radio quiet, despite it is not detectable in the brightness images, probably since it is not bright enough to clearly distinguish it from the SNR.
The spectral inspection graphs shown in Fig. A.39 highlight a single spectral component with α = −0.34. The H II region contribution is too smooth to be clearly revealed.
B.0.13 G51.26+0.09 and G51.04+0.07
G51.26+0.09 and G51.04+0.07 (Fig. A.13, A.31, A.40) were classified as a single new SNR candidate (G51.21+0.11) with uncertain morphological structure by Anderson et al. (2017) based on the combination of 1 − 2 GHz continuum data from the THOR survey, VGPS data at 1.4 GHz and mid-IR data (Spitzer GLIMPSE, Spitzer MIPSGAL, and WISE). Two subsequent studies (Dokara et al. 2018, Supan et al. 2018) confirmed this region as a complex of two SNRs: a shell-type SNR (G51.26+0.09) of radius ~ 11.3 arcmin located at (α, δ) = (19h25m23.575s, +16°18’ 15.44”); a compact SNR G51.04+0.07 (~ 7.5 arcmin × 3 arcmin) centered at (α, δ) = (19h25m06.293s, +16°05’ 29.92”). The study of these SNRs is further complicated by the H II regions C 51.36 − 0.00 and C 51.06 + 0.16 (Anderson & Bania 2009) located in the same complex.
Our SMGPS map provides the best image of the G51.21+0.11 complex ever obtained so far in terms of resolution and sensitivity (Fig. B.8, upper-left). Compared to the previous G51.26+0.09 maps carried out with the combination of THOR and NVSS data at 1.4 GHz (Dokara et al. 2018, Fig.1d) and the TIFR GMRT Sky Survey (TGSS) data at 150 MHz (Dokara et al. 2018, Fig1.b), the SMGPS image allows us to better identify the remnant edges, and to clearly detect: the shell structure in the south-southeastern rims; the filamentary-central morphology; the bright-filamentary structure in the northwestern edge. The same qualitative differences can be appreciated for G51.04+0.07, for which the east-west elongated morphology with double spur is well detected, together with the internal bright filaments.
The 0.155-1.284 GHz spectral index map (Fig. A.13) highlights the co-spatial SNR/H II region presence: positive spectral indices trace the H II region C51.06+0.6 located in the western spur of G51.04+0.07, while the rest of the remnant shows an average value of α ~ −0.46, consistently with what is expected for a typical shell SNR; the H II region C 51.36 − 0.00 is detected as a large region with positive spectral indices (with mean value of ~ 0.3) located within the brighter part of the G51.26+0.09 eastern shell.
Given the complexity of the region, where SNRs and H II regions overlap blending into each other, we used our spectral index map to define the non-thermal regions almost definitely attributable to the SNRs. We selected in the spectral index map the contour level related to a maximum spectral index of −0.2 (with a maximum error of 0.2), which traces a large region associated with G51.04+0.07 and another smaller region located in the northern border of G51.26+0.09 (red contours in Fig. B.8).
In this way, we were able to redefine the extension of the non-thermal emission from G51.26+0.09, which results significantly larger than those inferred by Supan et al. (2018) on the basis of VLSSr data (Lane et al. 2014). The related regions are compared in Fig. B.8 through red and blue contours, respectively. Our G51.04+0.07 region appears as an elongated structure with major and minor axes of 9.4 arcmin and 4.8 arcmin, almost double in size than the structure observed by Supan et al. (2018). We used this region as extraction region to calculate the integrated flux density both in the SMGPS and GLEAM images and investigate the spectral behavior of G51.04+0.07. We obtained an integrated spectrum (Fig. A.31) with α = −0.33 ± 0.01, significantly flatter than that obtained by Supan et al. (2018) in the 0.074 − 4.85 GHz frequency range (α = −0.52 ± 0.05). Although the spectrum shows the consistency between the SMGPS and in the GLEAM data, we point out that the low resolution of the MWA images (in particular at 0.088 and 0.119 GHz) makes the flux measurements from this small extraction region little meaningful. Higher resolution radio images in a wide frequency range will be needed to better constrain the spectrum of this SNR.
In the case of G51.26+0.09, we considered the non-thermal region (red contour in Fig. B.8) too small to attempt a spectral characterization of the remnant, but we could draw some qualitative conclusions from the spectral index map. By excluding the positive spectral region associated with the H II region, the bright shell presents negative and quite flat spectral values with a mean spectral index of −0.25, consistently with that expected for bright SNR regions in strong particle acceleration conditions. In the inner part of G51.26+0.09, the spectral index map revealed a roughly filamentary structure with alternating flat spectral regions with α ~ −0.07, and positive spectral regions with α ranging from ~ 0.1 to ~ 0.2.
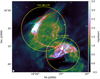 |
Fig. B.8 SMGPS image of the G51.21+0.11 complex at 1.284 GHz. The yellow and cyan circles indicate the SNR and H II region locations, respectively. The red contours show to the regions with a maximum spectral index of −0.2, referring to our 0.155-1.284 GHz spectral index map. The blue contours indicate the non-thermal emission region as obtained by Supan et al. (2018) from VLSSr at 74 MHz (Lane et al. 2014). |
In the BB-plot produced by considering the entire G51.21+0.11 complex (Fig. A.40), the SNR and H II region contributions are also distinguishable with spectral indices of −0.34 and 0.75, respectively.
B.0.14 G286.5-01.2
G286.5-01.2 (Fig.A.14, A.31, A.40) was identified as a SNR by Whiteoak & Green (1996) through MOST observations at 0.843 GHz. They described this object as a double parallel filament structure toward northwest. The westernmost one is brighter and presents a central kink. After this study, no radio observations have been made on this object until now, and the MOST is the only radio flux density measurement available in the literature. From optical observations, a radio and H α coincidence was revealed (Stupar & Parker 2011).
In our SMGPS image, shown in Fig. A.14, we can clearly distinguish the two filaments and the northern extension that appears morphologically associated with the remnant. The two bright clumps detected in the southern edge of the SNR filaments are related to three ‘known’ H II regions (G286.391-01.351, G286.412-01.468 and G286.439-01.496, Anderson et al. 2014, Caswell & Haynes 1987).
We coupled our SMGPS and GLEAM flux densities with the literature MOST measurement, obtaining the spectrum shown in Fig. A.31. By modeling it with a simple synchrotron power-law model, we obtained a spectral index of −0.60 ± 0.02, providing the first integrated spectrum characterization of this object. The SMGPS and GLEAM data show a good agreement and also the MOST point is consistent within 1σ with the fit.
We performed a spatially resolved spectral investigation of G286.5-01.2 by using the 0.155 − 1.284 GHz spectral index map shown in Fig. A.14 (bottom-left). Here, we can clearly distinguish the H II regions characterized by positive spectral indices.
We observed a correlation among bright/flat-spectrum and fainter/steep-spectrum radio regions. In particular a mean spectral index of ~ −0.75 is related to the southern-faint region between the two filaments, while the brighter regions of the filaments reach spectral index values around −0.55 − −0.45. This behavior could traces an enhanced particle acceleration mechanism associated with the SNR shock interaction with interstellar gas at a higher density. This hypothesis could be supported by the Hα emission observed in morphological and positional coincidence with the SNR shock (Stupar & Parker 2011).
The histogram (obtained by considering only the filaments associated with the SNR and by excluding the southern region contaminated by the H II regions) reveled two main components (Fig. A.40): a steeper one (α ~ −0.55) related to the SNR bright filaments and a flatter one (α ~ 0.2) corresponding to the plume of diffuse emission just north of the filaments. These components are indistinguishable in the BB-plot, indicating that the spectral variation fades gradually between the two regions. No H II regions have been identified in this region that could explain the diffuse-spectral flat emission here observed.
B.0.15 G289.7-00.3
G289.7-00.3 (Fig. A.15, A.31, A.41) is a shell-type SNR studied so far only by Whiteoak & Green (1996) through MOST observations at 0.843 GHz. The related image revealed a very interesting morphology with a defined almost circular shell and a filamentary interior structure with a bright compact source near the remnant center. Studies in other bands are not reported in the literature.
The filamentary structures detected in the MOST image are well resolved in our SMGPS image (Fig. A.15), where we can clearly distinguish the two brightest arcs departing from the eastern part of the shell. A central, roughly circular structure is also revealed, from which at least other seven thinner and weaker filaments radiate toward the shell. The almost central bright source observed with MOST is resolved in our image, revealing a typical radio galaxy morphology. The interesting environment in which G289.7-00.3 is enclosed is also highlighted in this image as a nearly complete concentric shell of about 17 arcmin in radius and with some filamentary structures in its northeastern side. The presence of such a structure was inferred by Whiteoak & Green (1996) as the possible fossil shell remnant of the Wolf-Rayet star WR 35b (α, δ) (11h01m02.3s, -60°14’ 01”) on the basis of a very faint structure observed with difficulty in the MOST image. Our high-resolution image supports this scenario.
Our SMGPS and GLEAM flux density measurements allowed us to constrain the integrated spectrum of G289.7-00.3 (shown in Fig. A.31), highlighting the lack of reliability of the literature data at 4.5 and 8.55 GHz. Indeed, we obtained an integrated spectral index of −0.38 ± 0.04, significantly steeper than the literature value of ~ 0.2 ± 0.2 (Whiteoak & Green 1996), indicated by Green (2022) as an uncertain value.
The 0.155 − 1.284 GHz spectral index map of G289.7-00.3 is shown in Fig. A.15, revealing significant spectral variation across the central part of the remnant. First of all, we can notice that the bright and roughly central source presents a mean spectral index of ~ −0.6, significantly steeper than the mean spectral index of −0.52 ± 0.07 of the whole spectral index map (obtained by considering only the values with uncertainties less than 0.2). This definitely confirm the extragalactic nature of this object. We also observed that the three bright central spots of the remnant have a different spectral behavior. The largest two present a mean spectral index in the −0.57 − −0.54 range, while the smaller-western one has a mean value of −0.46. This spectral flattening could be associated with a shock compression region of the remnant filament with a consequent enhancement of the particle acceleration mechanism. Another hypothesis could be related to the contribution of a PWN, although no morphological insights were revealed in the high-resolution SMGPS image. A spectral flattening is observed at the eastern corner of the shell (averaged α ~ −0.44) and at the northwest/southwest shell edges (averaged α ~ −0.35), probably tracing strong shocks interacting with high-density molecular regions. In order to investigate this possibility, we compared our spectral index map with the emission from HI molecular clouds traced in the SGPS (McClure-Griffiths et al. 2005). The HI emission is indicated with magenta contours in Fig. B.9 overlapped with the G289.7-00.3 spectral index map. We observed the presence of a large HI cloud embracing the entire south SNR edge. This superimposition is especially marked in the southwestern corner, where the spectral flat values could be attributed to a possible MC-SNR interaction. We point out that further studies on the distance of G289.7-0.3 and the HI cloud will be crucial to confirm their interaction.
We studied the spatial distribution of the spectral indices across the remnant through the graphs shown in Fig. A.41. The histogram shows two peaks roughly of the same amplitude, indicating two spectral components with α ~ −0.52 and α ~ −0.42. The fact that their contribution is comparable suggests the presence of bright regions that behave differently as subject to different shock and environmental conditions. The two component are also visible in the BB-plot, although they cannot separately evaluated as very close each other, resulting in a slight dispersion of points.
B.0.16 G290.1-0.8
G290.1-0.8 (Fig. A.16, A.31, A.41) is a mixed-morphology SNR with a radio emission fairly distributed between a not well-defined shell and a filamentary central structure (Whiteoak & Green 1996). The brightest region is the arc located in the southwestern edge of the shell, while two ear-like protrusions of diffuse emission extend in the northwest and southeast direction (Auchettl et al. 2015). As optical studies revealed, this sharp and bright arc results from a SNR-MC interaction in the G290.1-0.8 southwestern rim (Filipovic et al. 2005). G290.1-0.8 was also observed with Fermi-LAT, revealing significant γ-ray emission coincident with southwestern arc and the interacting MC.
The SMGPS image well recover both the network of filaments spanning over the whole remnant and the diffuse emission of the two ear-like extension (Fig. A.16, upper-left). The high-resolution of the SMGPS image allowed us to distinguish the H II region G290.215-00.814 cataloged as radio quiet by Anderson et al. (2014). It is indicated with a yellow circle in Fig. A.16 (upper-left). Its contribution is also revealed in the spectral index map (Fig. A.16 bottom-left), where a spectral index flattening is evident in the southeastern border (α ~ −0.1). We also were able to detect the PWN associated with a highvelocity pulsar and located ~ 11 arcmin southwest of the parent SNR G290.1-0.8. As highlighted in Fig. B.10, the PWN morphology observed in the SMGPS map agrees with the one shown in the previous radio images (ATCA at 2 GHz, Pavan et al. 2014, the related emission region is indicated with the red ellipse in Fig. B.10). However, our image shows a larger emission along the system direction of motion, revealing a diffuse emission undetected before that extends the cometary tail by ~ 2.2 arcmin. We also observed a faint emission prominence at the position of the parent pulsar detected in the X-ray (indicated by the yellow cross in Fig. B.10).
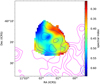 |
Fig. B.9 Spectral index map at 0.155-1.284 GHz of the SNR G289.7-0.3. Blue contours indicate the intensity levels at 0.12, 0.17, and 0.27 Jy beam−1 calculated on the SMGPS map convoluted and regridded to the MWA beam and pixel size. Magenta contours are associated with the HI emission detected in the SGPS data at 9607.85, 9838.77, 10011.23, and 10213.95 K. |
The G290.1-0.8 integrated spectrum is shown in Fig. A.31. The GLEAM data does not confirm the turnovers at low frequencies suggested by the literature data below ~ 100 MHz. We excluded these measurements (at 0.0299 and 0.085 GHz) from our power-law fit, from which we obtained a spectral index of −0.42 ± 0.04. This value is compatible with that obtained by Milne et al. (1989) (−0.43 ± 0.8) and slightly steeper than the more recent measurement obtained by Filipovic et al. (2005) (−0.33 ± 0.065).
The spectral index map shown in Fig. A.16 (bottom-left) revealed a fairly uniform spectral index distribution across remnant, with α ranging from ~ −0.53 to ~ −0.48, with the exception of the ear-like extensions where the spectrum flattens up to ~ −0.25. We attributed this spectral trend to the contribution of several H II regions located close to these regions.
The spectral inspection graphs (Fig. A.41) reflect the small variation of the spectral values across the remnant, showing a single well-defined spectral component.
B.0.17 G291.0-0.1
G291.0-0.1 (Fig. A.17, A.31, A.42) is classified as a composite SNR with a radio shell and a central PWN emitting both radio and X-ray non-thermal radiation (Slane et al. 2012). The radio morphology of this SNR is quite characteristic with a shell mainly composed of two parallel arcs lying in the northwest-southeast direction, and a central bridge similarly oriented and co-spatial with the non-thermal X-ray emission. A faint diffuse emission surrounds the three structures (Whiteoak & Green 1996). X-ray studies confirmed the PWN nature of the non-thermal central bridge and identified the X-ray counterpart of the pulsar driving the nebula (Slane et al. 2012).
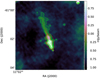 |
Fig. B.10 PWN associated with the SNR G290.1-0.8 as observed with SMGPS at 1.284 GHz. The green contours indicate the SMGPS intensity levels at -0.6, -0.41, 0.04, 0.5, 1.0, 1.4 mJy−1 beam−1, while the red ellipse encloses the radio emission of the PWN detected in the previous radio observations (Pavan et al. 2014). The yellow cross marks the position of the PSR. |
In the SMGPS image (Fig. A.17 upper-left), we can clearly distinguish and resolve the three bar-like structures. The shell of diffuse emission is more defined than previous images (MOST at 0.843 GHz from Whiteoak & Green 1996 and ATCA at 1.4 GHz shown by Slane et al. 2012) and some filamentary structures are barely resolved inside it. The central PWN shows a well-defined, elongated structure with different filaments branching outward in all directions. We also detected for the first time a large diffuse emission that extends with a cloak-like shape from the northeast SNR edge to the north for ~16 arcmin. By using a logarithmic brightness scale, the weak boundaries of this region are revealed, indicating the association of this region to the SNR. It appears as a blowout region expanding into a rarefied medium, and we propose it as the radio counterpart of the X-ray plume (16 arcmin in size) detected by Wilson (1986). This feature is also detected in the GLEAM image at 0.155 GHz (Fig. A.17 upper-right). G291.0-0.1 is the typical case in which the SMGPS capabilities on recover both fine details and faint-extended structures provide the most comprehensive view of the SNR morphology.
We calculated the integrated flux density in both SMGPS and GLEAM images by considering an extraction region including the blowout region. The integrated spectrum of G291.0-0.1, including our measurements and the literature one, is shown in Fig. A.31. Since the literature flux densities refer to the bright shell region (excluding the ‘cloak’ region), we modeled the spectrum with a simple power-law function applied only to our data. We highlight the consistency between the SMGPS and GLEAM measurements, which result in a spectral index of −0.32 ± 0.02, compatible with the literature value of −0.29 ± 0.05 (Roger et al. 1986). Also part of the literature data are consistent with the fit, while we attributed the underestimation of the other ones to the exclusion of the halo region.
In Fig. A.17, we show the 0.155 − 1.284 GHz spectral index map of G291.0-0.1. The flat-bright spot in the southeastern side of map results from the contribution of the adjacent H II region G291.214-00.246 cataloged as ‘known’ by Anderson et al. (2014) (Caswell & Haynes 1987). The central bright structure appears as a flat spot with a mean spectral index of ~ −0.14, as expected for a PWN spectrum. In the blowout region the spectral index varies from ~ −0.3 to ~ 0.3 from the bright edge to the faint-central regions, respectively. The smooth spectral index variation along the remnant is highlighted in our BB-plot (Fig. A.42), where the steeper and the fainter components are not sharply separated, but result in a fan-shaped form. We still tried tentatively to fit the two components, obtaining a spectral index of −0.47, clearly associated with the SNR, and one of −0.10 that seems more indicative of the PWN than the halo region. Two spectral components are also identified in the histogram, where the main peak again traces the SNR, while the second one at ~ 0.06 could be associated with the halo.
B.0.18 G292.2-0.5
G292.2-0.5 (Fig. A.18, A.31, A.42) is a recently studied object, classified as a young SNR by Crawford et al. (2001), with estimated age between 4.2 and 7.1 kyr (Kumar et al. 2012). It is one of the few SNRs for which the association with the parent pulsar, PSR J1119–6127 (Camilo et al. 2000), has been confirmed (Caswell et al. 2004). The radio morphology of G292.2-0.5 consists of a faint elliptical shell centered on the pulsar position. X-ray observations revealed a partially limb-brightened shell (brighter to west side) and a central bulk of both thermal and non-thermal emission, the latter attributed to the PWN powered by PSR J1119–6127 (Kumar et al. 2012). On the basis of the X-ray morphology, G292.2-0.5 was reclassified as a composite-type SNR. Very high energy gamma ray emission was detected with H.E.S.S., coinciding with the X-ray PWN position (H.E.S.S. Collaboration 2018).
Our SMGPS image (Fig. A.18) reveals a nearly complete shell structure with indented edges, at the highest resolution obtained so far. The bulk of the radio emission comes from the southeastern rim. Another bright region is associated with the clumpy and filamentary region located in the southwest edge. Faint diffuse emission, with some filamentary structures, fills in the interior of the shell. A bright point source is detected exactly at the location of PSR J1119–6127, providing its first radio detection. It is indicated with the yellow circle in Fig. A.18 (upper-left). We have not detected any structure attributable to the radio counterpart of the X-ray PWN associated with PSR J1119–6127.
From a simple power-law fit of the G292.2-0.5 spectrum (Fig. A.31), we obtained an integrated spectral index of −0.48 ± 0.01, slightly flatter then the previous estimation (α = −0.53 ± 0.01) provided by Caswell et al. (2004). However, the perfect agreement between new and old measurements distributed over a wider frequency range ensures the high reliability of our spectral index estimation.
The 0.155-1.284 GHz spectral index map (Fig. A.18) reveals a very flat central region, with an average α of ~ 0.08, corresponding to the fainter central region of the remnant. Steeper spectral indices are observed at the bright shell edges, ranging from lower values corresponding to the brighter southeastern region (averaged α ~ −0.43) to higher values (α ~ −0.02) from the northern part of the shell. Taking into account the complex region where the SNR is located, we attributed the flat spectrum in the faint-central region to a difficult background subtraction by considering very faint emission both in the SMGPS and GLEAM images. The spectral flattening observed in the western side of the shell could be attributable to the contribution of several nearby H II regions.
From the BB-plot shown in Fig. A.42, we can distinguish two spectral components with spectral index of −0.59 and −0.16, tracing the different spectral behavior of the east and west side of the shell, respectively.
B.0.19 G293.8+0.6
G293.8+0.6 (Fig. A.19, A.32, A.43) is a composite SNR with a faint almost circular shell and a bright plerionic component. It is a very poorly studied object: it was imaged so far in the radio band only with MOST at 0.408 and 0.843 GHz (Whiteoak & Green 1996); X-ray observations were performed with Chandra. These latter allowed to detected the parent pulsar PSR J1135–6055 and the related PWN, matching the eastern side of the radio plerion. No X-ray emission from the remnant was observed (Bordas & Zhang 2020).
In the SMGPS image (Fig. A.19, upper-left), the faint and diffuse shell is well recovered and the radio morphology of the central source is resolved with unprecedented detail. The radio shell shows a brighter and sharper edge at its southeast side, where the shock seems to have found an obstacle to its expansion, resulting in a break of the perfect circularity of the shell. To investigate the origin of this region, we compare the SMGPS image with the SGPS data tracing the H I emission from MCs (McClure-Griffiths et al. 2005). In Fig. B.11, we can see that the H I emission (magenta contours) follows the sharp radio edge trend in the southeastern side of the remnant. This morphological correspondence suggests a possible interaction between the shock front and adjacent MCs, which might also explain the spectral flattening observed in this region of the 0.155-1.284 GHz spectral index map (Fig. A.19). To further hint a possible SNRMC interaction, we compared the distance of the parent pulsar, estimated at 2.8 kpc (Bordas & Zhang 2020), with the kinematic distance of the H I MC. We identify the peak of the excess of molecular emission in the south-southeastern G293.8+00.6 edges at the velocity of ~ −24 km s−1. By considering this velocity, we used the Monte Carlo method with the Reid et al. (2014) rotation curve and updated solar motion parameters (Wenger et al. 2018)7 to estimate the near and far kinematic distances of ![Mathematical equation: $\[2.12_{-0.70}^{+0.61} ~\mathrm{kpc}\]$](/articles/aa/full_html/2024/12/aa50404-24/aa50404-24-eq3.png) and
and ![Mathematical equation: $\[4.58_{-0.67}^{+0.70} ~\mathrm{kpc}\]$](/articles/aa/full_html/2024/12/aa50404-24/aa50404-24-eq4.png) . The consistency between the parent pulsar and the −24 km s−1 H I cloud distances support the interaction suggested by their morphological correspondence.
. The consistency between the parent pulsar and the −24 km s−1 H I cloud distances support the interaction suggested by their morphological correspondence.
The integrated spectrum of G293.8+0.6 (Fig. A.32) shows a significant discrepancy between the literature measurements and our SMGPS and GLEAM points, which do not confirm the concave-up shape toward the high frequencies. We obtained an integrated spectral index of −0.34 ± 0.07, significantly flatter than the previous estimation (−0.55, Trushkin 1999).
Our spectral index map (Fig. A.19 bottom-left) reveals a bipolar structure with steep regions (α ~ −0.4) in the eastern and western limbs, corresponding to the brightness remnant edges. Two flat spots are located in the northwestern (α ~ −0.1) and in the southern region (α ~ −0.15), in both cases without a clear association with peculiar structures in the brightness map. We do not notice any spectral structure clearly associated with the bright central region: the central region in the spectral index map is fairly uniform, with values ranging from ~ −0.26 and ~ −0.14, perfectly compatible with the value expected for a PWN. The steeper-little spot (~ −0.32) located in its southern side is an exception, probably related to the point-like extra galactic source well detected in the SMGPS image.
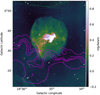 |
Fig. B.11 SMGPS image of the SNR G293.8+0.6 at 1.284 GHz with superposed contour levels of the HI emission at 15.75, 16.25, 16.5, 16.75, and 17.75 K from the SGPS data. |
The analysis of the spatial spectral index distribution, resulting in the graphs shown in Fig. A.43, allowed us to distinguish two spectral components. They are particularly evident in the histogram, where the main peak at ~ −0.21 traces the spectrum of the bright plerionic structure, while the second peak at ~ −0.4 traces the spectral behavior of the faint shell.
B.0.20 G296.7-0.9
G296.7-0.9 (Fig. A.20, A.32, A.43) was confirmed as a SNR by Robbins et al. (2012) on the basis of radio and X-ray observations. It shows a bilateral radio morphology with the brightest regions located at the northeastern and southwestern edges and a plateau of diffuse emission just beyond the southern brightest region. The latter probably results from a breakout portion of the SNR expanding into a rarefied lower density medium. Three arc-like structures extend in the northeast-southwest direction, and join the two bulge of brighter emission. The H II region G296.660-00.925 (cataloged as ‘known’ by Anderson et al. 2014, Caswell & Haynes 1987) is co-located with G296.7-0.9.
The SMGPS image, shown in Fig. A.20 (upper-left), provides the highest resolution view ever obtained for this SNR. We resolve the southern emission bulge into two bright spots, both accompanied by a weaker emission that extends in the north-south direction. The northern bright emission shows an inhomogeneous structure including bright spots and some filamentary structures. The three northeast-southwest arcs are well detected, while the plateau feature results a bit confused with the diffuse background emission.
In Fig. A.32, we show the integrated spectrum of G296.70.9. We point out a good agreement between, SMGPS, GLEAM and the literature measurements, resulting in a integrated spectral index of −0.35 ± 0.06, which is slightly consistent with the previous estimation of −0.5 ± 0.1 in the 0.843-1.4 GHz frequency range (Robbins et al. 2012). The MWA points suggest a low frequencies spectral turnover related to thermal absorption, but other radio observations at the same and lower frequencies will be needed to confirm it.
Our 0.155-1.284 GHz spectral index map (Fig. A.20, bottom-left) shows distinct spectral regions: the brightest part of the northern shell boundary presents a mean spectral index of ~ −0.58, clearly associated with the SNR; a mean spectral index of ~ −0.33 is observed corresponding to the plateau region; the easternmost of the three arcs features has an average spectral index of ~ −0.43; the southern bright bulge shows a significantly flatter spectrum with a mean α value of ~ −0.15. This spectral flattening could result from the significant contribution of the H II region, which we argue to be probably associated with one of the bright features (or both in the case of two H II regions very close) of the southern radio bulge. In order to investigate the location of the H II region, we compared our SMGPS map with the 8 μm GLIMPSE and 22 μm WISE emissions as shown in Fig. B.12. We observed a perfect match between the radio and the 22 μm IR emission in the three bright spots inside the southern bulge (indicated by magenta harrow in Fig. B.12). The 8 μm shows a complex morphology in this region, partially surrounding the radio/22μm features. This radio-IR morphology is typically associated with H II regions, where the radio and the 22-μm emissions trace the ionized nebula, while the 8 μm is associated with the emission from the molecules that can only survive beyond the ionization front (Ingallinera et al. 2019). This picture points toward the presence of at least three H II regions, corresponding to the bright radio features well resolved in the SMGPS image, co-spatial with G296.7-0.9 and previously cataloged as the single H II region G296.660-00.925. We also noted an 8-μm cavity region in positional coincidence with the radio plateau, providing further confirmation of the lower density of this region (indicated with the yellow arrow in Fig. B.12).
The BB-plot (Fig. A.43) clearly distinguishes the remnant and H II region components, allowing us to estimate the related spectral indices: α ~ −0.58 for the SNR; α ~ 0.01 for the H II regions.
B.0.21 G296.8-0.3
The SNR G296.8-0.3 (Fig. A.21, A.32, A.44), also known as 1156-62, was observed in the radio band as an elongated shell in the northwest-southeast direction. High-resolution images revealed a bit complex morphology, constituted by two main loops and several small ring-like structures distributed in the central part. The sharp northwest edge of the shell is the brightest region, while the eastern boundary is fainter and diffuse (Gaensler et al. 1998). X-ray observations revealed a diffuse emission corresponding to the remnant center and brighter features well coincident with the internal northwest radio shell. The infrared 24-μm emission shows a high correlation with the radio shell structures (Sánchez-Ayaso et al. 2012).
We compared the SMGPS image (shown in Fig. A.21, upper-left) with the highest resolution one available in the literature, provided by ATCA observations at 3 GHz (Fig. 1 Gaensler et al. 1998). The ring-like structures detected in the ATCA image, are fully resolved in our image revealing a highly filamentary morphology. We detect for the first time different filaments in the arc feature extending toward the northeastern shell boundary, previously observed as a bump of diffuse emission. The western boundaries are more defined in our image, even if with several indentation points. A large ear-like structure outside the eastern SNR rim, never detected in previous images, is recovered in the SMGPS image.
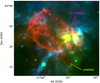 |
Fig. B.12 Three-color image of G296.7-0.9. In red is SMGPS at 1.284 GHz, in green is WISE at 22μm, and in blue is GLIMPSE at 8μm. |
In Fig. A.32, we show the integrated spectrum of G296.8-0.3. We point out a very good agreement between the flux densities across the whole frequency range. In particular, our SMGPS measurement is perfectly consistent with the ATCA and Parkes values at the similar frequencies of 1.34 and 1.42 GHz, respectively. We obtained an integrated spectral index of 0.60 ± 0.02, in good agreement with previous estimations (α = −0.65 ± 0.08, Gaensler et al. 1998).
The 0.155 − 1.284 GHz spectral index map (Fig. A.21, bottom-left) shows significant spectral variations between the northwest and east-southeast shell edges (with averaged spectral index respectively of −0.57 and −0.52) and the steeper central (α = −0.67) and southwest (α = −0.70) regions. This last region shows the same brightness morphology as the rest of the shell boundary, but its spectral behavior suggests the presence of a different particle population. Finally, we detected a flat-spectrum elongated region (averaged α = −0.62) that departs approximately from the center of the northwest rim and branches inward. It partially includes the western part of the central filaments detected in the brightness map, as well as the empty region just west of this. Therefore, there is not a clear association between the spectral flattening and the bright SNR features.
The spectral inspection graphs (Fig. A.44) do not allow us to distinguish the contribution of the different regions identified in the spectral index map. They clearly show a single spectral component, probably due to a least significant difference between the spectral index values of the regions.
B.0.22 G301.4-1.0
G301.4-1.0 (Fig. A.22, A.32, A.44) is a very poorly studied source, identified by Whiteoak & Green (1996) as a circular shell remnant with an elongated blowout structure extending in southwest direction (MOST data at 0.843 GHz). No other observations are reported in the literature at other wavelengths.
The SMGPS image (Fig. A.22, upper-left) confirms the radio morphology revealed by MOST, providing a much better resolution. Three filamentary structures are resolved in the northwest side of the shell, as well as the bright structure that composes the south and southeast remnant boundaries. The diffuse emission in the inner regions, barely detected in the MOST image, shows slightly resolved filamentary features. Our image also allows us to clearly identify the contours of the blowout region.
Through our SMGPS and GLEAM integrated flux density measurements, we characterized for the first time the integrated spectrum of this SNR. It is shown in Fig. A.32 with the related power-law fit, which provides an integrated spectral index of −0.52 ± 0.08. We notice a significant discrepancy between the GLEAM-SMGPS points and the MOST measurement, probably due to a different extraction region choice.
The 0.155 − 1.284 GHz spectral index map (Fig. A.22, bottom-left) indicates three main regions with different spectral features. The bright northeastern side of the shell presents an average spectral index significantly flatter (α ~ −0.32) than the integrated one. This spectral flattening could be due to the interaction of the SNR shock with dense ambient medium, taking into account that this part of the remnant is adjacent to a complex radio region of bright features surrounded by diffuse emission, which also include the H II region G301.734-00.805. A spectral steepening (average α = −0.63) is observed in correspondence of the southeastern arc that connects the two brighter remnant regions. The other SNR regions have, in general, intermediate spectral values (~ −0.45). We also noted a positional correspondence between the flat spectral spots observed in the southwestern region of the spectral index map and the filamentary features slightly resolved in the MeerKAT brightness map. Higher resolution spectral index maps will be needed to firmly confirm this spatial match.
The graphs shown in Fig. A.44 summarize the study on the spectral index distribution within the remnant. The contribution of the different spectral regions are not distinguishable in the BB-plot, but they result in a spread of the spectral distribution indicating a gradual spectral index variation.
B.0.23 G332.4+0.1
G332.4+0.1 (Fig. A.23, A.32, A.45), also known as Kes 32, is a young SNR (~ 3000 yr, Vink 2004) observed in the radio band as an irregular shell whose emission bulk comes from its northwest rim. A blowout region extends to the east ending with a plume of diffuse emission in its northern part (Whiteoak & Green 1996). The southwestern rim of G332.4+0.1 overlaps with the two H II regions G332.415+00.053 and G332.382+00.080 (Caswell & Haynes 1987), cataloged by Anderson et al. (2014) as ‘candidate’ and ‘known’, respectively.
By comparing our SMGPS image (Fig. A.23, upper-left) with the MOST one at 0.843 GHz (the only one available in the literature at a comparable frequency), we observed that the brightest regions present a filamentary morphology. In particular, the blowout shell presents an elongated shape in its northern part, which then continues with a clearly detected diffuse emission for ~5 arcmin, while it is only hinted in the MOST image. In our image, the southern part of the blowout is actually made up of bright features elongated in the northwest-southeast direction that would seem morphologically unrelated to it. In the same region, just west the brightest features, and in perfect positional coincidence with the H II region G332.382+00.080, we also detected a circular structure that could be ascribed to the radio counterpart of this H II region. The SMGPS image also restore very well the diffuse emission from the inside and the south edge of the shell, which results sharply defined.
The integrated spectrum of G332.4+0.1 is shown in Fig. A.32. We modeled it with as simple power-law function by excluding the point at 0.086 GHz (MSH, Holden & Caswell 1969), which is obviously a strong overestimate with respect to the GLEAM data. We obtained a spectral index of −0.57 ± 0.07, consistent with previous estimates (α = −0.5; Green 2022), even if slightly steeper. We pointed out a significant spread of the flux densities and the need of new sensitive measurements in a wide frequency range to more firmly constrain the integrated spectrum of this object.
Our 0.155 − 1.284 GHz spectral index map (Fig. A.23, bottom-left) shows two distinct spectral regions: one is clearly associated with the main shell of the SNR, which presents a mean spectral index of ~ −0.51 at the edges and of ~ −0.61 in the central region; an almost complete flatter shell with mean α ~ −0.35 exactly corresponding to the blowout region. The southern part of this last spectral region spatially matches the H II regions, which could contribute to the observed spectral flattening. Anyway, also the rest of the blowout region shows a significant spectral flattening with respect the main G332.4+0.1 structure. In order to investigate the possible contribution from other not cataloged H II regions in this region, we compared our radio image with the IR ones at 8 μm (GIMPSE) and 22 μm (WISE). As shown in Fig. B.13, the three bands exactly reproduces the nebular morphology expected for the H II region corresponding to the location of G332.415+00.053 and G332.382+00.080. No IR emission is instead observed in correspondence of the blowout region, confirming its non-thermal nature. Taking into account its well-defined shell morphology, which appears unrelated to the main G332.4+0.1 shell, and its significantly different spectral behavior, the blowout region would be associated with another SNR co-located with G332.4+0.1. Further radio observations at different frequencies, including polarimetric studies, could be crucial to investigate the different spectral and magnetic field proprieties of this region compared to the rest of G332.4+0.1 and assess its separated origin.
We studied the spatial distribution of spectral indices across G332.4+0.1 through the graphs shown in Fig. A.45. The two previously discussed spectral components are distinguishable in the histogram, where we observed a main peak at α ~ −0.5 and a second one at α ~ −0.35, clearly associated with the blowout region. The two contribution are instead barely visible in the BB-plot and their are impossible to fit separately.
B.0.24 G335.2+0.1
G335.2+0.1 (Fig. A.22, A.32, A.45) is a SNR with a well-defined radio shell and inner elongated structures in the southwest-northeast direction. It has not been detected at other wavelengths. The TeV source HESS J1626-490 was observed within 0.5 deg from G335.2+0.1 in the southwest direction and in spatial coincidence with 12CO and H I clouds. Assuming that G335.2+0.1 is a fairly evolved object (middle-aged or older), de Wilt et al. (2017) suggested that this SNR could be source of the CRs accountable for the TeV emission, as result of their interaction with the nearby MCs.
The SMGPS image of G335.2+0.1 (Fig. A.24, upper-left) allowed us to appreciate the striated emission inside the remnant with unprecedented detail. These elongated structures are interspersed with very low brightness regions. The bright spot observed in the northwestern region with MOST at 0.843 GHz is detected as a point-like source in our image.
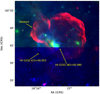 |
Fig. B.13 Three-color image of G332.4+0.1. In red is SMGPS at 1.284 GHz, in green is WISE at 22μm, and in blue is GLIMPSE at 8μm. |
In the integrated spectrum of G335.2+0.1 (Fig. A.32), we observed a good agreement between the flux densities across the entire frequency range, which result in a simple power-law fit with α = −0.47 ± 0.03, perfectly consistent with the previous estimation of −0.46 provided by Clark et al. (1975).
The spectral index map obtained from the 0.155 GHz GLEAM image and the 1.284-GHz SMGPS one is shown in Fig. A.24. We observed a non-uniform spatial distribution of the spectral values across the remnant. A flat region (average α ~ −0.36) is located right northwest of the SNR center, corresponding with an emission-free region both in the GLEAM and SMGPS image. We attributed this spectral flattening to a background selection effect. Just west of this, we observed a steep region (averaged α ~ −0.56) exactly centered on the point-like source detected with SMGPS in the northwestern region of the remnant, suggesting its extra-galactic origin. Other flat-filamentary features are distributed across the remnant with mean spectral values ranging from ~ −0.63 in the southeastern region to ~ −0.49 in the northwestern side of the map, without a clear association with the brightness structures.
The different spectral behavior of the brightness regions is not reflected on the BB-plot (Fig. A.45), where the spectral components are not distinguishable. Only in the histogram, we identified two peaks: the main one at α ~ −0.49, tracing the brightest-flat filaments, and a much lower one at α ~ −0.59 that is probably associated with the steep point-like region.
B.0.25 G337.3+1.0
G337.3+1.0 (Fig. A.25, A.33, A.46), also known as Kes 40, is a typical shell SNR. Only radio observations are referenced in the literature, which highlighted its almost perfectly circular shape with different bumps along the shell rim (Whiteoak & Green 1996). Polarization studies revealed a radial magnetic field configuration, which coupled with the small size circular morphology, suggests the early evolutionary stage of this SNR (Milne et al. 1989).
The comparison between our SMGPS image (Fig. A.25, upper-left) and the highest resolution one available in the literature (MOST at 0.843 GHz) demonstrates the much better capability of the first to recover the shell morphology of G337.3+1.0. The SMGPS map revealed for the first time its extremely clumpy emission, as well as the little bumps of diffuse emission extending outward from the shell. The SMGPS map allowed us to also perform the first radio detection of the elongated source located slightly north of the SNR geometric center and the nearby point source ((α, δ) = (16h32m36.337s, -46°35’31.62”)).
The integrated spectrum of G337.3+1.0 is shown in Fig. A.33. We modeled it with a simple power-law model, obtaining an integrated spectral index of −0.48 ± 0.05, consistent within the errors with the previous estimation of −0.55 reported by Whiteoak & Green (1996).
Through the 0.155 − 1.284 GHz spectral index map (shown in Fig. A.25, bottom-left), we investigated for the first time the spectral spatial distribution of this SNR. The map clearly shows a bilateral spectral morphology with flatter spectral caps in the northeast-southwest sides (mean α ~ −0.43), and steeper regions in the remaining shell parts (mean α ~ −0.58). This polar cap morphology is only hinted in the brightness map, and an unambiguous association between spectral flat/steep and bright/faint shell regions is unfeasible. A central region with a flatter spectrum is also evident at the shell center, extending slightly to the north, and coincident with the position of the new-detected elongated and point-like sources. The spectral flattening and the cometary morphology of the resolved structure could suggest its PWN nature. In this picture, the position of the point-like source could be consistent with a possible associated pulsar. By considering the low-brightness of this region both in the SMGPS and GLEAM map, we cannot exclude that the spectral flattening is due to a background bias effect. Further high-resolution radio observations will be needed to firmly constrain the spectral and morphological characterization of this region.
The bilateral spectral distribution of the shell results in a double peaked histogram at α ~ −0.48 and α ~ −0.55 (Fig. A.46). The two components are also present in the BB-plot even if not easily distinguishable, probably due to the fact that the difference in spectral indices is not large enough and both are associated with bright SNR regions.
B.0.26 G348.7+0.3
G348.7+0.3 (Fig. A.26, A.33, A.46), also known as CTB 37B, is a young SNR (age ~ 5000 yr, Aharonian et al. 2008) observed in the radio band as a shell with a plateau of diffuse emission extending from its southeastern edge to south until it reach the nearby SNR G348.5+0.1 (Whiteoak & Green 1996). G348.7+0.3 is evolving into a complex region including other SNRs (G348.5+0.1 and G348.5-0.0), several H II regions and OH masers, which suggest a high starburst activity (Xin et al. 2016). X-ray observations of G348.7+0.3 revealed thermal emission coinciding with the brightest edge of the radio shell, within which the point X-ray source (CXOU J171405.7-381031) was identified as the magnetar associated with the remnant (Aharonian et al. 2008). A non-thermal diffuse X-ray component was detected in the southern SNR rim (Nakamura et al. 2009). The γ-ray counterpart of G348.7+0.3 was detected both with Fermi-LAT (Xin et al. 2016) and H.E.S.S. (Aharonian et al. 2008), indicating an efficient cosmic-ray acceleration.
Our SMGPS image (Fig. A.26, upper-left) provides the highest-resolution image of G348.7+0.3 and surrounding region. We were able to detect for the first time the whole shell, including the faint emission from eastern side and its boundaries. The eastern rim is composed of two main brightest region and a third fainter one in the northern part, all connected by filamentary structures that also extend toward the remnant center. Another bright region with arc-like morphology constitutes the southern shell edge (in perfect positional coincidence with the non-thermal X-ray source). The plateau of diffuse emission is well detected, extending south for ~ 10 arcmin. In our high-resolution image this region appears separated from G348.7+0.3. Differently from previous images (e.g., the MOST image, Fig. 25 in Whiteoak & Green 1996), we can clearly detect a complex of filamentary structures located just east of the remnant that roughly make up an almost complete circular structure and a partial shell tracing the eastern G348.7+0.3 edge. This whole region is indicated as ‘candidate’ H II region (G348.770+00.282) in the Anderson et al. (2014) catalog. In the same region, we also detected the point counterpart of the H II region G348.713+00.328 cataloged as ‘radio quiet’ by Anderson et al. (2014). The other two extended source resolved just south/southeast of the G348.7+0.3 border are associated with the H II regions G348.543+00.369 (‘candidate’) and G348.515+00.373 (‘radio quiet’) (Anderson et al. 2014).
Consistently with the previous studies, we calculated integrated flux densities for the SMGPS and GLEAM images by considering an extraction region that includes the bright G348.7+0.3 shell, the southern plateau and the eastern filamentary region. From the resulting integrated spectrum (shown in Fig. A.33), we obtained α = −0.36 ± 0.03, consistent with previous estimates (α = −0.3 ± 0.1, Kassim et al. 1991). We notice the strong dispersion of the flux density measurements across the entire spectrum, probably due to different interpretation of the remnant boundaries. By exploiting the high-resolution of the SMGPS map, which allow us to clearly distinguish the remnant from the probably unrelated sources, we restricted the extraction region to the remnant shell and recalculated the SMGPS and GLEAM flux densities. As shown in Fig. A.33, they are in good agreement and related spectrum is significantly steeper (α = −0.41 + / − 0.02) with respect to the previous one. This is probably due to the spectral contamination from nearby H II regions in the previous flux measurements.
In the G348.7+0.3 spectral index map, shown in Fig. A.26, we can clearly distinguish the spectral region associated with the G348.7+0.3 shell, with an average α ~ −0.38, from those of the plateau and the eastern filamentary region. Both these regions present generally flatter spectral indices although with a certain variability, ranging from ~ −0.1 to −0.4. The morphological details of G348.7+0.3 and its environment provided by the highresolution SMGPS image, coupled with the spatially resolved spectral information, suggest that only the brighter shell structure centered at (α, δ) = (17h13m54.7s, -38°11’21.10”) and with radius of ~ 5.2 arcmin is associated with G348.7+0.3, while the plateau region and the complex of filamentary structures east of the remnant are unrelated emission, probably produced by several H II regions evolving on the same star forming region where G348.7+0.3 has evolved.
We studied the spatial distribution of the spectral index values across the remnant by considering the entire emission region historically associated with G348.7+0.3, obtaining the graphs shown in Fig. A.46. Here the contribution from the different regions is hardly distinguishable, probably due to the low brightness of both the plateau and filamentary regions and the variability of the spectral index values across these regions. The two very close peak in the histogram are most probably associated with the different spectral regions within the main shell.
B.0.27 G351.7+0.8
G351.7+0.8 (Fig. A.27, A.33, A.47) was presented as a new SNR by Whiteoak & Green (1996) on the basis of MOST observations at 0.843 GHz. It was described as a shell-type SNR with a plateau of faint emission, and located in close proximity to the bright H II region G351.693+00.671 (cataloged as ‘known’ by Anderson et al. 2014, Anderson et al. 2011). The only other observations of this object were SGPS at 1.4 GHz, including both radio continuum and H I emission (Tian et al. 2007).
SMGPS provided the best image of G351.7+0.8 ever achieved in terms of both resolution and sensitivity (see Fig. A.27, upper-left). Compared with the previous images, we can better distinguish the shell edges, which appear well defined throughout the remnant, except for the southern part, where the emission becomes diffuse. Also the internal striated emission along the northeast-southwest direction is much better resolved with respect to the SGPS image. The bright clump observed with MOST and SGPS in the northern G351.7+0.8 rim, is detected as a point source in the SMGPS image.
We showed the integrated spectrum of G351.7+0.8 in Fig. A.33. We fitted it with a simple power-law function obtaining α = −0.37 ± 0.06, which is in rough agreement with the last estimation (−0.52 ± 0.25, Tian et al. 2007) and much more sensitive. We point out that the SGPS flux density measurement at 1.4 GHz is significantly higher with respect to the SMGPS one at a comparable frequency. We attributed this discrepancy to the difficulty to distinguish the remnant from the emission contribution of the nearby H II region in the lower-resolution SGPS map.
The spatial distribution of the spectral indices is shown by the spectral index map in Fig. A.27. By excluding the southeast and southwest rims, where there is a clear spectral contamination from the adjacent H II regions, the spectral index map is quite uniform. We observed a slightly flatter region (α ~ −0.43) with respect to the surrounding area values (α ~ −0.48) corresponding to the bright northern rim, tracing strong shock acceleration mechanisms. Other similar flatter regions spread within the remnant, but without any association with brightness structures. To investigate this aspect, we compared our spectral index map with the 8-μm emission from GLIMPSE. We see that the 8-μm emission related to the nearby H II regions extends with filamentary structures up to the SNR interior, resulting in anti-correlation with the radio spectral flat structures. This behavior could indicate a spectral contribution from the H II region ionized material inside the molecular 8-μm emission. A more detailed multi-wavelength study will be need to confirm this hypothesis.
The graphs shown in Fig. A.47 do not allow us to distinguish different spectral contributions, confirming the rather uniform distribution of the spectral indices across the remnant. The region with high dispersion of the points in the bottom side of the BB-plot (for GLEAM brightness below ~ 0.4) could be related to the internal regions with flatter spectral indices not associated with bright radio features.
B.0.28 G351.9+0.1
G351.9+0.1 (Fig. A.28, A.33, A.47) was proposed as a Class II new SNR (candidate with fairly confidence, to be confirmed) by Hurley-Walker et al. (2019b) on the basis of GLEAM and the Molonglo Galactic Plane Survey (MGPS at 843 MHz) images. They described it as a shell-like object with fairly distinct boundaries. A bright clump of emission was observed in the southern rim with unclear association with the remnant. In its southern part, G351.9+0.1 is adjacent to a complex emission region associated to several H II regions.
The SMGPS image (shown in Fig. A.28) sheds new light on morphology of this SNR. Unlike the GLEAM and MGPS images, where only a faint and incomplete shell is detected, our image allowed us to identify all shell boundaries. The bulk of the emission comes from the southern rim, from which some faint filaments extend inward. A bright compact source is located inside this region, which were observed as extended in previous images. Some elongated indented structures constitute the northeastern rim, while a ear-like edge defines the northwest side of the shell. Diffuse structures fill the inside of the shell, where we also detected a point source associated with the H II region G351.919+00.114 (cataloged as ‘compact’ by Anderson et al. 2014) and a circular extended source corresponding to the H II region G351.862+00.202 (cataloged as ‘radio quiet’ by Anderson et al. 2014).
From our SMGPS and GLEAM measurements, we obtained the integrated spectrum of G351.9+0.1 shown in Fig. A.33. We observed that the SMGPS point is consistent with the GLEAM spectral trend. From a simple power-law fit, we calculated a spectral index of −0.47 ± 0.04, significantly flatter than that obtained by Hurley-Walker et al. (2019b) by coupling GLEAM and MGPS data (α = −0.98 ± 0.07). This is attributable to the significant inconstancy between the MGPS point at 843 GHz (~ 1 Jy, from Fig.B31 in Hurley-Walker et al. 2019b) and our SMGPS estimation at 1.284 GHz (2.6 ± 0.2 Jy).
The 0.155 − 1.284 GHz spectral index map (Fig. A.28) reveals a slight spectral difference between the northern and the southern part of the shell. By excluding the flatter-inner regions that are clearly associated with the two H II regions, the northern rim presents a mean spectral index of ~ −0.38, while the southern one shows a steeper spectrum with mean α ~ −0.42. The southwestern region mainly contributes to this spectral steepening with α ranging from ~ −0.69 to ~ −0.55. We attributed this steepening to the bright point source, probably of extragalactic origin and exactly located at the center of this spectral steep region.
Both in the histogram and the BB-plot shown in Fig. A.47, the components related to the two parts of the shell are not distinguishable.
References
- Abdo, A. A., Allen, B., Berley, D., et al. 2007, ApJ, 664, L91 [NASA ADS] [CrossRef] [Google Scholar]
- Ackermann, M., Ajello, M., Allafort, A., et al. 2013, Science, 339, 807 [NASA ADS] [CrossRef] [Google Scholar]
- Aharonian, F., Akhperjanian, A. G., Barres de Almeida, U., et al. 2008, A&A, 477, 353 [NASA ADS] [CrossRef] [EDP Sciences] [Google Scholar]
- Aharonian, F., Akhperjanian, A. G., Anton, G., et al. 2009, A&A, 499, 723 [NASA ADS] [CrossRef] [EDP Sciences] [Google Scholar]
- Aliu, E., Archambault, S., Aune, T., et al. 2014, ApJ, 787, 166 [NASA ADS] [CrossRef] [Google Scholar]
- Altenhoff, W. J., Downes, D., Goad, L., Maxwell, A., & Rinehart, R. 1970, A&AS, 1, 319 [NASA ADS] [Google Scholar]
- Anderson, L. D., & Bania, T. M. 2009, ApJ, 690, 706 [NASA ADS] [CrossRef] [Google Scholar]
- Anderson, L. D., Bania, T. M., Balser, D. S., & Rood, R. T. 2011, ApJS, 194, 32 [NASA ADS] [CrossRef] [Google Scholar]
- Anderson, L. D., Bania, T. M., Balser, D. S., et al. 2014, ApJS, 212, 1 [Google Scholar]
- Anderson, L. D., Wang, Y., Bihr, S., et al. 2017, A&A, 605, A58 [NASA ADS] [CrossRef] [EDP Sciences] [Google Scholar]
- Auchettl, K., Slane, P., Castro, D., Foster, A. R., & Smith, R. K. 2015, ApJ, 810, 43 [NASA ADS] [CrossRef] [Google Scholar]
- Bhatnagar, S. 2002, MNRAS, 332, 1 [Google Scholar]
- Bocchino, F., Bykov, A. M., Chen, Y., et al. 2012, A&A, 541, A152 [NASA ADS] [CrossRef] [EDP Sciences] [Google Scholar]
- Bordas, P., & Zhang, X. 2020, A&A, 644, L4 [NASA ADS] [CrossRef] [EDP Sciences] [Google Scholar]
- Bordiu, C., Riggi, S., Bufano, F., et al. 2024, A&A submitted [Google Scholar]
- Camilo, F., Kaspi, V. M., Lyne, A. G., et al. 2000, ApJ, 541, 367 [NASA ADS] [CrossRef] [Google Scholar]
- Cardillo, M., Amato, E., & Blasi, P. 2016, A&A, 595, A58 [NASA ADS] [CrossRef] [EDP Sciences] [Google Scholar]
- Castelletti, G., Dubner, G., Clarke, T., & Kassim, N. E. 2011, A&A, 534, A21 [NASA ADS] [CrossRef] [EDP Sciences] [Google Scholar]
- Castelletti, G., Supan, L., Peters, W. M., & Kassim, N. E. 2021, A&A, 653, A62 [NASA ADS] [CrossRef] [EDP Sciences] [Google Scholar]
- Castro, D., Slane, P., Carlton, A., & Figueroa-Feliciano, E. 2013, ApJ, 774, 36 [NASA ADS] [CrossRef] [Google Scholar]
- Caswell, J. L., & Haynes, R. F. 1987, A&A, 171, 261 [NASA ADS] [Google Scholar]
- Caswell, J. L., Clark, D. H., & Crawford, D. F. 1975, Australian J. Phys. Astrophys. Suppl., 37, 39 [NASA ADS] [Google Scholar]
- Caswell, J. L., McClure-Griffiths, N. M., & Cheung, M. C. M. 2004, MNRAS, 352, 1405 [Google Scholar]
- Clark, D. H., Caswell, J. L., & Green, A. J. 1975, Australian J. Phys. Astrophys. Suppl., 37, 1 [NASA ADS] [Google Scholar]
- Cotton, W. D., Kothes, R., Camilo, F., et al. 2024, ApJS, 270, 21 [NASA ADS] [CrossRef] [Google Scholar]
- Crawford, F., Gaensler, B. M., Kaspi, V. M., et al. 2001, ApJ, 554, 152 [NASA ADS] [CrossRef] [Google Scholar]
- de Wilt, P., Rowell, G., Walsh, A. J., et al. 2017, MNRAS, 468, 2093 [NASA ADS] [CrossRef] [Google Scholar]
- Dokara, R., Roy, N., Beuther, H., et al. 2018, ApJ, 866, 61 [Google Scholar]
- Dokara, R., Gong, Y., Reich, W., et al. 2023, A&A, 671, A145 [NASA ADS] [CrossRef] [EDP Sciences] [Google Scholar]
- Downes, D., Wilson, T. L., Bieging, J., & Wink, J. 1980, A&AS, 40, 379 [NASA ADS] [Google Scholar]
- Dubner, G. 2017, Radio Emission from Supernova Remnants, eds. A. W. Alsabti, & P. Murdin (Cham: Springer International Publishing), 2041 [Google Scholar]
- Dubner, G., & Giacani, E. 2015, A&A Rev., 23, 3 [NASA ADS] [CrossRef] [Google Scholar]
- Dubner, G. M., Moffett, D. A., Goss, W. M., & Winkler, P. F. 1993, AJ, 105, 2251 [NASA ADS] [CrossRef] [Google Scholar]
- Dubner, G. M., Giacani, E. B., Goss, W. M., Moffett, D. A., & Holdaway, M. 1996, AJ, 111, 1304 [NASA ADS] [CrossRef] [Google Scholar]
- Dubner, G., Giacani, E., Reynoso, E., et al. 1999, AJ, 118, 930 [NASA ADS] [CrossRef] [Google Scholar]
- Dubner, G., Giacani, E., Reynoso, E., & Parón, S. 2004, A&A, 426, 201 [NASA ADS] [CrossRef] [EDP Sciences] [Google Scholar]
- Duvidovich, L., Petriella, A., & Giacani, E. 2020, MNRAS, 491, 5732 [NASA ADS] [CrossRef] [Google Scholar]
- Egron, E., Pellizzoni, A., Iacolina, M. N., et al. 2017, MNRAS, 470, 1329 [NASA ADS] [CrossRef] [Google Scholar]
- Filipovic, M. D., Payne, J. L., & Jones, P. A. 2005, Serbian Astron. J, 170, 47 [NASA ADS] [CrossRef] [Google Scholar]
- Fischler, M. A., & Bolles, R. C. 1981, Commun. ACM, 24, 381 [CrossRef] [Google Scholar]
- Fuerst, E., Reich, W., Reich, P., Handa, T., & Sofue, Y. 1987, A&AS, 69, 403 [NASA ADS] [Google Scholar]
- Gaensler, B. M., Manchester, R. N., & Green, A. J. 1998, MNRAS, 296, 813 [NASA ADS] [CrossRef] [Google Scholar]
- Goedhart, S., Cotton, W. D., Camilo, F., et al. 2024, MNRAS, 531, 649 [CrossRef] [Google Scholar]
- Gray, A. D. 1994, MNRAS, 270, 847 [CrossRef] [Google Scholar]
- Green, D. A. 2009, MNRAS, 399, 177 [NASA ADS] [CrossRef] [Google Scholar]
- Green, D. A. 2019, J. Astrophys. Astron., 40, 36 [Google Scholar]
- Green, D. A. 2022, Phd Thesis, Cavendish Laboratory, Cambridge, United Kingdom [Google Scholar]
- H.E.S.S. Collaboration (Abramowski, A., et al.) 2011, A&A, 531, A81 [NASA ADS] [CrossRef] [EDP Sciences] [Google Scholar]
- H.E.S.S. Collaboration (Abramowski, A., et al.) 2015, MNRAS, 446, 1163 [NASA ADS] [Google Scholar]
- H.E.S.S. Collaboration (Abdalla, H., et al.) 2018, A&A, 612, A2 [NASA ADS] [CrossRef] [EDP Sciences] [Google Scholar]
- Holden, D. J., & Caswell, J. L. 1969, MNRAS, 143, 407 [NASA ADS] [Google Scholar]
- Hurley-Walker, N., Callingham, J. R., Hancock, P. J., et al. 2017, MNRAS, 464, 1146 [Google Scholar]
- Hurley-Walker, N., Filipović, M. D., Gaensler, B. M., et al. 2019a, PASA, 36, e045 [NASA ADS] [CrossRef] [Google Scholar]
- Hurley-Walker, N., Hancock, P. J., Franzen, T. M. O., et al. 2019b, PASA, 36, e047 [Google Scholar]
- Ingallinera, A., Umana, G., Trigilio, C., et al. 2019, MNRAS, 490, 5063 [Google Scholar]
- Kapińska, A. D., Staveley-Smith, L., Crocker, R., et al. 2017, ApJ, 838, 68 [CrossRef] [Google Scholar]
- Kassim, N. E. 1988, ApJS, 68, 715 [NASA ADS] [CrossRef] [Google Scholar]
- Kassim, N. E. 1992, AJ, 103, 943 [NASA ADS] [CrossRef] [Google Scholar]
- Kassim, N. E., Baum, S. A., & Weiler, K. W. 1991, ApJ, 374, 212 [NASA ADS] [CrossRef] [Google Scholar]
- Koralesky, B., Frail, D. A., Goss, W. M., Claussen, M. J., & Green, A. J. 1998, AJ, 116, 1323 [NASA ADS] [CrossRef] [Google Scholar]
- Kosack, K., Chaves, R. C. G., & Acero, F. 2011, Int. Cosmic Ray Conf., 7, 76 [NASA ADS] [Google Scholar]
- Kovalenko, A. V., Pynzar’, A. V., & Udal’Tsov, V. A. 1994, Astron. Rep., 38, 78 [NASA ADS] [Google Scholar]
- Kumar, H. S., Safi-Harb, S., & Gonzalez, M. E. 2012, ApJ, 754, 96 [NASA ADS] [CrossRef] [Google Scholar]
- Kurtz, S. 2005, IAU Symp., 227, 111 [Google Scholar]
- Lane, W. M., Cotton, W. D., van Velzen, S., et al. 2014, MNRAS, 440, 327 [Google Scholar]
- Langston, G., Minter, A., D’Addario, L., et al. 2000, AJ, 119, 2801 [Google Scholar]
- Lee, Y.-H., Koo, B.-C., & Lee, J.-J. 2020, AJ, 160, 263 [NASA ADS] [CrossRef] [Google Scholar]
- Li, J., Liu, R.-Y., de Oña Wilhelmi, E., et al. 2021, ApJ, 913, L33 [NASA ADS] [CrossRef] [Google Scholar]
- Lockman, F. J. 1989, ApJS, 71, 469 [Google Scholar]
- Lyne, A. G., Stappers, B. W., Bogdanov, S., et al. 2017, ApJ, 834, 137 [NASA ADS] [CrossRef] [Google Scholar]
- McClure-Griffiths, N. M., Dickey, J. M., Gaensler, B. M., et al. 2005, ApJS, 158, 178 [NASA ADS] [CrossRef] [Google Scholar]
- Miceli, M., Bamba, A., Orlando, S., et al. 2017, A&A, 599, A45 [NASA ADS] [CrossRef] [EDP Sciences] [Google Scholar]
- Milne, D. K., Caswell, J. L., Kesteven, M. J., Haynes, R. F., & Roger, R. S. 1989, PASA, 8, 187 [NASA ADS] [CrossRef] [Google Scholar]
- Mitchell, A. M. W., & Gelfand, J. 2022, Pulsar Wind Nebulae (Singapore: Springer Nature), 1 [Google Scholar]
- Nakamura, R., Bamba, A., Ishida, M., et al. 2009, PASJ, 61, S197 [NASA ADS] [CrossRef] [Google Scholar]
- Paredes, J. M., Ishwara-Chandra, C. H., Bosch-Ramon, V., et al. 2014, A&A, 561, A56 [NASA ADS] [CrossRef] [EDP Sciences] [Google Scholar]
- Paron, S., & Giacani, E. 2010, A&A, 509, L4 [NASA ADS] [CrossRef] [EDP Sciences] [Google Scholar]
- Paron, S., Ortega, M. E., Petriella, A., et al. 2012, A&A, 547, A60 [NASA ADS] [CrossRef] [EDP Sciences] [Google Scholar]
- Pauliny-Toth, I. I. K., Wade, C. M., & Heeschen, D. S. 1966, ApJS, 13, 65 [NASA ADS] [CrossRef] [Google Scholar]
- Pavan, L., Bordas, P., Pühlhofer, G., et al. 2014, A&A, 562, A122 [NASA ADS] [CrossRef] [EDP Sciences] [Google Scholar]
- Pedregosa, F., Varoquaux, G., Gramfort, A., et al. 2011, J. Mach. Learn. Res., 12, 2825 [Google Scholar]
- Reach, W. T., Rho, J., Tappe, A., et al. 2006, AJ, 131, 1479 [NASA ADS] [CrossRef] [Google Scholar]
- Reid, M. J., Menten, K. M., Brunthaler, A., et al. 2014, ApJ, 783, 130 [Google Scholar]
- Reynolds, S. P. 2008, ARA&A, 46, 89 [Google Scholar]
- Robbins, W. J., Gaensler, B. M., Murphy, T., Reeves, S., & Green, A. J. 2012, MNRAS, 419, 2623 [NASA ADS] [CrossRef] [Google Scholar]
- Roger, R. S., Costain, C. H., & Stewart, D. I. 1986, A&AS, 65, 485 [NASA ADS] [Google Scholar]
- Sánchez-Ayaso, E., Combi, J. A., Albacete Colombo, J. F., et al. 2012, Ap&SS, 337, 573 [Google Scholar]
- Sezer, A., Ergin, T., Yamazaki, R., Ohira, Y., & Cesur, N. 2018, MNRAS, 481, 1416 [NASA ADS] [CrossRef] [Google Scholar]
- Shaver, P. A., & Goss, W. M. 1970, Australian J. Phys. Astrophys. Suppl., 14, 133 [NASA ADS] [Google Scholar]
- Slane, P., Hughes, J. P., Temim, T., et al. 2012, ApJ, 749, 131 [NASA ADS] [CrossRef] [Google Scholar]
- Sofue, Y., Kohno, M., & Umemoto, T. 2021, ApJS, 253, 17 [NASA ADS] [CrossRef] [Google Scholar]
- Stupar, M., & Parker, Q. A. 2011, MNRAS, 414, 2282 [Google Scholar]
- Su, Y., Yang, J., Zhou, X., Zhou, P., & Chen, Y. 2014, ApJ, 796, 122 [NASA ADS] [CrossRef] [Google Scholar]
- Su, Y., Zhang, S., Shao, X., & Yang, J. 2015, ApJ, 811, 134 [NASA ADS] [CrossRef] [Google Scholar]
- Sun, X. H., Reich, W., Han, J. L., et al. 2011, A&A, 527, A74 [NASA ADS] [CrossRef] [EDP Sciences] [Google Scholar]
- Supan, L., Castelletti, G., Peters, W. M., & Kassim, N. E. 2018, A&A, 616, A98 [NASA ADS] [CrossRef] [EDP Sciences] [Google Scholar]
- Tian, W. W., Li, Z., Leahy, D. A., & Wang, Q. D. 2007, ApJ, 657, L25 [NASA ADS] [CrossRef] [Google Scholar]
- Trushkin, S. A. 1999, Odessa Astron. Pub., 12, 144 [Google Scholar]
- Urošević, D. 2014, Ap&SS, 354, 541 [Google Scholar]
- Vink, J. 2004, ApJ, 604, 693 [NASA ADS] [CrossRef] [Google Scholar]
- Wenger, T. V., Balser, D. S., Anderson, L. D., & Bania, T. M. 2018, ApJ, 856, 52 [Google Scholar]
- Whiteoak, J. B. Z., & Green, A. J. 1996, A&AS, 118, 329 [NASA ADS] [CrossRef] [EDP Sciences] [Google Scholar]
- Wilson, A. S. 1986, ApJ, 302, 718 [NASA ADS] [CrossRef] [Google Scholar]
- Xin, Y.-L., Liang, Y.-F., Li, X., et al. 2016, ApJ, 817, 64 [NASA ADS] [CrossRef] [Google Scholar]
- Yang, A. Y., Urquhart, J. S., Thompson, M. A., et al. 2021, A&A, 645, A110 [EDP Sciences] [Google Scholar]
- Yusef-Zadeh, F., Wardle, M., Rho, J., & Sakano, M. 2003, ApJ, 585, 319 [NASA ADS] [CrossRef] [Google Scholar]
- Zhou, P., & Chen, Y. 2011, ApJ, 743, 4 [NASA ADS] [CrossRef] [Google Scholar]
- Zhou, X., Chen, Y., Su, Y., & Yang, J. 2009, ApJ, 691, 516 [NASA ADS] [CrossRef] [Google Scholar]
- Zhu, H., Tian, W. W., Torres, D. F., Pedaletti, G., & Su, H. Q. 2013, ApJ, 775, 95 [NASA ADS] [CrossRef] [Google Scholar]
All Tables
All Figures
|
Fig. 1 Spectral index maps of the 29 known SNRs investigated in this work. They are obtained from the SMGPS and GLEAM data in the 0.155–1.284 GHz frequency range. The same color scale was used for comparison. The gray contours indicate the intensity levels related to the SMGPS maps convolved and regridded to the GLEAM beam and pixel size. They are the same as those reported in Figs. A1 – A.28. |
| In the text | |
|
Fig. 2 Spatially resolved spectral index study of the SNR G023.3-00.3. Upper left: SMGPS image. The yellow circles indicate the four “known” H II regions overlapping the remnant. Upper right: spectral index map. Bottom: statistical graphs. Brightness is expressed in Jy beam−1. |
| In the text | |
|
Fig. 3 Comparison between the spectral index distribution of our SNR sample from integrated spectral indices estimated in this work (αint in Table B.1) and that obtained by considering the previous integrated spectral index values available in the literature for the same SNRs. |
| In the text | |
|
Fig. 4 Scatter plot between the SNR spectral indices from this work and those from the literature. The αliterature = αthiswork line is shown for reference. |
| In the text | |
|
Fig. B.1 SMGPS image at 1.284 GHz of G018.8+0.3. We chose the color scale to emphasize the emission from the nearby SNR and H II regions. The cyan circles labeled with the number 1 refer to the H II regions G018.762+00.270, G018.766+00.262, G018.761+00.262, G018.741+00.250, while those tagged with the number 2 indicate the H II regions G018.594+00.321, G018.632+00.256, G018.630+00.309, G018.584+00.344 (Anderson et al. 2014). The SNR G019.1+00.2 is indicated with the yellow circle. |
| In the text | |
|
Fig. B.2 Detail of the clumpy emission from the northern arc of G035.6-00.4. Upper: Zoomed-in view of the northern portion of G035.6-00.4 as seen with SMGPS at 1.284 GHz. Bottom: Two-color image of the same region obtained from the SMGPS image (red) and the GLIMPSE image at 8 μm (green). In both images, the yellow arrows indicate the location of the circular structures discussed in the text. |
| In the text | |
|
Fig. B.3 SMGPS image at 1.284 GHz of the SNR G023.3-00.3. The yellow circles indicate the H II regions G023.438-00.241 (1), G023.423-00.216 (2), G023.455-00.201 (3), G023.439-00.187 (4), G023.458-00.179 (5), G023.435-00.153 (6), G023.389-00.148 (7), G023.354-00.136 (8). The cyan circles indicate the H II regions G023.317-00.300, G023.313-00.289, G023.299-00.281, G023.249-00.312, G023.271-00.256, G023.240-00.240, G023.253-00.240, G023.240-00.114, G023.155-00.321, G023.156-00.264. |
| In the text | |
|
Fig. B.4 SMGPS image at 1.284 GHz of the SNR G035.6-0.4. Blue circles indicate the H II region G035.576-00.586 (H II 1) and the H II region cataloged by Lockman (1989) (H II 2). The yellow crosses indicate the pulsar positions. Green contours trace the 13 CO emission integrated in the 51 − 59 km s−1 velocity range at 1.43 and 2.7 K km s−1. The red circle indicates the location of the γ ray source HESS J1858+020. |
| In the text | |
|
Fig. B.5 Spectral index map at 0.155-1.284 GHz of the SNR G035.6-00.4. The magenta contours trace the HESS J1858+020 source at 4, 5 and 6 σ significance levels (HESS Galactic plane survey data as reduced and analyzed by Aharonian et al. 2008). The yellow crosses indicate the pulsar locations. |
| In the text | |
|
Fig. B.6 Spectral index map of G040.5-0.5 in the 0.155-1.284 GHz frequency range from SMGPS and GLEAM images with superposed contour levels of the 12 CO (blue lines) and TeV emission from VERITAS (yellow lines). The 12CO emission is integrated on the −100 − 200 km s−1 velocity interval and the contours correspond to the temperature levels at 4.6, 5.06, 5.52, 6.9, 9.2, 13.8 K. The TeV contours correspond to the significance levels at 3.65, 3.74, 3.83, 4.02, 4.38, 5.48. |
| In the text | |
|
Fig. B.7 Spectral index map of the SNR G046.8-0.3 in the 0.155 − 1.284 GHz frequency range with the overlapping region reported by Anderson et al. (2014) for the H II region G046.792-00.264. |
| In the text | |
|
Fig. B.8 SMGPS image of the G51.21+0.11 complex at 1.284 GHz. The yellow and cyan circles indicate the SNR and H II region locations, respectively. The red contours show to the regions with a maximum spectral index of −0.2, referring to our 0.155-1.284 GHz spectral index map. The blue contours indicate the non-thermal emission region as obtained by Supan et al. (2018) from VLSSr at 74 MHz (Lane et al. 2014). |
| In the text | |
|
Fig. B.9 Spectral index map at 0.155-1.284 GHz of the SNR G289.7-0.3. Blue contours indicate the intensity levels at 0.12, 0.17, and 0.27 Jy beam−1 calculated on the SMGPS map convoluted and regridded to the MWA beam and pixel size. Magenta contours are associated with the HI emission detected in the SGPS data at 9607.85, 9838.77, 10011.23, and 10213.95 K. |
| In the text | |
|
Fig. B.10 PWN associated with the SNR G290.1-0.8 as observed with SMGPS at 1.284 GHz. The green contours indicate the SMGPS intensity levels at -0.6, -0.41, 0.04, 0.5, 1.0, 1.4 mJy−1 beam−1, while the red ellipse encloses the radio emission of the PWN detected in the previous radio observations (Pavan et al. 2014). The yellow cross marks the position of the PSR. |
| In the text | |
|
Fig. B.11 SMGPS image of the SNR G293.8+0.6 at 1.284 GHz with superposed contour levels of the HI emission at 15.75, 16.25, 16.5, 16.75, and 17.75 K from the SGPS data. |
| In the text | |
|
Fig. B.12 Three-color image of G296.7-0.9. In red is SMGPS at 1.284 GHz, in green is WISE at 22μm, and in blue is GLIMPSE at 8μm. |
| In the text | |
|
Fig. B.13 Three-color image of G332.4+0.1. In red is SMGPS at 1.284 GHz, in green is WISE at 22μm, and in blue is GLIMPSE at 8μm. |
| In the text | |
Current usage metrics show cumulative count of Article Views (full-text article views including HTML views, PDF and ePub downloads, according to the available data) and Abstracts Views on Vision4Press platform.
Data correspond to usage on the plateform after 2015. The current usage metrics is available 48-96 hours after online publication and is updated daily on week days.
Initial download of the metrics may take a while.