Open Access
Fig. 2
Download original image
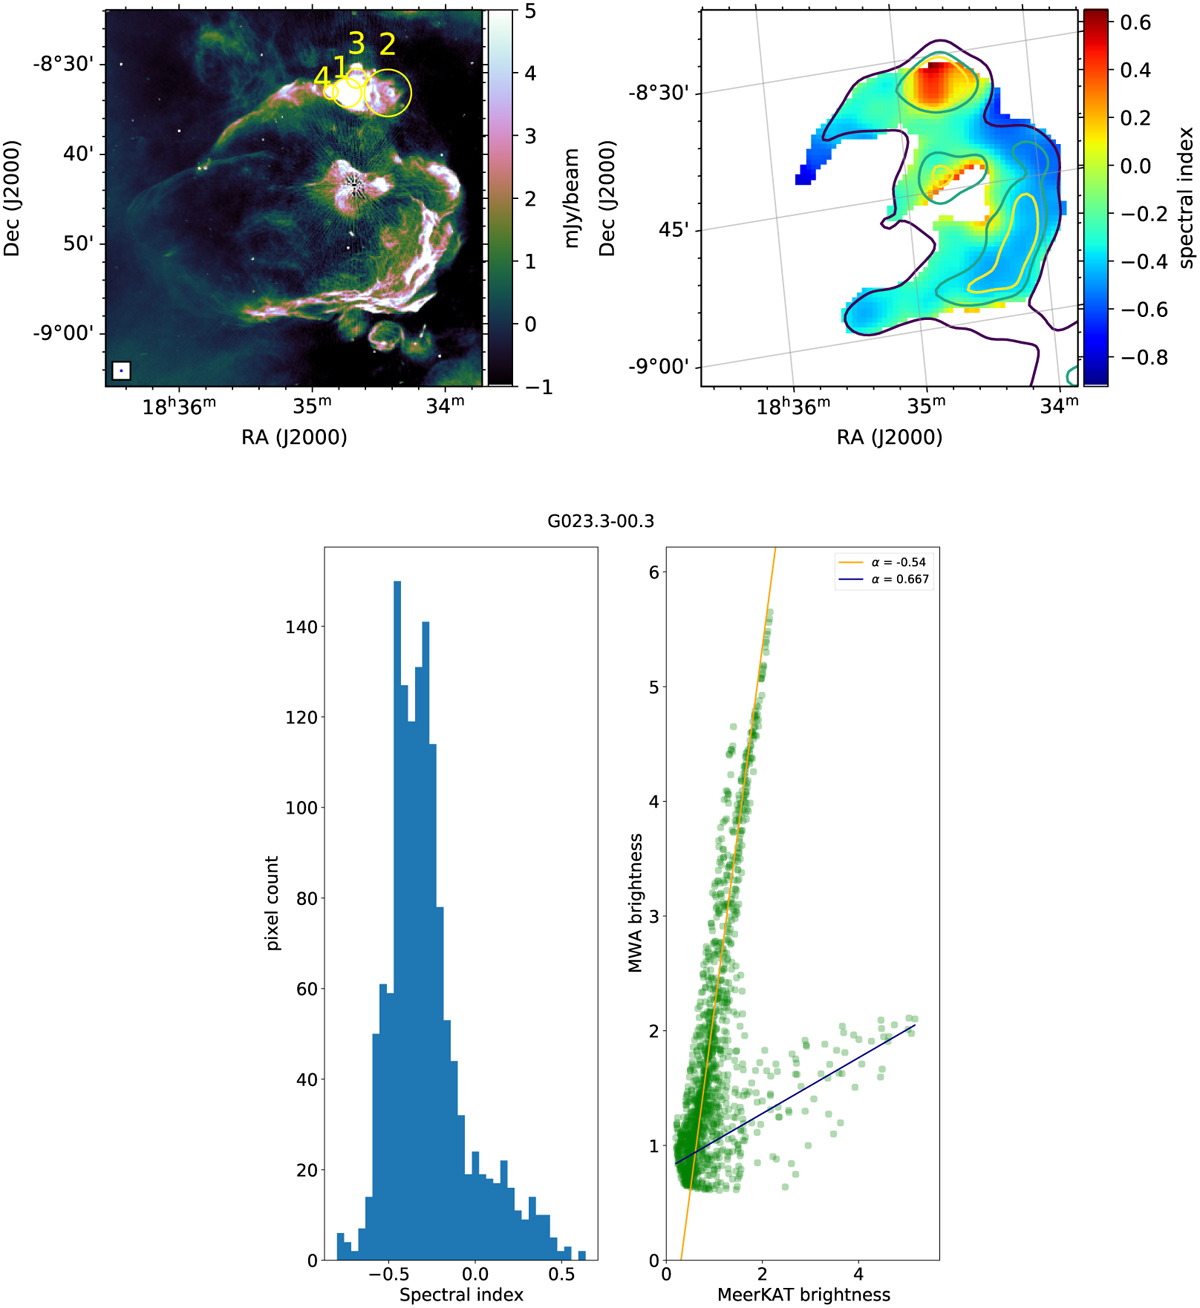
Spatially resolved spectral index study of the SNR G023.3-00.3. Upper left: SMGPS image. The yellow circles indicate the four “known” H II regions overlapping the remnant. Upper right: spectral index map. Bottom: statistical graphs. Brightness is expressed in Jy beam−1.
Current usage metrics show cumulative count of Article Views (full-text article views including HTML views, PDF and ePub downloads, according to the available data) and Abstracts Views on Vision4Press platform.
Data correspond to usage on the plateform after 2015. The current usage metrics is available 48-96 hours after online publication and is updated daily on week days.
Initial download of the metrics may take a while.