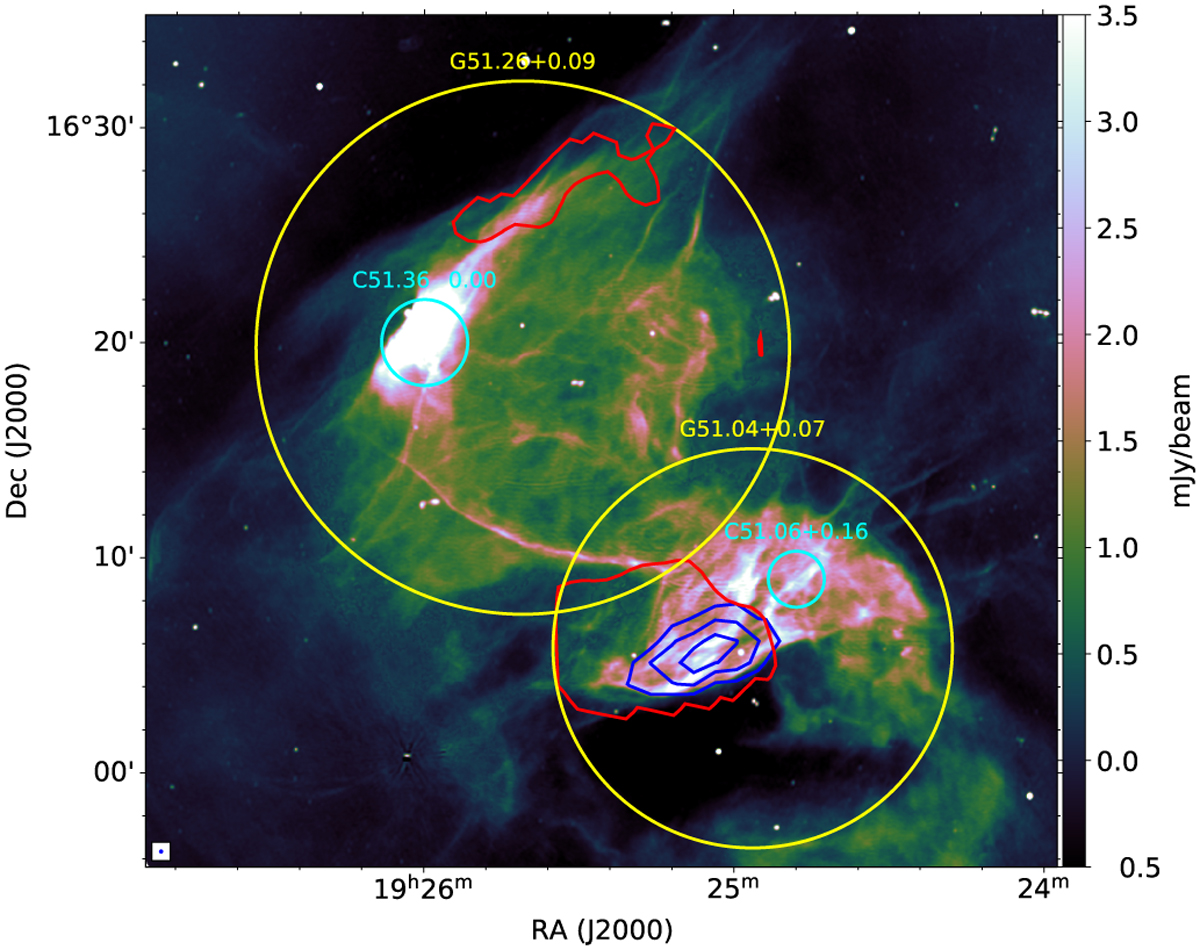
Fig. B.8
Download original image
SMGPS image of the G51.21+0.11 complex at 1.284 GHz. The yellow and cyan circles indicate the SNR and H II region locations, respectively. The red contours show to the regions with a maximum spectral index of −0.2, referring to our 0.155-1.284 GHz spectral index map. The blue contours indicate the non-thermal emission region as obtained by Supan et al. (2018) from VLSSr at 74 MHz (Lane et al. 2014).
Current usage metrics show cumulative count of Article Views (full-text article views including HTML views, PDF and ePub downloads, according to the available data) and Abstracts Views on Vision4Press platform.
Data correspond to usage on the plateform after 2015. The current usage metrics is available 48-96 hours after online publication and is updated daily on week days.
Initial download of the metrics may take a while.