Fig. B.6
Download original image
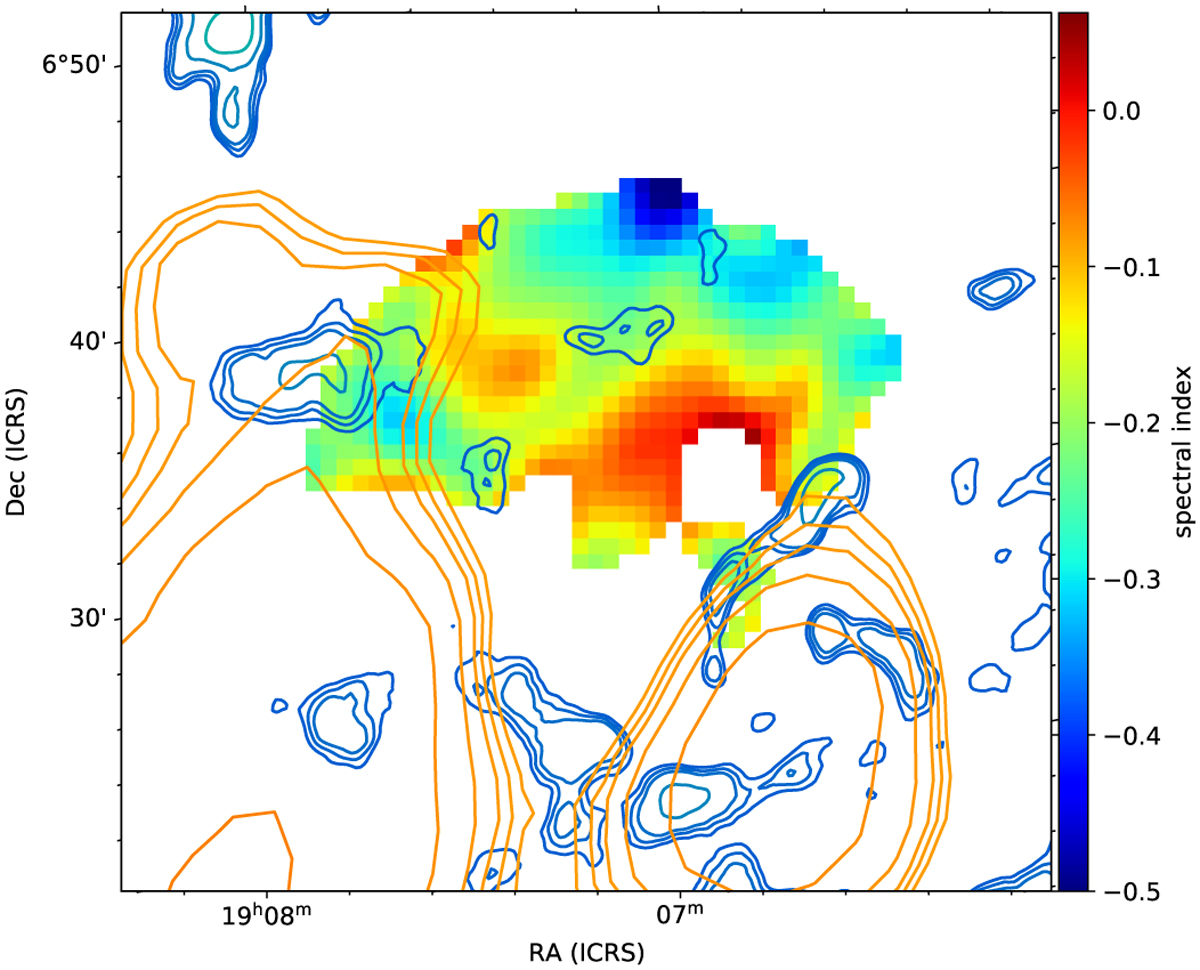
Spectral index map of G040.5-0.5 in the 0.155-1.284 GHz frequency range from SMGPS and GLEAM images with superposed contour levels of the 12 CO (blue lines) and TeV emission from VERITAS (yellow lines). The 12CO emission is integrated on the −100 − 200 km s−1 velocity interval and the contours correspond to the temperature levels at 4.6, 5.06, 5.52, 6.9, 9.2, 13.8 K. The TeV contours correspond to the significance levels at 3.65, 3.74, 3.83, 4.02, 4.38, 5.48.
Current usage metrics show cumulative count of Article Views (full-text article views including HTML views, PDF and ePub downloads, according to the available data) and Abstracts Views on Vision4Press platform.
Data correspond to usage on the plateform after 2015. The current usage metrics is available 48-96 hours after online publication and is updated daily on week days.
Initial download of the metrics may take a while.