Fig. B.9
Download original image
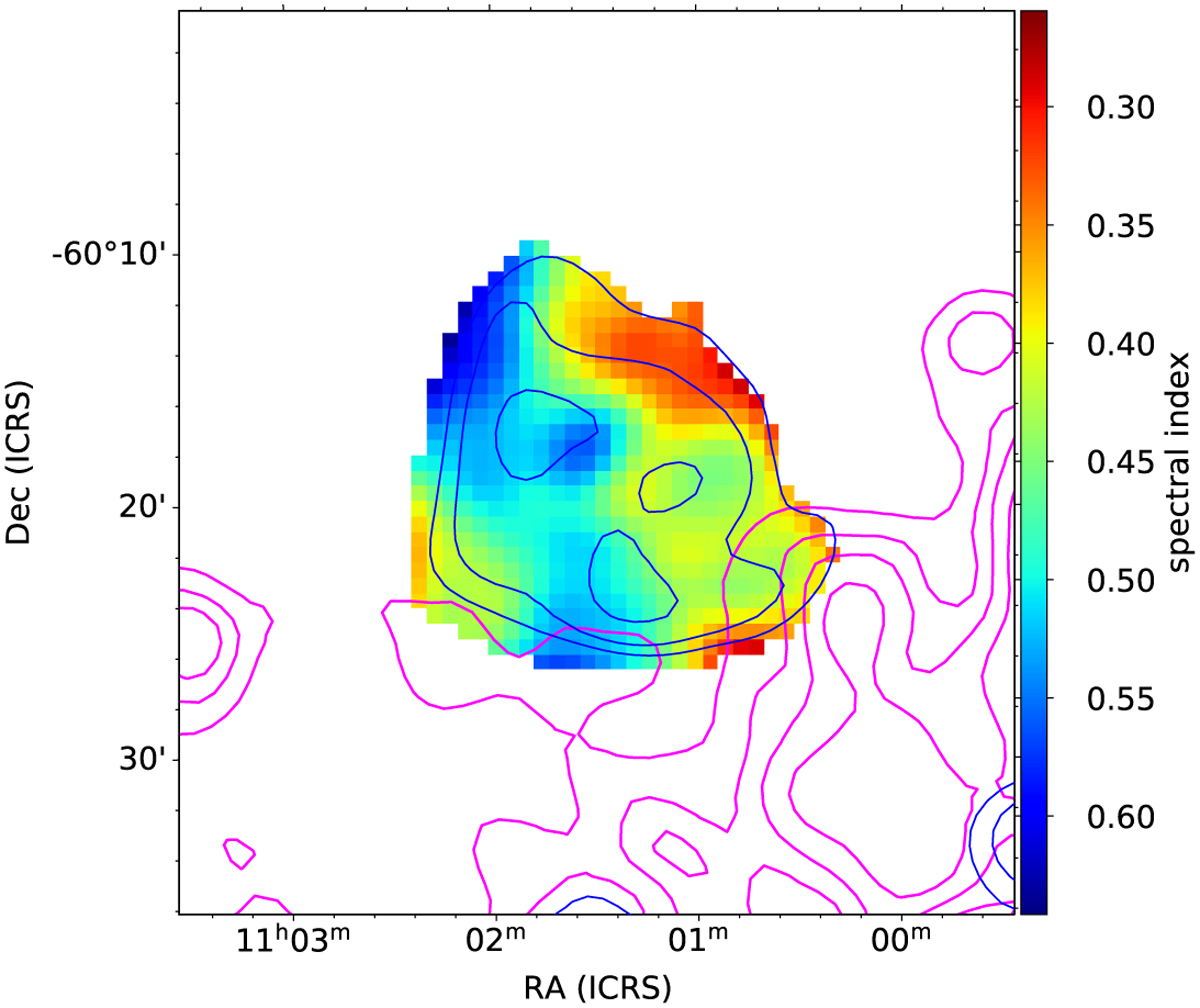
Spectral index map at 0.155-1.284 GHz of the SNR G289.7-0.3. Blue contours indicate the intensity levels at 0.12, 0.17, and 0.27 Jy beam−1 calculated on the SMGPS map convoluted and regridded to the MWA beam and pixel size. Magenta contours are associated with the HI emission detected in the SGPS data at 9607.85, 9838.77, 10011.23, and 10213.95 K.
Current usage metrics show cumulative count of Article Views (full-text article views including HTML views, PDF and ePub downloads, according to the available data) and Abstracts Views on Vision4Press platform.
Data correspond to usage on the plateform after 2015. The current usage metrics is available 48-96 hours after online publication and is updated daily on week days.
Initial download of the metrics may take a while.