Fig. 1
Download original image
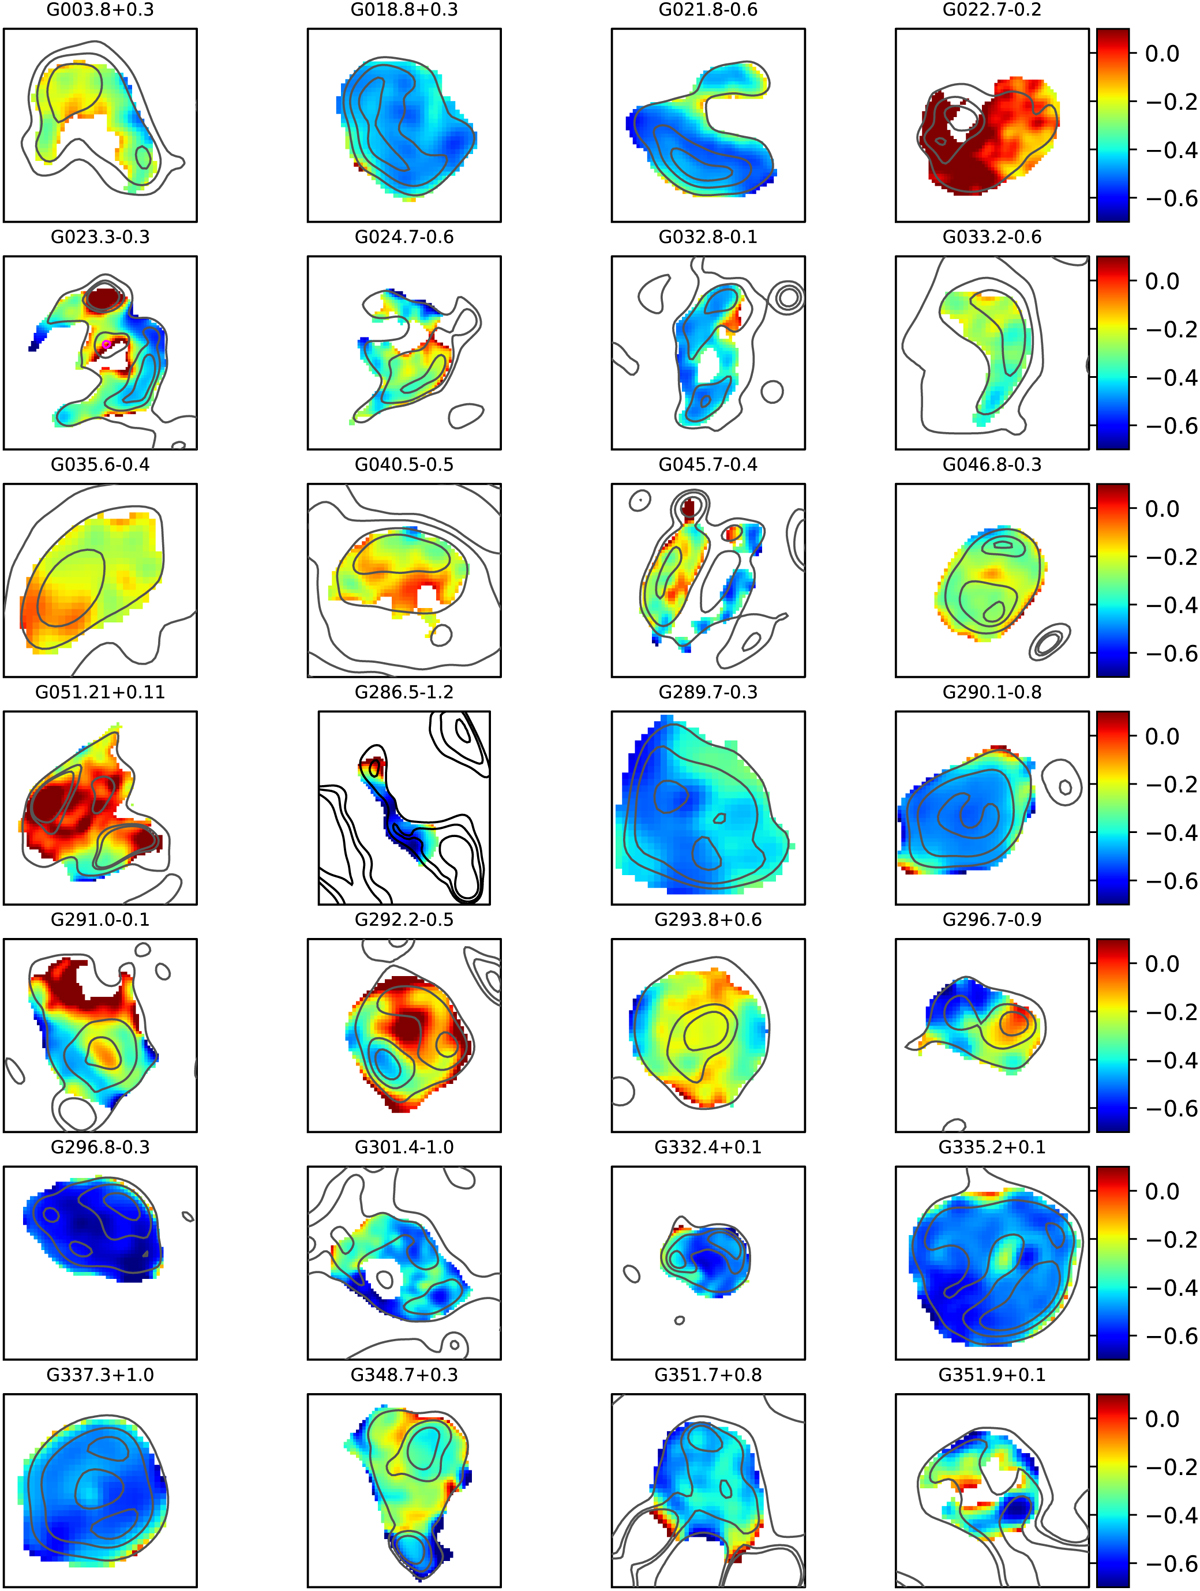
Spectral index maps of the 29 known SNRs investigated in this work. They are obtained from the SMGPS and GLEAM data in the 0.155–1.284 GHz frequency range. The same color scale was used for comparison. The gray contours indicate the intensity levels related to the SMGPS maps convolved and regridded to the GLEAM beam and pixel size. They are the same as those reported in Figs. A1 – A.28.
Current usage metrics show cumulative count of Article Views (full-text article views including HTML views, PDF and ePub downloads, according to the available data) and Abstracts Views on Vision4Press platform.
Data correspond to usage on the plateform after 2015. The current usage metrics is available 48-96 hours after online publication and is updated daily on week days.
Initial download of the metrics may take a while.