Fig. B.1
Download original image
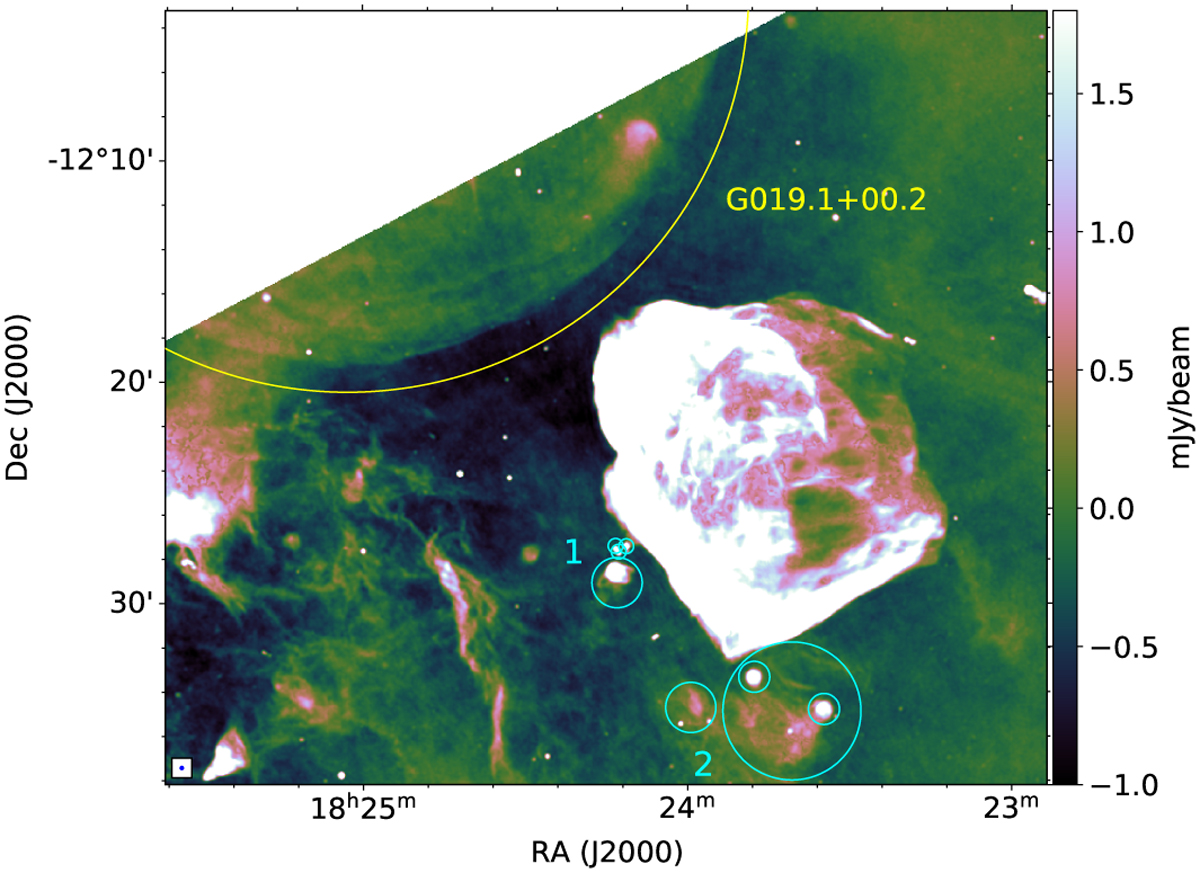
SMGPS image at 1.284 GHz of G018.8+0.3. We chose the color scale to emphasize the emission from the nearby SNR and H II regions. The cyan circles labeled with the number 1 refer to the H II regions G018.762+00.270, G018.766+00.262, G018.761+00.262, G018.741+00.250, while those tagged with the number 2 indicate the H II regions G018.594+00.321, G018.632+00.256, G018.630+00.309, G018.584+00.344 (Anderson et al. 2014). The SNR G019.1+00.2 is indicated with the yellow circle.
Current usage metrics show cumulative count of Article Views (full-text article views including HTML views, PDF and ePub downloads, according to the available data) and Abstracts Views on Vision4Press platform.
Data correspond to usage on the plateform after 2015. The current usage metrics is available 48-96 hours after online publication and is updated daily on week days.
Initial download of the metrics may take a while.