| Issue |
A&A
Volume 691, November 2024
|
|
|---|---|---|
| Article Number | A90 | |
| Number of page(s) | 15 | |
| Section | Extragalactic astronomy | |
| DOI | https://doi.org/10.1051/0004-6361/202451048 | |
| Published online | 31 October 2024 | |
SN 2021wuf: A transitional type Ia supernova with a low-velocity gradient
1
Center for Astronomy and Space Sciences, China Three Gorges University, Yichang 443000, People’s Republic of China
2
College of Science, China Three Gorges University, Yichang 443000, People’s Republic of China
3
Beijing Planetarium, Beijing Academy of Science of Technology, Beijing 100044, People’s Republic of China
4
Physics Department and Tsinghua Center for Astrophysics (THCA), Tsinghua University, Beijing 100084, People’s Republic of China
5
Department of Physics, University of California, Santa Barbara, CA 93106-9530, USA
6
Las Cumbres Observatory, 6740 Cortona Drive, Suite 102, Goleta, CA 93117-5575, USA
7
Xinjiang Astronomical Observatory, Chinese Academy of Sciences, Urumqi, Xinjiang 830011, People’s Republic of China
8
School of Astronomy and Space Science, University of Chinese Academy of Sciences, Beijing 100049, People’s Republic of China
9
Yunnan Observatories (YNAO), Chinese Academy of Sciences, Kunming 650216, People’s Republic of China
10
Key Laboratory for the Structure and Evolution of Celestial Objects, Chinese Academy of Sciences, Kunming 650216, People’s Republic of China
11
Center for Astronomical Mega-Science, Chinese Academy of Sciences, 20A Datun Road, Chaoyang District, Beijing 100012, People’s Republic of China
12
Key Laboratory of Optical Astronomy, National Astronomical Observatories, Chinese Academy of Sciences, Beijing 100012, People’s Republic of China
13
George P. and Cynthia Woods Mitchell Institute for Fundamental Physics & Astronomy, Texas A&M University, Department of Physics and Astronomy, 4242 TAMU, College Station, TX 77843, USA
14
Shanghai Key Lab for Astrophysics, Shanghai Normal University, Shanghai 200234, People’s Republic of China
⋆ Corresponding authors; This email address is being protected from spambots. You need JavaScript enabled to view it.
, This email address is being protected from spambots. You need JavaScript enabled to view it.
Received:
10
June
2024
Accepted:
30
August
2024
Abstract
In this paper, we present an extensive analysis of SN 2021 wuf, a transition between Ia-norm and SN 1991T-like supernovae, which exploded at the periphery of the tidal bridge between the pair galaxy NGC 6500 and NGC 6501, at a redshift of z = 0.01. Our observations, ranging from −21 to +276 days relative to the B-band maximum light, reveal that SN 2021wuf exhibits properties akin to normal SNe Ia, with a peak absolute magnitude of Mmax(B) ∼ − 19.49 ± 0.10 mag and a post-peak decline rate of Δm15(B) ∼ 1.11 ± 0.06 mag. The peak bolometric luminosity of this SN is estimated as 1.58 × 1043 erg s−1, corresponding to a 56Ni mass of MNi ∼ 0.64 ± 0.05 M⊙. The spectral features, including high-velocity Si IIλ6355 lines, a plateau in the Si IIλ6355 velocity evolution and the nickel-to-iron ratio in the nebular phase, suggest a potential pulsating delayed detonation mechanism. The absence of intermediate-mass elements in the early phase and the high photospheric temperature, as inferred from the line-strength ratio of Si IIλ5972 to Si IIλ6355 (named as R(Si II)), further support this classification.
Key words: supernovae: individual: SN 2021wuf
© The Authors 2024
 Open Access article, published by EDP Sciences, under the terms of the Creative Commons Attribution License (https://creativecommons.org/licenses/by/4.0), which permits unrestricted use, distribution, and reproduction in any medium, provided the original work is properly cited.
This article is published in open access under the Subscribe to Open model. This email address is being protected from spambots. You need JavaScript enabled to view it. to support open access publication.
1. Introduction
It is widely assumed that type Ia supernovae (SNe Ia) result from explosions of carbon–oxygen (CO) white dwarfs (WDs) in binary systems (Nomoto et al. 1997; Hillebrandt et al. 2000; Maoz et al. 2014; Livio & Mazzali 2018; Soker 2019). SNe Ia are viewed as the best distance indicator, whose observations result in the discovery of an accelerating Universe (Riess et al. 1998; Perlmutter et al. 1999). The nature of the companion stars in Type Ia supernovae (SNe Ia) remains a topic of debate, with two popular scenarios being considered. The first is the double-degenerate scenario (DD), which involves the violent merger explosion of two carbon-oxygen white dwarfs (CO WDs) (Iben & Tutukov 1984; Webbink 1984; Sato et al. 2015). The second is the single-degenerate scenario (SD; Whelan & Iben 1973; Nomoto et al. 1984; Podsiadlowski et al. 2008), where the explosion is triggered by accretion from a nondegenerate companion. Based on previous studies, the companion star in the progenitor system of type Ia supernova could also be a white dwarf, which favors the DD scenario (González Hernández et al. 2012; Schaefer & Pagnotta 2012; Olling et al. 2015; Sato et al. 2015; Tucker et al. 2019). However, the SD scenario for at least a portion of SNe Ia is supported by possible detections of circumstellar material (CSM; Hamuy et al. 2003; Wang et al. 2004, 2008, 2019; Aldering et al. 2006; Pastorello et al. 2007a; Blondin et al. 2009; Sternberg et al. 2011; Dilday et al. 2012; Taddia et al. 2012; Silverman et al. 2013b; Bochenek et al. 2018).
Observationally, the strikingly similar photometric and spectroscopic characteristics of most SNe Ia suggest that the residual dispersion can be more effectively interpreted through an empirical correlation linking the width of the light curves or color curves with the luminosity (Suntzeff 1996; Filippenko 1997; Phillips 1993; Tripp 1998; Wang et al. 2005). However, as research progresses, it has become evident that this explanation for the observed diversity is unreliable (Zhang et al. 2014). A significant portion of SNe Ia can be classified as spectroscopically normal, while others are considered peculiar (Filippenko et al. 1992a; Ganeshalingam et al. 2012; Phillips et al. 1992; Silverman et al. 2011). The main subclasses of SNe Ia include: (1) overluminous groups, such as the SN 1991T-like subclass with weak Si II absorption and prominent iron in the near-maximum light spectra (Filippenko et al. 1992b; Phillips et al. 1992); (2) underluminous events such as SN 1991bg, which exhibit strong Si IIλ5972 and ∼4000 Å Ti features (Filippenko et al. 1992a; Benetti et al. 2005); (3) peculiar 1999aa-like SNe, which are similar to SN 1991T-like with slight discrepancies in weak features of Ca II H&K and Si absorption before maximum light (Garavini et al. 2004); and (4) SN 2007if-like with super Chandrasekhar mass (Scalzo et al. 2010) and SN 2009dc with extremely high luminosity but relatively low expansion velocity (Silverman et al. 2011). Based on the equivalent width (EW) of the absorption features of Si IIλ5972 and Si IIλ6355, it is suggested to divide the SN Ia samples into four groups (Branch et al. 2006, 2009): cool (CL), shallow silicon (SS), core normal (CN), and broad line (BL). The CL and SS groups mainly consist of peculiar objects like SN 1991bg and SN 1991T, respectively. However, the SS category is not homogeneous, as it encompasses various types of SNe Ia, including those potentially originating from a super-Chandrasekhar mass progenitor, such as SN 2003fg (Jeffery et al. 2006), SN 2006gz (Hicken et al. 2007), SN 2007if (Scalzo et al. 2010), or SN 2009dc (Silverman et al. 2011). Additionally, it includes the luminous 1991T/1999aa-like events, which are characterized by higher ionization lines (Fe III) at the early phase, as well as the narrow-lined events (NL), such as SN 2012fr (Zhang et al. 2014), situated between SN 1991T-like and the normal ones. Furthermore, this category encompasses the spectroscopically normal events (SN 2006S; Blondin et al. 2012) and the faint 2002cx-like SNe Ia (Li et al. 2003; Chornock et al. 2006; McCully et al. 2014; Li et al. 2018). According to Maeda et al. (2010) and Silverman et al. (2013a), the spectral differences are attributed to a geometric viewing-angle effect.
Normal SNe Ia are further classified into three subclasses by Benetti et al. (2005): high velocity gradient (HVG), low velocity gradient (LVG), and FAINT (including faint SNe Ia), based on the temporal velocity gradient of the Si II absorption line. Additionally, Wang et al. (2009a) proposed distinguishing a subclass with a higher Si II velocity (HV) from one with a normal velocity (NV) according to the expansion velocity measured from the Si II absorption lines at B-band maximum brightness. Despite the different criteria used to classify these events, there are overlaps observed in some subclasses. For instance, the SN 1991bg/CL subclass appears to align with the FAINT subclass identified by Benetti et al. (2005). Furthermore, the HV subclass overlaps with the HVG and BL subclass (Blondin et al. 2012; Silverman et al. 2012). Gaining a better understanding of the properties of SNe Ia could help standardize these events more effectively. Previous studies have shown that the birthplace environments could cause different observational properties (Wang et al. 2013). HV SNe Ia are more associated with metal-rich progenitors (Pan et al. 2015; Pan 2020), with more circumstellar matter (CSM) than NV SNe Ia (Wang et al. 2019). This challenges the notion that all SNe Ia stem from a single family or a unified explosion mechanism, even without considering peculiar subclasses of SNe Ia (Liu et al. 2023).
The spectral features at the early phase play a crucial role in constraining the explosion physics of SNe Ia. Through modeling a series of early spectra, Mazzali et al. (1995) found that the absence of intermediate-mass elements (IMEs), such as Si, S, Mg, and Ca, and the presence of strong Fe III lines are attributed to the low abundance of IMEs and the high ionization caused by the high luminosity, which may also be related to the explosion temperature. Moreover, the nebular velocities together with the Ni/Fe ratios (including SN 2021wuf) could be related to the explosion model of SNe Ia (Maguire et al. 2018; Liu et al. 2023).
Therefore, the rapidly expanding type Ia supernova SN 2021wuf with shallow silicon and low velocity gradients merits a more detailed analysis. The present study has been made possible thanks to extensive and timely observational data, which is essential for discerning the physical mechanisms underlying its photometric and spectrascopic evolution. Section 2 details the observations and data reduction. Section 3 discusses the light and color curves, followed by Sect. 4, which presents the analysis of the spectroscopic behavior of SN 2021wuf and its temporal evolution. The properties of SN 2021wuf and its explosion parameters are then discussed in Sect. 5, with a summary provided in Sect. 6.
2. Observations and data reduction
2.1. Discovery
The young type Ia supernova SN 2021wuf was discovered with the use of a robotic survey system, comprising twin 0.5 m telescopes situated on Haleakala and Mauna Loa. This system conducts observations of the sky above declination −40 every 2 days as part of the Asteroid Terrestrial-impact Last Alert System (ATLAS; Tonry et al. 2018; Smith et al. 2020) project. The supernova was first detected on August 23, 2021 at 08:55:40.8000 UT (MJD = 59449.872), with its coordinates recorded as α = 17h56m02s.513, δ = +18 ° 21′14″.08 (J2000, Srivastav et al. 2021). The explosion location of SN 2021wuf is similar to that of SN 2005cf (Wang et al. 2009b), occurring in the vicinity of the tidal bridge connecting the lenticular galaxy NGC 6500 and spiral galaxy NGC 6501, and both of which have a redshift of z = 0.01, as depicted in Fig. 1. Assuming a Hubble constant (H0) of 72.9 km s−1 (Liu & Liao 2024), the distance modulus of NGC 6500 is μ = 33.17 ± 0.15 mag, corresponding to a distance of 43.10 ± 3.02 Mpc (Fixsen et al. 1996). For NGC 6501, the distance modulus is μ = 33.22 ± 0.15 mag, corresponding to a distance of 44.06 ± 3.09 Mpc (Fixsen et al. 1996).
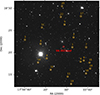 |
Fig. 1. Observation of SN 2021wuf taken by LCO. Reference stars are marked with orange circles. |
2.2. Photometry observation
The one-meter telescopes of the Las Cumbers Observatory (LCO) network (Brown et al. 2010, 2013) for the Global Supernova Project (Howell & Global Supernova Project 2017) conducted detailed photometric observations of SN 2021wuf, covering six bands including UBVgri, with observations taken nearly daily from −16 days to +276 days. The routine observation image from LCO is shown in Fig. 1, where the red circle indicates SN 2021wuf, and the orange circles represent the photometric standard stars. The observations of SN 2021wuf were processed using the lcogtsnpipe, which is a PyRAF-based pipeline (Valenti et al. 2016). The UBV-band photometry is presented in Vega magnitudes and was transformed into the Johnson system using a set of Landolt standard stars observed on the same night (Stetson 2000). The gri-band photometry is reported in AB magnitudes, and the zero points for the Sloan filters were calculated based on the magnitudes of stars in the SN field using the Panoramic Survey Telescope and Rapid Response System (PanSTARRS) catalog (Chambers et al. 2016; Waters et al. 2020). Furthermore, observations from the Asteroid Terrestrial-impact Last Alert System (ATLAS; Tonry et al. 2018; Smith et al. 2020) survey were utilized, with linear transformation applied to align the o-band data with the r-band data in the Sloan photometric system. All detailed standards are listed in Table 1.
Photometric standards in the SN 2021wuf field.
2.3. Spectroscopy observation
The ten low-resolution optical spectra of SN 2021wuf were acquired using the FLOYDS spectrographs installed on both the two-meter Faulkes Telescope North and South of LCO Global Supernova Project (Sand et al. 2011; Brown et al. 2013; Howell & Global Supernova Project 2017), covering wavelengths from approximately ∼3300 Å to ∼10 000 Å, as shown in Fig. 2. In addition, an early-time spectrum was obtained from the Transient Name Server (TNS) (Huber 2021), and is also included in Fig. 2. Standard IRAF routines (Tody 1993, 1986) were employed to process the spectra. The spectral flux of SN 2021wuf was calibrated using standard stars observed at similar airmasses on the same night. Extinction curves specific to LCO were applied to correct for atmospheric extinction and remove telluric absorption lines from the spectra. The journal of spectroscopic observations is presented in Table 2.
 |
Fig. 2. Optical spectral evolution of SN 2021wuf is presented in this study. All the spectra have been corrected for the redshift of the host galaxy and reddening. The spectral series of SN 2021wuf was obtained by LCO (depicted in blue) and TNS (depicted in orange), spanning the phases from −11 to +51.9 days. The epochs marked on the right side of the spectra represent the phases in days relative to the B-band maximum. Additionally, the vertical dashed lines indicate the absorption minima of the Si IIλ6355 absorption lines in the spectra of SN 2021wuf taken at t = +1.14 days. |
Spectroscopic observations of SN 2021wuf.
3. Photometry
3.1. Optical light curves
Figure 3 represents the optical light curves of SN 2021wuf sampled from about −21 to +276 days relative to the B-band maximum light. Detailed information is listed in Table 3. The r-band observations, shown as shallow pink stars, are calibrated from o-band observations of ATLAS. Similarly to other normal SNe Ia, the light curves of SN 2021wuf exhibits a prominent shoulder and secondary peak in the r-bands and the i-band light curves, with the first peak appearing approximately two days earlier than the B-band peak. SNooPy2 (SuperNovea in object-oriented Python, Burns et al. 2011, 2014) fittings were applied to the multi-band light curves of SN 2021wuf, estimating a B-band peak magnitude of 13.67 ± 0.03 mag on MJD 59462.27 ± 0.36. The post-peak magnitude decline in 15 days from the B-band peak, Δm15(B) (Phillips et al. 1999), is estimated as 1.11 ± 0.06 mag, and the corresponding stretch factor, SBV(Burns et al. 2011, 2014), is 0.93 ± 0.03. These associated parameters are presented in Table 4.
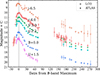 |
Fig. 3. Optical light curves of SN 2021wuf obtained by ATLAS (marked with star) and LCO (marked with circle). The vertical dashed line indicates the B-band maximum and the light curves have been shifted vertically for clarity. |
Optical photometric observations of SN 2021wuf obtained from LCO telescopes.
Measured parameters of SN 2021wuf.
To further study the properties of SN 2021wuf, we conducted a comparison of its optical light curves with those of several other well-observed SNe Ia showing similarities. The comparison samples include SN 1999aa (Δm15(B) = 0.85 mag; Jha 2002), SN 2002bo (Δm15(B) = 1.13 mag; Benetti et al. 2004), SN 2005cf (Δm15(B) = 1.12 mag; Pastorello et al. 2007b; Wang et al. 2009b), SN 2011fe (Δm15(B) = 1.10 mag; Pereira et al. 2013; Zhang et al. 2016), SN 2012fr (Δm15(B) = 0.78 mag; Zhang et al. 2014), SN 2017fgc (Δm15(B) = 1.05 mag; Zeng et al. 2021), and SN 2018oh (Δm15(B) = 0.96 mag; Li et al. 2019), as shown in Fig. 4. According to Fig. 4, the post maximum light, especially in the process of multi-band light curves evolution in the late stage, the compared supernovae are slightly brighter than SN 2021wuf at the similar phase, particularly in the UVgri bands. This phenomenon could suggest that the energy provided by the radioactive decay of 56Ni may not be sufficient to reach such a high brightness for SN 2021wuf. Nevertheless, the prominent r-band and i-band secondary peaks observed in SN 2021wuf could potentially be attributed to the emission of iron group elements from high excitation transitions subsequent to the recombination of doubly ionized elements into singly ionized states, a phenomenon commonly observed in luminous SNe Ia (Jack et al. 2015; Smitka et al. 2015; Zhang et al. 2014).
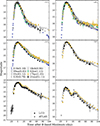 |
Fig. 4. Comparison of the optical light curves (in the UBVgri bands) of SN 2021wuf with those of other well-observed SNe Ia. The light curves of the comparison SNe Ia have been normalized to match the peak magnitudes of SN 2021wuf. |
3.2. Reddening and color curves
Assuming the extinction law RV = 3.1 (Cardelli et al. 1989) and the Galactic reddening of E(B − V)gal = 0.08 mag for SN 2021wuf, the line-of-sight Galactic extinction (AB) of SN 2021wuf can be calculated as 0.328 mag (Schlafly & Finkbeiner 2011). After correcting for the Galactic reddening, the B − V color is found to be −0.11 ± 0.02 mag at the maximum light, which suggests that SN 2021wuf may have higher luminosity, photospheric temperatures and/or expansion velocities compared to normal Type Ia supernovae (Phillips et al. 1999; Blondin et al. 2006; Wang et al. 2009a).
Figure 5 displays the multi-band light curves model fitting results of SN 2021wuf using SNooPy2. The EBV model with st-type was employed to estimate an average host reddening of E(B − V)host = −0.05 ± 0.06 mag for SN 2021wuf. The negligible reddening derived for SN 2021wuf from the host galaxy is coupled with the absence of Na ID absorption lines in its spectrum and coincides with the fact that SN 2021wuf exploded in a region far from the galaxy.
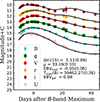 |
Fig. 5. Best-fit light curve model (solid black lines) from SNooPy2 for SN 2021wuf. The dashed black lines indicate the 1-σ uncertainty (in many cases smaller than the line width) with respect to the best-fit light curve templates and the light curves have been shifted vertically for clarity. |
As shown in Fig. 6, the optical color evolution of SN 2021wuf is depicted, alongside several well-observed events: SN 1999aa (Jha 2002), SN 2002bo (Benetti et al. 2004), SN 2011fe (Pereira et al. 2013; Zhang et al. 2016), SN 2012fr (Zhang et al. 2014), SN 2017fgc (Zeng et al. 2021), and SN 2018oh (Li et al. 2019). The color curves have been corrected for reddening caused by the Milky Way and their respective host galaxies (Schlafly & Finkbeiner 2011). It can be seen from the color curves that SN 2021wuf reached its maximum reddest approximately 6 days earlier than the other events. Initially, both the B − V and g − r color curves exhibited the bluest color as they transitioned toward red at around t ≈ −5 days from the peak luminosity. Subsequently, they steadily transitioned to a redder hue in a linear fashion until reaching the maximum reddest at t ≈ +28 days. In addition, the r − i and g − i color curves displayed a shift toward bluer colors from t ≈ −9 to +11 days, followed by a return to the red side and the attainment of peak reddest at t ≈ +27 days. Then, as SN 2021wuf entered the early nebular phase, the color curves progressively shifted toward the blue end. The color curves of SN 2021wuf, on average, appear predominantly redder during the early phase compared to other events, while also exhibiting a distinct shape in the g − r color curve around the B-band maximum.
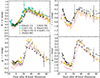 |
Fig. 6. B − V, r − i, g − r, and g − i color curves of SN 2021wuf are compared with those of SNe 1999aa, 2002bo, 2011fe, 2012fr, 2017fgc, and 2018oh. All color curves, including those of SN 2021wuf, have been dereddened using SNooPy2. |
3.3. Distance and quasi-bolometric light curve
Assuming H0 = 72.9 km s−1, ΩM = 0.308, ΩV = 0.692, and identifying NGC 6500 as the host galaxy of SN 2021wuf, we obtained a Tully-Fisher distance for SN 2021wuf of μ = 33.17 ± 0.15 mag based on Tully et al. (2013). Furthermore, employing SNooPy2 to fit the multiband light curves of SN 2021wuf, we derived an average distance modulus of μ = 33.16 ± 0.10 mag for SN 2021wuf (see Fig. 5). This distance modulus is consistent with the previous result and falls within the quoted error. In this study, we adopted the weighted mean distance modulus of μ = 33.16 ± 0.10 mag for SN 2021wuf. Using this weighted mean distance modulus, the B-band absolute peak magnitude of SN 2021wuf was determined as Mmax(B) = −19.49 ± 0.10 mag, which aligns well with those of highly luminous SNe Ia (such as SN 2012fr; Mmax(B) ≈ −19.50 mag; Zhang et al. 2014).
The empirical width-luminosity relation proposed by Phillips (1993) suggests that supernovae with wider light curves are typically brighter (Phillips et al. 1999). Furthermore, Kasen & Woosley (2007) found that brighter Type Ia supernovae tend to have broader and more slowly declining light curves in the B-band. However, SN 2021wuf does not conform to this trend. In general, it would be valuable to investigate in the future whether the relatively faster average value of Δm15(B) = 1.11 ± 0.06 mag for SN 2021wuf could be associated with its luminosity.
The establishment of quasi-bolometric light curves for SN 2021wuf was based on optical photometry and spectral energy distribution (SED) in various bands, including the U, B, V, g, r, and i bands. The quasi-bolometric light curve of SN 2021wuf was constructed by assuming that its near-infrared (NIR) and ultraviolet (UV) emissions have a similar contribution to what is seen for the case of SN 2011fe (Zhang et al. 2016). A comparison with the light curves of SN 2005cf (Pastorello et al. 2007b; Wang et al. 2009b) and SN 2011fe (Zhang et al. 2016) is illustrated in Fig. 7. The early phase evolution of the quasi-bolometric light curve of SN 2021wuf closely resembles that of SN 2005cf, as shown in Fig. 7. The peak luminosity of SN 2021wuf is estimated as Lpeak = 1.58 × 1043 erg s−1, which is notably higher than that of SN 2011fe (Lpeak = 1.13 × 1043 erg s−1; Zhang et al. 2016). The optical photometry was interpolated using spline interpolation (Ahlberg et al. 1967; Leloudas et al. 2009; Li et al. 2019) to fill in missing data when necessary. The quasi-bolometric flux was determined by trapezoidal integration over flux densities at different wavebands, covering phases from -12.64 to +270.34 days for SN 2021wuf. The Minim Code, based on the radiation diffusion model from Arnett law (Arnett 1982; Chatzopoulos et al. 2012; Li et al. 2019; Zeng et al. 2021), was utilized to estimate the nickel mass and other parameters. The relevant results are displayed in Fig. 8.
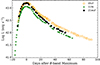 |
Fig. 7. Quasi-bolometric light curve of SN 2021wuf compared to that of SN 2005cf and SN 2011fe. |
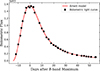 |
Fig. 8. Quasi-bolometric (UV and optical) light curves for SN 2021wuf compared to the best-fitting radiation diffusion model (Arnett 1982). |
The fitting parameters (Chatzopoulos et al. 2012) are the first light time, t0 = −14.34 ± 0.05 (MJD = 59447.90 ± 0.40), the light-curve time-scale, tlc = 11.88 ± 0.02 d, and the gamma-ray leaking time-scale, tγ = 31.83 ± 0.43 d. With the derived bolometric luminosity, the synthesized 56Ni mass can be estimated using the Arnett law (Arnett 1982):
 (1)
(1)
where tr is the rise time of the bolometric light curve and MNi is the 56Ni mass in solar masses, M⊙. We determined the mass of the radioactive nickel to be MNi = 0.64 ± 0.05 M⊙ by applying Eq. (1), also presented in Table 4.
Following the method used by Li et al. (2019), we estimated the average opacity, κ, to be 0.16 ± 0.04 cm2 g−1. Using the best-fit tlc and tγ, we then obtained the ejecta mass and kinetic energy as Mej = 0.91 ± 0.03 M⊙ and Ekin = (0.94 ± 0.01) × 1051 erg.
4. Optical spectra
In Fig. 2, the early-time spectra of SN 2021wuf display a composition of shallow intermediate-mass elements (IMEs) and iron-group elements (IGEs), including Ca II H&K, Fe IIλ4404, 5018, Mg IIλ4481, Si IIλ5051, Fe IIIλ5129, S IIλλ5468, 5654, Si IIλ6355, and the Ca II NIR triplet. As shown in Fig. 2, it is evident that the Si IIλ6355 absorption line is slightly more prominent than the Ca and Fe group elements. Notably, the conspicuous absence of IMEs features prior to maximum light and their subsequent development days after maximum light exhibit characteristics reminiscent of 1991T-like and 1999aa-like objects (Filippenko et al. 1992b; Garavini et al. 2004). The peculiar 1991T-like SNe subclassification is characterized by overluminous, slowly declining light curves, weak or no Ca II and Si II absorption at epochs earlier than ≈1 week, and strong Fe III absorption Filippenko et al. (1992b); Phillips et al. (1992). In comparison, the peculiar 1999aa-like SNe classification shares similarities with the 1991T-like subclass with the subtle differences of weak signatures of Ca II H&K and Si II absorption prior to maximum light (Garavini et al. 2004). However, the Fe absorption is almost negligible in the spectra of SN 2021wuf. Additionally, this spectral sequence may offer insights to probe the temperature and abundance of outer layers, as a combination of high photospheric temperature and low abundance of light elements in the ejecta may lead to fewer IMEs (Mazzali et al. 1995; Sasdelli et al. 2014).
The spectra of SN 2021wuf exhibit “W-shaped” S II absorption features near 5400 Å and Si IIλ5972 near 5800 Å approximately one week before maximum light. Notable blended absorption lines of Fe IIIλ5129, Fe IIλλλ4924,5018,5169, and Si IIλ5051, as well as the blended absorption lines of Fe IIλ4404, Mg IIλ4481 and Ca II H&K, are also observed. Additionally, strong absorption features at 6000–6300 Å are observed, possibly due to the largely blueshifted Si IIλ6355. As the maximum brightness was approached, the spectral evolution of SN 2021wuf generally aligns with that of normal SNe Ia, albeit displaying narrower and weaker absorption features of Si IIλ6355. The absorption line of Ca II NIR triplet begins to show up slowly. At the maximum light, the spectra continue to be dominated by the “W-shaped” S II absorption features and distinct absorption lines of Ca II NIR and Si IIλ6355. At approximately ten days after reaching maximum brightness, the distinct “W-shaped” S II absorption line weakens, while the features of Si IIλ6355 and the Ca II NIR triplet remain prominent. Around one month post maximum brightness, the dominant spectral features continue to be the Ca II NIR triplet and Ca II H&K absorption lines. The emission features from iron-group elements begin to emerge as the spectra enter the early nebular phase.
4.1. Temporal evolution of the optical spectra
Figure 9 presents a comparison between SN 2021wuf and several well-observed normal and peculiar events at different epochs. The comparison samples were chosen based on their comprehensive observations or similarities to SN 2021wuf, including SNe 1991T (Lira et al. 1998), 1999aa (Jha 2002), 2011fe (Zhang et al. 2016) and 2012fr (Zhang et al. 2014). The early spectra obtained at t ≤ −10 days are depicted in Fig. 9(a). During this phase, the dominant features, whether they are IGEs or IMEs of SN 2021wuf, exhibit minimal absorption. The EW of Si IIλ6355 absorption line in spectra of SNe 2011fe, 2021wuf, 1999aa, 2012fr, and 1991T were measured as 96.20 Å, 18.30 Å, 18.14 Å, 25.70 Å, and 15.10 Å, respectively. In general, normal type Ia supernovae have higher Si IIλ6355 absorption intensity (e.g., SN 2011fe), while brighter type Ia supernovae usually have weaker Si IIλ6355 absorption intensity (e.g., SNe 1999aa, 1991T). In comparison, SN 2021wuf and SN 2012fr are similar to the brighter type Ia supernovae and have a weaker Si IIλ6355 absorption intensity. In the early spectrum, SN 2021wuf is located between peculiar events and tends to show significant similarities to SN 1991T with almost absent IMEs, which is a key characteristic of the SN 1991T-like subclass (Filippenko et al. 1992b; Phillips et al. 1992). The weak IMEs strength suggests a relatively high temperature for the photosphere compared to normal Type Ia supernovae (Mazzali et al. 1995), consistent with the analysis above. This is likely caused by the high luminosity of SN 2021wuf, possibly a direct consequence of the overproduction of 56Ni (Mazzali et al. 1995). However, SN 199T exhibits noticeable absorption of iron-group elements, whereas SN 2021wuf does not.
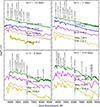 |
Fig. 9. Spectra of SN 2021wuf at t ≈ −12, −7, 0 and +10 days after the B-band maximum. The comparable phase spectra of SN 1991T (Lira et al. 1998), SN 1999aa (Jha 2002), SN 2011fe (Zhang et al. 2016), and SN 2012fr (Zhang et al. 2014) are verplotted. |
Figure 9(b) presents the comparison at one week prior to the maximum light. All spectra exhibit an increase in the absorption strength of IMEs. However, the absorption in SN 2021wuf is still not as strong as that in normal events like SN 2011fe and is consistent with SN 1991T. With regard to the absorption features of Fe group elements, the blended Fe IIλ4404 and Mg IIλ4481 in SN 2021wuf begin to emerge. Conversely, the Ca II NIR triplet and Ca II H&K absorption features are weaker in all spectra at this phase and the Ca II NIR triplet absorption of SN 2021wuf is weaker than that of the others.
The spectral evolution around the B-band maximum is depicted in Fig. 9(c). At this phase, the spectrum most similar to SN 2021wuf is that of SN 1999aa. In both events, the absorption features of Si IIλ6355 become more dominant and S II lines become noticeable. However, they are still weaker than in the normal events. The line-strength ratio of Si IIλ5972 to Si IIλ6355, known as R(Si II) (Nugent et al. 1997), is an approximate indicator of the photospheric temperature, with a larger value corresponding to a lower temperature. We measured this parameter to be 0.025 ± 0.005 for SN 2021wuf near the maximum light, which is noticeably smaller than the corresponding value for the standard SN 2011fe, suggesting a higher photospheric temperature for SN 2021wuf. Furthermore, the blended Fe IIλ4404 and Mg IIλ4481 in SN 2021wuf are notably stronger than before, while the absorptions of the other five comparison SNe are still deeper. The photospheric velocity of SN 2021wuf, measured from the absorption minimum of Si IIλ6355 around the B-band maximum, is v0 = 12 140 ± 370 km s−1. This places it in the HV subclass, according to the classification scheme proposed by Wang et al. (2009a).
Figure 9(d) presents a comparison of the spectra at t ≈ +10 days after the B-band maximum. One notable feature is that the absorption trough of the Ca II NIR feature clearly splits into two components in SN 2021wuf and SN 2012fr. This behavior is consistent with the narrow Si II profiles seen in these two events, suggesting that the ejecta produced from their explosions may be confined to a smaller range of velocity compared to SN 2011fe (Zhang et al. 2014).
4.2. Ejecta velocity
In this subsection, we examine the Si IIλ6355 velocity of SN 2021wuf. The evolution of ejecta velocity measured from Si IIλ6355 for SN 2021wuf is displayed in Fig. 10, in comparison with other well-observed events (e.g., SN 1991T-like, SN 1991bg-like, SN 2011fe, SN 2012fr). Initially, the Si IIλ6355 velocity of this event resembles that of typical Type Ia supernovae, but it shows a plateau until maximum brightness with a very low-velocity gradient. The narrow velocity widths of the absorption profiles in SN 2021wuf have enabled us to unambiguously track the velocity of the Si IIλ6355 line up to very late times, revealing a velocity plateau at ≈12 000 km s−1 lasting about half a month. This places SN 2021wuf into the HV category of SNe Ia in the classification scheme of Wang et al. (2009a). On the other hand, SN 2021wuf can be distinctly placed into the LVG group of the classification system of Benetti et al. (2005) in terms of the low-velocity gradient ( = 2.3 ± 12.6 km s−1 day−1). It is evident that the velocity evolution most similar to SN 2021wuf can be observed in the case of SN 2012fr. Childress et al. (2013) argued that it is more likely that the low-velocity evolution of the Si II lines reflects the physical confinement of these ions to a narrow region in velocity space in the ejecta. Of course, in our study we do not rule out the occurrence of such cases. The reason for the emergence of a velocity plateau during the B-band maximum is what we focus on here and we discuss it in more detail in Sect. 5.3. The basic parameters of this SN are listed in Table 4.
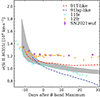 |
Fig. 10. Ejecta velocity evolution of SN 2021wuf is compared with that of SNe 2011fe and 2012fr. The average velocity evolution curves obtained for SN 1991T-like and SN 1991bg-like SNe are overplotted as red and blue dashed lines, respectively. Velocities were measured from the minimum of their Si IIλ6355 absorption lines. The shaded region indicates the 1σ uncertainty of the mean velocity evolution curve for HV SNe Ia as derived from Wang et al. (2009a). Data for the comparison SNe and the region of normal SNe Ia are extracted from Li et al. (2019). |
5. Discussion
5.1. Properties of the light curves
The early observation data in Fig. 3 are zoomed in and displayed in Fig. 11, where the gray area marks the possible early light excess. According to Kasen (2010), the high-temperature component could be attributed to the early flux excess. To determine the possible existence of early flux excess, we analyzed the LCO and ATLAS data collected 30 days post-explosion, applying a consistent t0 across all six photometric bands (UBVgri). The light curves were modeled using the CompanionShocking3 + SiFTO template (Burke et al. 2021; Hosseinzadeh et al. 2022, 2023b) and the fitting was carried out with the lightcurve_fitting package (Hosseinzadeh et al. 2023a). More details are given in Fig. 12.
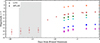 |
Fig. 11. Optical light curves of SN 2021wuf obtained by ATLAS (marked with star) and LCO (marked with circle), which is zoomed in for the early observations in Fig. 3. The gray region highlights the possible excess flux we initially recognized. |
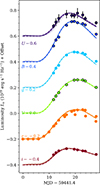 |
Fig. 12. Fitting of the multiband (UBVgri) early light curves of SN 2021wuf. The light curve of SN 2021wuf compared to the model of Kasen (2010), in which the SN ejecta collide with a nondegenerate binary companion. The dashed lines show the “normal” Type Ia component of this model, the SiFTO template from Conley et al. (2008). The solid lines are CompanionShocking3 + SiFTO template model. The dot indicates real observation value. The horizontal axis represents time relative to the explosion, and the vertical axis represents luminosity. |
Our analysis incorporates a two-component model to characterize the early light curves of SN 2021wuf. The base model is a standard Type Ia supernova light curve derived from the SiFTO framework (Kasen 2010; Conley et al. 2008), which is augmented by an additional component representing excess flux due to a companion shocking interaction (Kasen 2010). The possible excess flux could be significant during the early phases of a supernova. The combined CompanionShocking3 and SiFTO template model, as depicted in Fig. 12, was utilized to achieve a robust fit. The fitting procedure encompasses eight parameters: (1) time of explosion, denoted as t0; (2) separation of the binary system in the companion-shocking interaction, represented by a; (3) viewing angle θ, which is crucial for the geometric interpretation of the light curve (Brown et al. 2012); (4) epoch of the B-band maximum light, Tmax(B), for the SiFTO template; (5) stretch factor s applied to the SiFTO template; (6) shift factor ΔtU for the U-band maximum time; (7) shift factor Δti for the i-band maximum time; and (8) a multiplicative factor, σ, which adjusts the data errors to account for potential underestimation. The initial and best-fit values for these parameters are detailed in Table 5. Notably, the model-determined B-band peak time Tmax(B) closely aligns with the SNooPy2 estimation within the reasonable error. Consequently, we adopted the SNooPy2-fitted value MJD 59462.27 ± 0.36 as the definitive one for our study.
Measured CompanionShocking3 parameters of SN 2021wuf.
According to Burke et al. (2022) and Kasen (2010), if type Ia supernovae originate from a white dwarf ignited by Roche lobe overflow from a nondegenerate companion, the supernova explosion encountering the companion star may result in shock-induced ejecta, leading to an early bump and increased luminosity in the light curves. However, Fig. 12 shows that the scatter of the data points around both model curves is significantly larger than the difference between the two models. Within the bounds of uncertainty, the fitting results of the two models are not different, so the early excess flux can be ignored.
The multiband light curves during the rise to peak brightness were instrumental in constraining the radius of the progenitor star, as detailed in Piro et al. (2010), Piro & Nakar (2013), using the estimated explosion time t0 from Nugent et al. (2011). This approach allows for the examination of specific SN Ia progenitor system properties, including luminosity evolution and interactions with a possible companion star, as outlined in Kasen (2010). For SN 2021wuf, the t0 relative to the B-band maximum, derived from the CompanionShocking3 model, is MJD 59441.40 ± 0.40 with a rise time of 20.90 ± 0.50 days, which is earlier than the estimate from the Arnett model (Li et al. 2019). This discrepancy may be attributed to the presence of a ”dark phase,” which is a delay between the supernova explosion and the onset of the radioactivity-powered light curve, which is not accounted for in the Arnett model (Li et al. 2019). However, we note that some studies do suggest that the dark phase could be less than 2 days in duration (Piro & Morozova 2016). The Arnett model’s first light time is later than that inferred from the CompanionShocking3 model. Given the model-dependent uncertainties, we attribute the difference in the estimated first light time to the potential dark phase in SN 2021wuf. Another contributing factor may be the use of early ATLAS o-band data calibrated to the r-band. Since the calculation of the quasi-bolometric light curve necessitates simultaneous multi-band data, the lack of concurrent data in other bands may explain the t0 difference between the two models. Consequently, for our analysis, we adopt −20.90 ± 0.50 (t0 = 59441.40 ± 0.40 day) as the definitive value.
5.2. Classification of SN 2021wuf
Previous studies, such as those by Blondin et al. (2012) and Silverman et al. (2012), have conducted thorough comparisons of classification schemes for SNe Ia, leveraging extensive spectral data from the CfA and the Berkeley SuperNova Ia Program. Measurements from the near-maximum light spectrum of SN 2021wuf yield an EW of Si IIλ6355 of 50 Å, a decline rate Δm15(B) of 1.11 mag, and a photospheric velocity of 12 140 km s−1, respectively. In the left panel of Fig. 13, it is illustrated that SN 2021wuf is located at a distinct position compared to other types, characterized by small EW but slightly higher Δm15(B). This SNe Ia can be classified into SS subtypes in the Branch diagram (Branch et al. 2009) due to the small EWs (≤60 Å) of Si IIλ6355 and the nearly absent Si IIλ5972 as seen in Fig. 9(c). However, its Δm15(B) is most similar to SN 2011fe (Δm15(B) = 1.10mag; Pereira et al. 2013; Zhang et al. 2016).
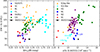 |
Fig. 13. Spatial distribution of measured parameters, such as the Si II 6355 EW, light-curve shape parameters Δm15(B), and photospheric expansion velocities Si IIλ6355, for different subtypes of Type Ia supernovae. Data were collected from multiple sources (Blondin et al. 2012; Silverman & Filippenko 2012; Wang et al. 2009a; Zhang et al. 2014; Zhai et al. 2016). The position of SN 2021wuf is marked with a black triangle. The left panel displays the spatial distribution of Si IIλ6355 EW and the Δm15(B) for the subclasses defined by Branch et al. (2009), while the right panel shows the spatial distribution of Si IIλ6355 EW and photospheric expansion velocities measured from the absorption minimum of Si IIλ6355 lines at B-band maximum for the subclasses given by Wang et al. (2009a) and Zhang et al. (2014). |
As shown in the right panel of Fig. 13, the velocity of Si IIλ6355 at maximum light is plotted against the EW of Si IIλ6355, with subclasses defined by Wang et al. (2009a). The SN 2012fr from Zhang et al. (2014) is also over-plotted. Similar to the observations in the left panel, SN 2021wuf is positioned at the middle-bottom, a position unlike other events but tending toward NL (Branch et al. 2009). For a classic normal example, SN 2011fe (Pereira et al. 2013; Zhai et al. 2016) has a velocity measured from the Si IIλ6355 absorption in the near-maximum-light spectrum of 10 400 km s−1. It is clear that SN 2021wuf has a much higher velocity than normal events and we predict it may also belong to the HV subclass, significantly beyond the upper limit ∼11 800 km s−1 (Wang et al. 2009a).
To classify SN 2021wuf, we conducted a comparison with a series of normal and peculiar samples, plotting Mmax(B) against Δm15(B), as shown in Fig. 14. To obtain reliable results, we carefully considered the distance and corrected for galactic extinction. Our calculations yielded a peak absolute magnitude of SN 2021wuf as Mmax(B) = −19.49 ± 0.10 mag, which is higher than the typical values of SNe Ia (the typical Mmax(B) = −19.33 ± 0.06 mag as given by Wang et al. (2006)). It is noteworthy that similarly to the velocity of Si IIλ6355, the absolute magnitude at the maximum light in the B-band also exhibits a close resemblance to SN 2012fr (Mmax(B) = −19.50 mag; Zhang et al. 2014). As shown in Fig. 14, SN 2021wuf is positioned slightly above the middle and overlaps well with normal samples (Filippenko et al. 1992a; Krisciunas et al. 2017). Indeed, it is puzzling that this source has a higher than average Δm15(B) and is relatively brighter, which makes the classification of SN 2021wuf more complex compared to typical SN Ia.
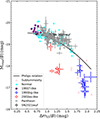 |
Fig. 14. Absolute B-band magnitude at peak is plotted against the light-curve decline rate Δm15(B) (Phillips 1993), including the 1991bg-like, 2002es-like, 1999T-like, subluminous events, and normal events. The samples are taken from multiple sources (Filippenko et al. 1992a,b; Taubenberger 2017; Krisciunas et al. 2017; Scolnic et al. 2018; Li et al. 2022b). The solid curve represents the best-fit relation proposed by Phillips et al. (1999) using the CfA3 data. Different classes of objects discussed in this chapter are highlighted by different colors and SN 2021wuf is represented by a black rhombus. |
In the early spectral stages, the absorption lines of IMEs in 91T-like supernovae are weak (e.g., absorption from Ca II H&K, Ca II NIR, and Si IIλ6355). This special phenomenon could be attributed to the combined effect of high photosphere temperature and/or low IMEs abundance in the supernova ejecta (Mazzali et al. 1995; Sasdelli et al. 2014). According to Mazzali et al. (1995) and Sasdelli et al. (2014), the observation characteristics of SN 1991T could be caused by the presence of 56Ni in the outer layers of the ejecta. It is noted that the Δm15(B) of SN 2021wuf (Δm15(B) = 1.11 ± 0.06 mag) shows no significant difference with that of SN 2005cf (Δm15(B) = 1.12 ± 0.03 mag) within the quoted errors. Furthermore, there are some similarities in the quasi-bolometric light curves of these two events. Therefore, we have reason to believe that SN 2021wuf may be a transitional object between a normal and 1991T-like type Ia supernova.
5.3. Origin of expansive velocity plateau
Our detailed analysis of SN 2021wuf’s light curves and spectra has revealed intriguing characteristics. A prominent feature of our analysis is the identified plateau in the velocity evolution of the Si IIλ6355 line. This observation could offer crucial insights to comprehend the nature of the explosion mechanism of type Ia supernovae.
It is noteworthy that several other SNe Ia have been observed to display a similar short-lived (few weeks duration) velocity plateau, as seen in the super-Chandrasekhar candidates SN 2007if presented by Scalzo et al. (2012), as well as in SN 2002cx (Li et al. 2001), SN 2005hj (Quimby et al. 2007), SN 2015bq (Li et al. 2022a), and SN 2012fr (Zhang et al. 2014), all of which exhibited a narrow velocity width. It is hypothesized that these observations indicate the presence of a thin region within the ejecta where partial burning elements are responsible for the narrow line widths and the existence of the IMEs (Childress et al. 2013). This could be a result of stratification in the ejecta (Childress et al. 2013). The velocity plateaus observed in the other SNe Ia have been explained in terms of explosion models featuring density enhancements at specific velocities (Childress et al. 2013), which form at the reverse shock of an interaction between the SN ejecta and overlying material. Examples of such models include “tamped detonations” and “pulsating delayed detonations”, such as the DET2ENV and PDD series models proposed by Khokhlov et al. (1993).
In a tamped detonation, the SN ejecta interact with a dense envelope of hydrogen-poor material, such as the carbon-oxygen (C–O) envelope which might persist after a double-degenerate merger (Fryer et al. 2010; Shen et al. 2012). This interaction rapidly freezes out, and the shock structure subsequently expands homologously. In a pulsating delayed detonation, the initial deflagration phase is extinguished and the white dwarf progenitor experiences a strong pulsation. This leads to the contraction of the outer layers. This contraction then reignites carbon and ultimately triggers a transition to a detonation, where a shock wave forms at the interface between the expanding inner layers and contracting outer layers.
Regardless of its formation mechanism, the dense layer in these models remains optically thick for a certain period, leading to a plateau in the Si II velocity (Childress et al. 2013). Thus, the velocity plateau in Si IIλ6355 not only indicates a pure density enhancement, but also potentially suggests that Si II is confined to a narrow region in velocity space. This is consistent with the low-velocity gradient characteristics of SN 2021wuf. Moreover, along with the narrowness of the absorption features, indicating a probable stratification of the progress to complete nuclear burning in the ejecta. These characteristics are typical in scenarios where the IMEs are predominantly produced during a detonation phase (Seitenzahl et al. 2013) as compared to deflagration scenarios, which result in significantly increased mixing in the ejecta.
5.4. Explosion mechanism
Late-time spectra of SNe Ia, characterized by the presence of forbidden lines of iron elements, serve as a valuable tool for investigating the quantity and distribution of radioactive 56Ni (Axelrod 1980; Meyerott 1980; Nomoto 1982; Höflich et al. 2004; Kasen 2010; Maguire et al. 2013; Scalzo et al. 2014). Models based on steadily accreting the Chandrasekhar mass (MCh) predict notably higher central densities (∼109 g cm−3) compared to sub-MCh models, where lower central densities are anticipated (∼107 g cm−3; Rosswog et al. 2009; Pakmor et al. 2012; Shen et al. 2018) The higher central densities are reflected in increased ratios of stable isotopes (e.g., 54Fe, 58Ni) to radioactively produced 58Fe isotopes due to enhanced electron capture within these high-density environments (Maguire et al. 2018). Consequently, the ratios of stable to radioactive iron group isotopes present a promising method for distinguishing between Chandrasekhar and sub-Chandrasekhar mass explosions, with a certain sensitivity to the central density of the exploding white dwarfs (Höflich et al. 2004; Maguire et al. 2018; Liu et al. 2023).
To further investigate the physics of Type Ia supernova (SNe Ia) explosions, we conducted an analysis of the late-time spectra of SN 2021wuf, comparing them with those of other well-observed normal and peculiar events, specifically SN 2017fgc, SN 1999aa, and SN 2012fr, as depicted in Fig. 15. Our findings reveal that the late-phase spectral shapes exhibit general similarities, with variations primarily observed in the intensity of emission lines. At this stage, the ejecta have significantly expanded and become transparent to radiation from the inner core, indicative of a phase exceeding 200 days after peak brightness, which is dominated by emission from the Fe-group elements (Liu et al. 2023). During the nebular phase, the spectral profile in the 6800–7800 Åwavelength range is predominantly influenced by [Fe II] and [Ni II] (Maguire et al. 2018; Flörs et al. 2020), which play crucial roles in determining the structure and abundance ratio of the iron group elements. From the spectrum of SN 2021wuf at 208 days, the intensities of the [Fe II] and [Ni II] lines are notably higher compared to those of other events, indicating a potentially higher Ni/Fe ratio in this particular event.
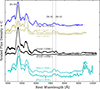 |
Fig. 15. Comparison of late-time spectra of SNe 2021wuf, 2017fgc (Zeng et al. 2021), 2012fr (Childress et al. 2015), and 1999aa (Silverman et al. 2012). Flux densities are all normalized and smoothed with a Savitsky-Golay filter of width ∼50 Å. The rest-frame wavelengths of [Fe III] 4659 Å, [Fe II] 7155 Å, and [Ni II] 7378 Åare marked by dashed lines. |
According to Maguire et al. (2018), the precise flux ratio of [Fe II] 7155 Å and [Ni II] 7378 Å is utilized to provide an initial estimation of the Ni/Fe ratio and to constrain the explosion mechanism of Type Ia supernovae (SNe Ia). Figure 16 illustrates the estimated mass ratios of Ni and Fe for a series of SNe Ia as a function of phase since maximum light. The data in comparison are taken from Liu et al. (2023) and Flörs et al. (2020). For the extensively observed SN 2021wuf, the calculated Ni/Fe ratios are relatively higher (with Ni/Fe ratios of 0.079 ± 0.032 at 208 days and 0.085 ± 0.034 at 299 days, respectively), suggesting a Delayed-Detonation models (DDT) could be more appropriate for this object (Seitenzahl et al. 2013).
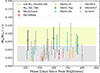 |
Fig. 16. Mass ratio of Ni and Fe as a function of phase from the maximum light for Type Ia supernovae (SNe Ia), which are inferred from the emission lines from the late-time spectra. The relatively large error bars are primarily attributed to the approximately 40% relative uncertainty of the estimation from Maguire et al. (2018) that we have utilized. In accordance with the findings of Flörs et al. (2020), the predicted Ni/Fe ratio ranges for the delayed-detonation (DDT) models (Seitenzahl et al. 2013) are indicated by the yellow band, while those for the sub-Chandrasekhar mass (sub-MCh) models (Shen et al. 2018) are represented by the gray band. Both the Ni/Fe ratios derived from the observed spectra and those predicted by the explosion models are normalized to t → ∞ by assuming a rise time of approximately 18 days (Ganeshalingam et al. 2011). |
6. Conclusions
In this study, we present extensive optical photometry and spectroscopy analysis of Type Ia supernova (SN) 2021wuf, which was discovered between the lenticular galaxy NGC 6500 and spiral galaxy NGC 6501. Our observations indicate that SN 2021wuf is a luminous Type Ia supernova. The maximum bolometric luminosity deduced from the ultraviolet and optical light curves is 1.58 × 1043 erg s−1, with a calculated nickel mass of 0.64 ± 0.05 M⊙. This object falls into the category of normal and high velocity Type Ia supernovae, corresponding to Δm15(B) = 1.11 ± 0.06 mag, an absolute B-band magnitude of Mmax(B) = −19.49 ± 0.10 mag, and a velocity at maximum light v0 = 12 140 ± 370 km s−1. In conclusion, our findings support the classification of SN 2021wuf as a luminous Type Ia supernova, based on its observed characteristics and parameters.
-
According to the model fitting on multi-band light curves, there is no significant early excess flux in the light curves of SN 2021wuf. Several parameters are utilized for the classification of Type Ia supernovae, including the first light time, Mmax(B) and Δm15(B). Upon calculating the corresponding relationships, we observe that SN 2021wuf appears to belong to the ordinary type. Given its similarities to normal evens and SN 1991T-like, SN 2021wuf could potentially represent a transition between Ia-norm and SN 1991T-like supernovae.
-
The properties of SN 2021wuf exhibit both similarities with those normal and peculiar Type Ia supernovae. The relatively dimmer tails observed in the UVgri bands for SN 2021wuf may indicate less radioactive decay of 56Ni. Additionally, during the period of B-band maximum, the bluer colors observed in the B − V color curves of SN 2021wuf may be indicative of higher photospheric temperatures.
-
The spectral evolution of SN 2021wuf exhibits a striking similarity to SN 1999T, characterized by weak IMEs absorption lines, which we attribute to the high envelope temperature, as indicated by the low R(Si II) value of 0.025 ± 0.005. Through the study of the spectral element velocity evolution, we classify SN 2021wuf into the HV and LVG subclasses, based on its velocity at maximum light (v0) of 12 140 ± 370 km s−1 and velocity gradient (
 ) of 2.3 ± 12.6 km s−1 day−1. Furthermore, we propose that the density enhancement and confinement to a narrow region in velocity space contributed to the observed velocity evolution plateau. Taking into account the flux ratio of [Fe II] 7155 Å and [Ni II] 7378 Å in nebular phases, as well as the origin of the observed velocity evolution plateau, it is suggested that SN 2021wuf likely belongs to a pulsating delayed detonation. Further exploration of the classification of Type Ia supernovae is a valuable avenue for future research.
Extensive observational datasets from individual Type Ia supernovae, such as SN 2021wuf, can significantly enhance our understanding of the nature of Type Ia supernova explosions. Identifying intriguing observational features in the spectral time series presents a valuable opportunity for further detailed modeling, which can uncover additional nuanced insights. This meticulous analysis and modeling have the potential to make a substantial contribution to our understanding of the underlying physics and dynamics of Type Ia supernovae, ultimately aiding in the refinement and improvement of models for these important astronomical phenomena.
Data availability
Full Table 3 and photometric data are available at the CDS via anonymous ftp to cdsarc.cds.unistra.fr (130.79.128.5) or via https://cdsarc.cds.unistra.fr/viz-bin/cat/J/A+A/691/A90
The reduced spectra are available at https://www.wiserep.org/search.
Acknowledgments
Esamdin is supported by the National Key R&D program of China for Intergovernmental Scientific and TechnologicalInnovation Cooperation Project under No. 2022YFE0126200. This research was funded by National Natural Science Foundation of China 12203029 and U2031202, and Tian-shan Talent Training Program No. 2023TSYCLJ0053. Furthermore, this work is supported by the High Level Talent–Heaven Lake Program of Xinjiang Uygur Autonomous Region of China. Xiaofeng Wang is supported by the National Natural Science Foundation of China (NSFC grants 12288102 and 12033003), and the Tencent Xplorer prize. The authors express their gratitude to the staffs of LCO network 1-m/2-m telescopes for supplying the data. Additionally, the LCO group receives support from NSF grants AST-1911225 and AST-1911151, as well as NASA grant Section 80NSSC19K1639. Moreover, this work has made use of data from the Asteroid Terrestrial-impact Last Alert System (ATLAS) project. The Asteroid Terrestrial-impact Last Alert System (ATLAS) project is primarily funded to search for near earth asteroids through NASA grants NN12AR55G, 80NSSC18K0284, and 80NSSC18K1575; byproducts of the NEO search include images and catalogs from the survey area. The ATLAS science products have been made possible through the contributions of the University of Hawaii Institute for Astronomy, the Queen’s University Belfast, the Space Telescope Science Institute, the South African Astronomical Observatory, and The Millennium Institute of Astrophysics (MAS), Chile.
References
- Ahlberg, J. H., Nilson, E. N., & Walsh, J. L. 1967, The Theory of Splines and their Applications (New York: Academic Press) [Google Scholar]
- Aldering, G., Antilogus, P., Bailey, S., et al. 2006, ApJ, 650, 510 [NASA ADS] [CrossRef] [Google Scholar]
- Arnett, W. D. 1982, ApJ, 253, 785 [Google Scholar]
- Axelrod, T. S. 1980, in Texas Workshop on Type I Supernovae, ed. J. C. Wheeler, 80 [Google Scholar]
- Benetti, S., Meikle, P., Stehle, M., et al. 2004, MNRAS, 348, 261 [CrossRef] [Google Scholar]
- Benetti, S., Cappellaro, E., Mazzali, P. A., et al. 2005, ApJ, 623, 1011 [NASA ADS] [CrossRef] [Google Scholar]
- Blondin, S., Dessart, L., Leibundgut, B., et al. 2006, AJ, 131, 1648 [NASA ADS] [CrossRef] [Google Scholar]
- Blondin, S., Prieto, J. L., Patat, F., et al. 2009, ApJ, 693, 207 [CrossRef] [Google Scholar]
- Blondin, S., Matheson, T., Kirshner, R. P., et al. 2012, AJ, 143, 126 [NASA ADS] [CrossRef] [Google Scholar]
- Bochenek, C. D., Dwarkadas, V. V., Silverman, J. M., et al. 2018, MNRAS, 473, 336 [NASA ADS] [CrossRef] [Google Scholar]
- Branch, D., Dang, L. C., Hall, N., et al. 2006, PASP, 118, 560 [NASA ADS] [CrossRef] [Google Scholar]
- Branch, D., Chau Dang, L., & Baron, E. 2009, PASP, 121, 238 [NASA ADS] [CrossRef] [Google Scholar]
- Brown, T. M., Burleson, B., Crellin, M., et al. 2010, Am. Astron. Soc. Meeting Abstr., 215, 441.06 [NASA ADS] [Google Scholar]
- Brown, P. J., Dawson, K. S., Harris, D. W., et al. 2012, ApJ, 749, 18 [NASA ADS] [CrossRef] [Google Scholar]
- Brown, T. M., Baliber, N., Bianco, F. B., et al. 2013, PASP, 125, 1031 [Google Scholar]
- Burke, J., Howell, D. A., Sarbadhicary, S. K., et al. 2021, ApJ, 919, 142 [NASA ADS] [CrossRef] [Google Scholar]
- Burke, J., Howell, D. A., Sand, D. J., et al. 2022, ArXiv e-prints [arXiv:2207.07681] [Google Scholar]
- Burns, C. R., Stritzinger, M., Phillips, M. M., et al. 2011, AJ, 141, 19 [Google Scholar]
- Burns, C. R., Stritzinger, M., Phillips, M. M., et al. 2014, ApJ, 789, 32 [Google Scholar]
- Cardelli, J. A., Clayton, G. C., & Mathis, J. S. 1989, ApJ, 345, 245 [Google Scholar]
- Chambers, K. C., Magnier, E. A., Metcalfe, N., et al. 2016, ArXiv e-prints [arXiv:1612.05560] [Google Scholar]
- Chatzopoulos, E., Wheeler, J. C., & Vinko, J. 2012, ApJ, 746, 121 [Google Scholar]
- Childress, M. J., Scalzo, R. A., Sim, S. A., et al. 2013, ApJ, 770, 29 [NASA ADS] [CrossRef] [Google Scholar]
- Childress, M. J., Hillier, D. J., Seitenzahl, I., et al. 2015, MNRAS, 454, 3816 [NASA ADS] [CrossRef] [Google Scholar]
- Chornock, R., Filippenko, A. V., Branch, D., et al. 2006, PASP, 118, 722 [NASA ADS] [CrossRef] [Google Scholar]
- Conley, A., Sullivan, M., Hsiao, E. Y., et al. 2008, ApJ, 681, 482 [NASA ADS] [CrossRef] [Google Scholar]
- Dilday, B., Howell, D. A., Cenko, S. B., et al. 2012, Science, 337, 942 [NASA ADS] [CrossRef] [Google Scholar]
- Filippenko, A. V. 1997, ARA&A, 35, 309 [NASA ADS] [CrossRef] [Google Scholar]
- Filippenko, A. V., Richmond, M. W., Branch, D., et al. 1992a, AJ, 104, 1543 [NASA ADS] [CrossRef] [Google Scholar]
- Filippenko, A. V., Richmond, M. W., Matheson, T., et al. 1992b, ApJ, 384, L15 [CrossRef] [Google Scholar]
- Fixsen, D. J., Cheng, E. S., Gales, J. M., et al. 1996, ApJ, 473, 576 [Google Scholar]
- Flörs, A., Spyromilio, J., Taubenberger, S., et al. 2020, MNRAS, 491, 2902 [NASA ADS] [Google Scholar]
- Fryer, C. L., Ruiter, A. J., Belczynski, K., et al. 2010, ApJ, 725, 296 [NASA ADS] [CrossRef] [Google Scholar]
- Ganeshalingam, M., Li, W., & Filippenko, A. V. 2011, MNRAS, 416, 2607 [NASA ADS] [CrossRef] [Google Scholar]
- Ganeshalingam, M., Li, W., Filippenko, A. V., et al. 2012, ApJ, 751, 142 [NASA ADS] [CrossRef] [Google Scholar]
- Garavini, G., Folatelli, G., Goobar, A., et al. 2004, AJ, 128, 387 [NASA ADS] [CrossRef] [Google Scholar]
- González Hernández, J. I., Ruiz-Lapuente, P., Tabernero, H. M., et al. 2012, Nature, 489, 533 [CrossRef] [Google Scholar]
- Hamuy, M., Phillips, M. M., Suntzeff, N. B., et al. 2003, Nature, 424, 651 [NASA ADS] [CrossRef] [Google Scholar]
- Hicken, M., Garnavich, P. M., Prieto, J. L., et al. 2007, ApJ, 669, L17 [NASA ADS] [CrossRef] [Google Scholar]
- Hillebrandt, W., Niemeyer, J. C., & Reinecke, M. 2000, AIP Conf. Ser., 522, 53 [NASA ADS] [CrossRef] [Google Scholar]
- Höflich, P., Gerardy, C. L., Nomoto, K., et al. 2004, ApJ, 617, 1258 [CrossRef] [Google Scholar]
- Hosseinzadeh, G., Sand, D. J., Lundqvist, P., et al. 2022, ApJ, 933, L45 [NASA ADS] [CrossRef] [Google Scholar]
- Hosseinzadeh, G., Bostroem, K. A., & Gomez, S. 2023a, https://doi.org/10.5281/zenodo.8049154 [Google Scholar]
- Hosseinzadeh, G., Sand, D. J., Sarbadhicary, S. K., et al. 2023b, ApJ, 953, L15 [NASA ADS] [CrossRef] [Google Scholar]
- Howell, D. A., & Global Supernova Project 2017, Am. Astron. Soc. Meeting Abstr., 230, 318.03 [NASA ADS] [Google Scholar]
- Huber, M. E. 2021, Transient Name Server Classif. Rep., 2021-2928, 1 [NASA ADS] [Google Scholar]
- Iben, I.Jr, & Tutukov, A. V. 1984, ApJS, 54, 335 [NASA ADS] [CrossRef] [Google Scholar]
- Jack, D., Baron, E., & Hauschildt, P. H. 2015, MNRAS, 449, 3581 [NASA ADS] [CrossRef] [Google Scholar]
- Jeffery, D. J., Branch, D., & Baron, E. 2006, ArXiv e-prints [arXiv:astro-ph/0609804] [Google Scholar]
- Jha, S. 2002, Ph.D. Thesis (Massachusetts: Harvard University), USA [Google Scholar]
- Kasen, D. 2010, ApJ, 708, 1025 [Google Scholar]
- Kasen, D., & Woosley, S. E. 2007, ApJ, 656, 661 [NASA ADS] [CrossRef] [Google Scholar]
- Khokhlov, A., Mueller, E., & Hoeflich, P. 1993, A&A, 270, 223 [NASA ADS] [CrossRef] [Google Scholar]
- Krisciunas, K., Contreras, C., Burns, C. R., et al. 2017, AJ, 154, 211 [NASA ADS] [CrossRef] [Google Scholar]
- Leloudas, G., Stritzinger, M. D., Sollerman, J., et al. 2009, A&A, 505, 265 [NASA ADS] [CrossRef] [EDP Sciences] [Google Scholar]
- Li, W., Filippenko, A. V., Gates, E., et al. 2001, PASP, 113, 1178 [Google Scholar]
- Li, W., Filippenko, A. V., Chornock, R., et al. 2003, PASP, 115, 453 [Google Scholar]
- Li, L., Wang, X., Zhang, J., et al. 2018, MNRAS, 478, 4575 [NASA ADS] [CrossRef] [Google Scholar]
- Li, W., Wang, X., Vinkó, J., et al. 2019, ApJ, 870, 12 [Google Scholar]
- Li, L., Zhang, J., Dai, B., et al. 2022a, ApJ, 924, 35 [NASA ADS] [CrossRef] [Google Scholar]
- Li, Z., Zhang, T., Wang, X., et al. 2022b, ApJ, 927, 142 [NASA ADS] [CrossRef] [Google Scholar]
- Lira, P., Suntzeff, N. B., Phillips, M. M., et al. 1998, AJ, 115, 234 [NASA ADS] [CrossRef] [Google Scholar]
- Liu, T., & Liao, K. 2024, MNRAS, 528, 1354 [NASA ADS] [CrossRef] [Google Scholar]
- Liu, J., Wang, X., Filippenko, A. V., et al. 2023, MNRAS, 526, 1268 [CrossRef] [Google Scholar]
- Livio, M., & Mazzali, P. 2018, Phys. Rep., 736, 1 [Google Scholar]
- Maeda, K., Benetti, S., Stritzinger, M., et al. 2010, Nature, 466, 82 [NASA ADS] [CrossRef] [Google Scholar]
- Maguire, K., Sullivan, M., Patat, F., et al. 2013, MNRAS, 436, 222 [CrossRef] [Google Scholar]
- Maguire, K., Sim, S. A., Shingles, L., et al. 2018, MNRAS, 477, 3567 [NASA ADS] [CrossRef] [Google Scholar]
- Maoz, D., Mannucci, F., & Nelemans, G. 2014, ARA&A, 52, 107 [Google Scholar]
- Mazzali, P. A., Danziger, I. J., & Turatto, M. 1995, A&A, 297, 509 [NASA ADS] [Google Scholar]
- McCully, C., Jha, S. W., Foley, R. J., et al. 2014, ApJ, 786, 134 [NASA ADS] [CrossRef] [Google Scholar]
- Meyerott, R. E. 1980, ApJ, 239, 257 [NASA ADS] [CrossRef] [Google Scholar]
- Nomoto, K. 1982, ApJ, 253, 798 [Google Scholar]
- Nomoto, K., Thielemann, F. K., & Yokoi, K. 1984, ApJ, 286, 644 [Google Scholar]
- Nomoto, K., Iwamoto, K., & Kishimoto, N. 1997, Science, 276, 1378 [NASA ADS] [CrossRef] [Google Scholar]
- Nugent, P., Baron, E., Branch, D., Fisher, A., & Hauschildt, P. H. 1997, ApJ, 485, 812 [Google Scholar]
- Nugent, P. E., Sullivan, M., Cenko, S. B., et al. 2011, Nature, 480, 344 [NASA ADS] [CrossRef] [Google Scholar]
- Olling, R. P., Mushotzky, R., Shaya, E. J., et al. 2015, Nature, 521, 332 [NASA ADS] [CrossRef] [Google Scholar]
- Pakmor, R., Kromer, M., Taubenberger, S., et al. 2012, ApJ, 747, L10 [NASA ADS] [CrossRef] [Google Scholar]
- Pan, Y.-C. 2020, ApJ, 895, L5 [NASA ADS] [CrossRef] [Google Scholar]
- Pan, Y. C., Sullivan, M., Maguire, K., et al. 2015, MNRAS, 446, 354 [NASA ADS] [CrossRef] [Google Scholar]
- Pastorello, A., Mazzali, P. A., Pignata, G., et al. 2007a, MNRAS, 377, 1531 [CrossRef] [Google Scholar]
- Pastorello, A., Taubenberger, S., Elias-Rosa, N., et al. 2007b, MNRAS, 376, 1301 [NASA ADS] [CrossRef] [Google Scholar]
- Pereira, R., Thomas, R. C., Aldering, G., et al. 2013, A&A, 554, A27 [NASA ADS] [CrossRef] [EDP Sciences] [Google Scholar]
- Perlmutter, S., Aldering, G., Goldhaber, G., et al. 1999, ApJ, 517, 565 [Google Scholar]
- Phillips, M. M. 1993, ApJ, 413, L105 [Google Scholar]
- Phillips, M. M., Wells, L. A., Suntzeff, N. B., et al. 1992, AJ, 103, 1632 [NASA ADS] [CrossRef] [Google Scholar]
- Phillips, M. M., Lira, P., Suntzeff, N. B., et al. 1999, AJ, 118, 1766 [Google Scholar]
- Piro, A. L., & Morozova, V. S. 2016, ApJ, 826, 96 [NASA ADS] [CrossRef] [Google Scholar]
- Piro, A. L., & Nakar, E. 2013, ApJ, 769, 67 [NASA ADS] [CrossRef] [Google Scholar]
- Piro, A. L., Chang, P., & Weinberg, N. N. 2010, ApJ, 708, 598 [NASA ADS] [CrossRef] [Google Scholar]
- Podsiadlowski, P., Mazzali, P., Lesaffre, P., Han, Z., & Förster, F. 2008, New Astron. Rev., 52, 381 [CrossRef] [Google Scholar]
- Quimby, R., Höflich, P., & Wheeler, J. C. 2007, ApJ, 666, 1083 [NASA ADS] [CrossRef] [Google Scholar]
- Riess, A. G., Filippenko, A. V., Challis, P., et al. 1998, AJ, 116, 1009 [Google Scholar]
- Rosswog, S., Kasen, D., Guillochon, J., & Ramirez-Ruiz, E. 2009, ApJ, 705, L128 [NASA ADS] [CrossRef] [Google Scholar]
- Sand, D. J., Brown, T., Haynes, R., & Dubberley, M. 2011, Am. Astron. Soc. Meeting Abstr., 218, 132.03 [NASA ADS] [Google Scholar]
- Sasdelli, M., Mazzali, P. A., Pian, E., et al. 2014, MNRAS, 445, 711 [NASA ADS] [CrossRef] [Google Scholar]
- Sato, Y., Nakasato, N., Tanikawa, A., et al. 2015, ApJ, 807, 105 [NASA ADS] [CrossRef] [Google Scholar]
- Scalzo, R. A., Aldering, G., Antilogus, P., et al. 2010, ApJ, 713, 1073 [NASA ADS] [CrossRef] [Google Scholar]
- Scalzo, R., Aldering, G., Antilogus, P., et al. 2012, ApJ, 757, 12 [NASA ADS] [CrossRef] [Google Scholar]
- Scalzo, R., Aldering, G., Antilogus, P., et al. 2014, MNRAS, 440, 1498 [NASA ADS] [CrossRef] [Google Scholar]
- Schaefer, B. E., & Pagnotta, A. 2012, Nature, 481, 164 [NASA ADS] [CrossRef] [Google Scholar]
- Schlafly, E. F., & Finkbeiner, D. P. 2011, ApJ, 737, 103 [Google Scholar]
- Scolnic, D. M., Jones, D. O., Rest, A., et al. 2018, ApJ, 859, 101 [NASA ADS] [CrossRef] [Google Scholar]
- Seitenzahl, I. R., Ciaraldi-Schoolmann, F., Röpke, F. K., et al. 2013, MNRAS, 429, 1156 [NASA ADS] [CrossRef] [Google Scholar]
- Shen, K. J., Bildsten, L., Kasen, D., & Quataert, E. 2012, ApJ, 748, 35 [Google Scholar]
- Shen, K. J., Kasen, D., Miles, B. J., & Townsley, D. M. 2018, ApJ, 854, 52 [Google Scholar]
- Silverman, J. M., & Filippenko, A. V. 2012, MNRAS, 425, 1917 [NASA ADS] [CrossRef] [Google Scholar]
- Silverman, J. M., Ganeshalingam, M., Li, W., et al. 2011, MNRAS, 410, 585 [NASA ADS] [CrossRef] [Google Scholar]
- Silverman, J. M., Foley, R. J., Filippenko, A. V., et al. 2012, MNRAS, 425, 1789 [Google Scholar]
- Silverman, J. M., Ganeshalingam, M., & Filippenko, A. V. 2013a, MNRAS, 430, 1030 [NASA ADS] [CrossRef] [Google Scholar]
- Silverman, J. M., Nugent, P. E., Gal-Yam, A., et al. 2013b, ApJ, 772, 125 [NASA ADS] [CrossRef] [Google Scholar]
- Smith, K. W., Smartt, S. J., Young, D. R., et al. 2020, PASP, 132, 085002 [Google Scholar]
- Smitka, M. T., Brown, P. J., Suntzeff, N. B., et al. 2015, ApJ, 813, 30 [NASA ADS] [CrossRef] [Google Scholar]
- Soker, N. 2019, New Astron. Rev., 87, 101535 [CrossRef] [Google Scholar]
- Srivastav, S., Smith, K. W., Smartt, S. J., et al. 2021, Transient Name Server AstroNote, 224, 1 [NASA ADS] [Google Scholar]
- Sternberg, A., Gal-Yam, A., Simon, J. D., et al. 2011, Science, 333, 856 [NASA ADS] [CrossRef] [Google Scholar]
- Stetson, P. B. 2000, PASP, 112, 925 [Google Scholar]
- Suntzeff, N. B. 1996, in IAU Colloq. 145: Supernovae and Supernova Remnants, ed. T. S. Kuhn, 41 [CrossRef] [Google Scholar]
- Taddia, F., Stritzinger, M. D., Phillips, M. M., et al. 2012, A&A, 545, L7 [NASA ADS] [CrossRef] [EDP Sciences] [Google Scholar]
- Taubenberger, S. 2017, in Handbook of Supernovae, eds. A. W. Alsabti, & P. Murdin, 317 [CrossRef] [Google Scholar]
- Tody, D. 1986, SPIE Conf. Ser., 627, 733 [Google Scholar]
- Tody, D. 1993, ASP Conf. Ser., 52, 173 [NASA ADS] [Google Scholar]
- Tonry, J. L., Denneau, L., Heinze, A. N., et al. 2018, PASP, 130, 064505 [Google Scholar]
- Tripp, R. 1998, A&A, 331, 815 [NASA ADS] [Google Scholar]
- Tucker, M. A., Shappee, B. J., & Wisniewski, J. P. 2019, ApJ, 872, L22 [NASA ADS] [CrossRef] [Google Scholar]
- Tully, R. B., Courtois, H. M., Dolphin, A. E., et al. 2013, AJ, 146, 86 [NASA ADS] [CrossRef] [Google Scholar]
- Valenti, S., Howell, D. A., Stritzinger, M. D., et al. 2016, MNRAS, 459, 3939 [NASA ADS] [CrossRef] [Google Scholar]
- Wang, L., Baade, D., Höflich, P., et al. 2004, ApJ, 604, L53 [NASA ADS] [CrossRef] [Google Scholar]
- Wang, X., Wang, L., Zhou, X., Lou, Y.-Q., & Li, Z. 2005, ApJ, 620, L87 [NASA ADS] [CrossRef] [Google Scholar]
- Wang, X., Wang, L., Pain, R., Zhou, X., & Li, Z. 2006, ApJ, 645, 488 [NASA ADS] [CrossRef] [Google Scholar]
- Wang, X., Li, W., Filippenko, A. V., et al. 2008, ApJ, 677, 1060 [NASA ADS] [CrossRef] [Google Scholar]
- Wang, X., Filippenko, A. V., Ganeshalingam, M., et al. 2009a, ApJ, 699, L139 [NASA ADS] [CrossRef] [Google Scholar]
- Wang, X., Li, W., Filippenko, A. V., et al. 2009b, ApJ, 697, 380 [NASA ADS] [CrossRef] [Google Scholar]
- Wang, X., Wang, L., Filippenko, A. V., Zhang, T., & Zhao, X. 2013, Science, 340, 170 [NASA ADS] [CrossRef] [Google Scholar]
- Wang, X., Chen, J., Wang, L., et al. 2019, ApJ, 882, 120 [NASA ADS] [CrossRef] [Google Scholar]
- Waters, C. Z., Magnier, E. A., Price, P. A., et al. 2020, ApJS, 251, 4 [NASA ADS] [CrossRef] [Google Scholar]
- Webbink, R. F. 1984, ApJ, 277, 355 [NASA ADS] [CrossRef] [Google Scholar]
- Whelan, J., & Iben, Icko J. 1973, ApJ, 186, 1007 [CrossRef] [Google Scholar]
- Zeng, X., Wang, X., Esamdin, A., et al. 2021, ApJ, 919, 49 [NASA ADS] [CrossRef] [Google Scholar]
- Zhai, Q., Zhang, J.-J., Wang, X.-F., et al. 2016, AJ, 151, 125 [NASA ADS] [CrossRef] [Google Scholar]
- Zhang, J.-J., Wang, X.-F., Bai, J.-M., et al. 2014, AJ, 148, 1 [NASA ADS] [CrossRef] [Google Scholar]
- Zhang, K., Wang, X., Zhang, J., et al. 2016, ApJ, 820, 67 [NASA ADS] [CrossRef] [Google Scholar]
All Tables
All Figures
|
Fig. 1. Observation of SN 2021wuf taken by LCO. Reference stars are marked with orange circles. |
| In the text | |
|
Fig. 2. Optical spectral evolution of SN 2021wuf is presented in this study. All the spectra have been corrected for the redshift of the host galaxy and reddening. The spectral series of SN 2021wuf was obtained by LCO (depicted in blue) and TNS (depicted in orange), spanning the phases from −11 to +51.9 days. The epochs marked on the right side of the spectra represent the phases in days relative to the B-band maximum. Additionally, the vertical dashed lines indicate the absorption minima of the Si IIλ6355 absorption lines in the spectra of SN 2021wuf taken at t = +1.14 days. |
| In the text | |
|
Fig. 3. Optical light curves of SN 2021wuf obtained by ATLAS (marked with star) and LCO (marked with circle). The vertical dashed line indicates the B-band maximum and the light curves have been shifted vertically for clarity. |
| In the text | |
|
Fig. 4. Comparison of the optical light curves (in the UBVgri bands) of SN 2021wuf with those of other well-observed SNe Ia. The light curves of the comparison SNe Ia have been normalized to match the peak magnitudes of SN 2021wuf. |
| In the text | |
|
Fig. 5. Best-fit light curve model (solid black lines) from SNooPy2 for SN 2021wuf. The dashed black lines indicate the 1-σ uncertainty (in many cases smaller than the line width) with respect to the best-fit light curve templates and the light curves have been shifted vertically for clarity. |
| In the text | |
|
Fig. 6. B − V, r − i, g − r, and g − i color curves of SN 2021wuf are compared with those of SNe 1999aa, 2002bo, 2011fe, 2012fr, 2017fgc, and 2018oh. All color curves, including those of SN 2021wuf, have been dereddened using SNooPy2. |
| In the text | |
|
Fig. 7. Quasi-bolometric light curve of SN 2021wuf compared to that of SN 2005cf and SN 2011fe. |
| In the text | |
|
Fig. 8. Quasi-bolometric (UV and optical) light curves for SN 2021wuf compared to the best-fitting radiation diffusion model (Arnett 1982). |
| In the text | |
|
Fig. 9. Spectra of SN 2021wuf at t ≈ −12, −7, 0 and +10 days after the B-band maximum. The comparable phase spectra of SN 1991T (Lira et al. 1998), SN 1999aa (Jha 2002), SN 2011fe (Zhang et al. 2016), and SN 2012fr (Zhang et al. 2014) are verplotted. |
| In the text | |
|
Fig. 10. Ejecta velocity evolution of SN 2021wuf is compared with that of SNe 2011fe and 2012fr. The average velocity evolution curves obtained for SN 1991T-like and SN 1991bg-like SNe are overplotted as red and blue dashed lines, respectively. Velocities were measured from the minimum of their Si IIλ6355 absorption lines. The shaded region indicates the 1σ uncertainty of the mean velocity evolution curve for HV SNe Ia as derived from Wang et al. (2009a). Data for the comparison SNe and the region of normal SNe Ia are extracted from Li et al. (2019). |
| In the text | |
|
Fig. 11. Optical light curves of SN 2021wuf obtained by ATLAS (marked with star) and LCO (marked with circle), which is zoomed in for the early observations in Fig. 3. The gray region highlights the possible excess flux we initially recognized. |
| In the text | |
|
Fig. 12. Fitting of the multiband (UBVgri) early light curves of SN 2021wuf. The light curve of SN 2021wuf compared to the model of Kasen (2010), in which the SN ejecta collide with a nondegenerate binary companion. The dashed lines show the “normal” Type Ia component of this model, the SiFTO template from Conley et al. (2008). The solid lines are CompanionShocking3 + SiFTO template model. The dot indicates real observation value. The horizontal axis represents time relative to the explosion, and the vertical axis represents luminosity. |
| In the text | |
|
Fig. 13. Spatial distribution of measured parameters, such as the Si II 6355 EW, light-curve shape parameters Δm15(B), and photospheric expansion velocities Si IIλ6355, for different subtypes of Type Ia supernovae. Data were collected from multiple sources (Blondin et al. 2012; Silverman & Filippenko 2012; Wang et al. 2009a; Zhang et al. 2014; Zhai et al. 2016). The position of SN 2021wuf is marked with a black triangle. The left panel displays the spatial distribution of Si IIλ6355 EW and the Δm15(B) for the subclasses defined by Branch et al. (2009), while the right panel shows the spatial distribution of Si IIλ6355 EW and photospheric expansion velocities measured from the absorption minimum of Si IIλ6355 lines at B-band maximum for the subclasses given by Wang et al. (2009a) and Zhang et al. (2014). |
| In the text | |
|
Fig. 14. Absolute B-band magnitude at peak is plotted against the light-curve decline rate Δm15(B) (Phillips 1993), including the 1991bg-like, 2002es-like, 1999T-like, subluminous events, and normal events. The samples are taken from multiple sources (Filippenko et al. 1992a,b; Taubenberger 2017; Krisciunas et al. 2017; Scolnic et al. 2018; Li et al. 2022b). The solid curve represents the best-fit relation proposed by Phillips et al. (1999) using the CfA3 data. Different classes of objects discussed in this chapter are highlighted by different colors and SN 2021wuf is represented by a black rhombus. |
| In the text | |
|
Fig. 15. Comparison of late-time spectra of SNe 2021wuf, 2017fgc (Zeng et al. 2021), 2012fr (Childress et al. 2015), and 1999aa (Silverman et al. 2012). Flux densities are all normalized and smoothed with a Savitsky-Golay filter of width ∼50 Å. The rest-frame wavelengths of [Fe III] 4659 Å, [Fe II] 7155 Å, and [Ni II] 7378 Åare marked by dashed lines. |
| In the text | |
|
Fig. 16. Mass ratio of Ni and Fe as a function of phase from the maximum light for Type Ia supernovae (SNe Ia), which are inferred from the emission lines from the late-time spectra. The relatively large error bars are primarily attributed to the approximately 40% relative uncertainty of the estimation from Maguire et al. (2018) that we have utilized. In accordance with the findings of Flörs et al. (2020), the predicted Ni/Fe ratio ranges for the delayed-detonation (DDT) models (Seitenzahl et al. 2013) are indicated by the yellow band, while those for the sub-Chandrasekhar mass (sub-MCh) models (Shen et al. 2018) are represented by the gray band. Both the Ni/Fe ratios derived from the observed spectra and those predicted by the explosion models are normalized to t → ∞ by assuming a rise time of approximately 18 days (Ganeshalingam et al. 2011). |
| In the text | |
Current usage metrics show cumulative count of Article Views (full-text article views including HTML views, PDF and ePub downloads, according to the available data) and Abstracts Views on Vision4Press platform.
Data correspond to usage on the plateform after 2015. The current usage metrics is available 48-96 hours after online publication and is updated daily on week days.
Initial download of the metrics may take a while.