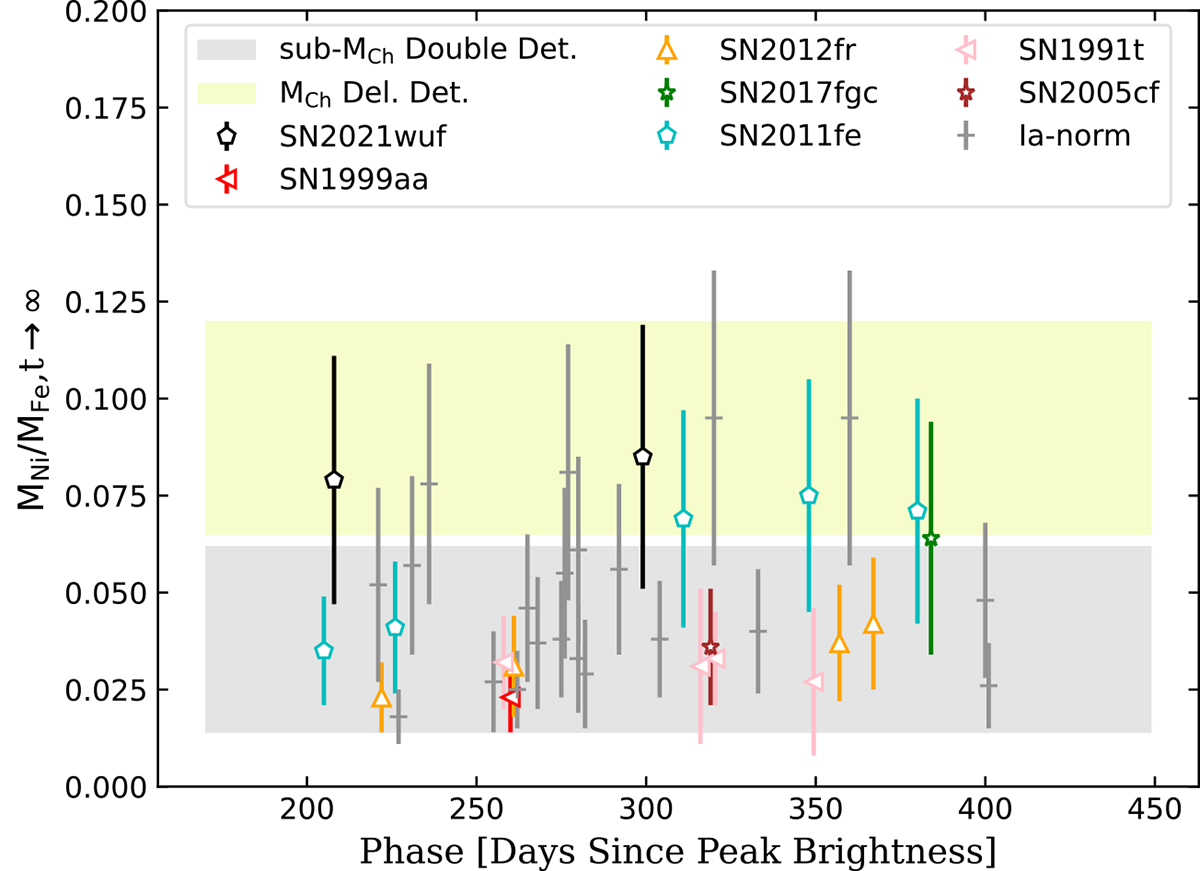
Fig. 16.
Download original image
Mass ratio of Ni and Fe as a function of phase from the maximum light for Type Ia supernovae (SNe Ia), which are inferred from the emission lines from the late-time spectra. The relatively large error bars are primarily attributed to the approximately 40% relative uncertainty of the estimation from Maguire et al. (2018) that we have utilized. In accordance with the findings of Flörs et al. (2020), the predicted Ni/Fe ratio ranges for the delayed-detonation (DDT) models (Seitenzahl et al. 2013) are indicated by the yellow band, while those for the sub-Chandrasekhar mass (sub-MCh) models (Shen et al. 2018) are represented by the gray band. Both the Ni/Fe ratios derived from the observed spectra and those predicted by the explosion models are normalized to t → ∞ by assuming a rise time of approximately 18 days (Ganeshalingam et al. 2011).
Current usage metrics show cumulative count of Article Views (full-text article views including HTML views, PDF and ePub downloads, according to the available data) and Abstracts Views on Vision4Press platform.
Data correspond to usage on the plateform after 2015. The current usage metrics is available 48-96 hours after online publication and is updated daily on week days.
Initial download of the metrics may take a while.