Fig. 14.
Download original image
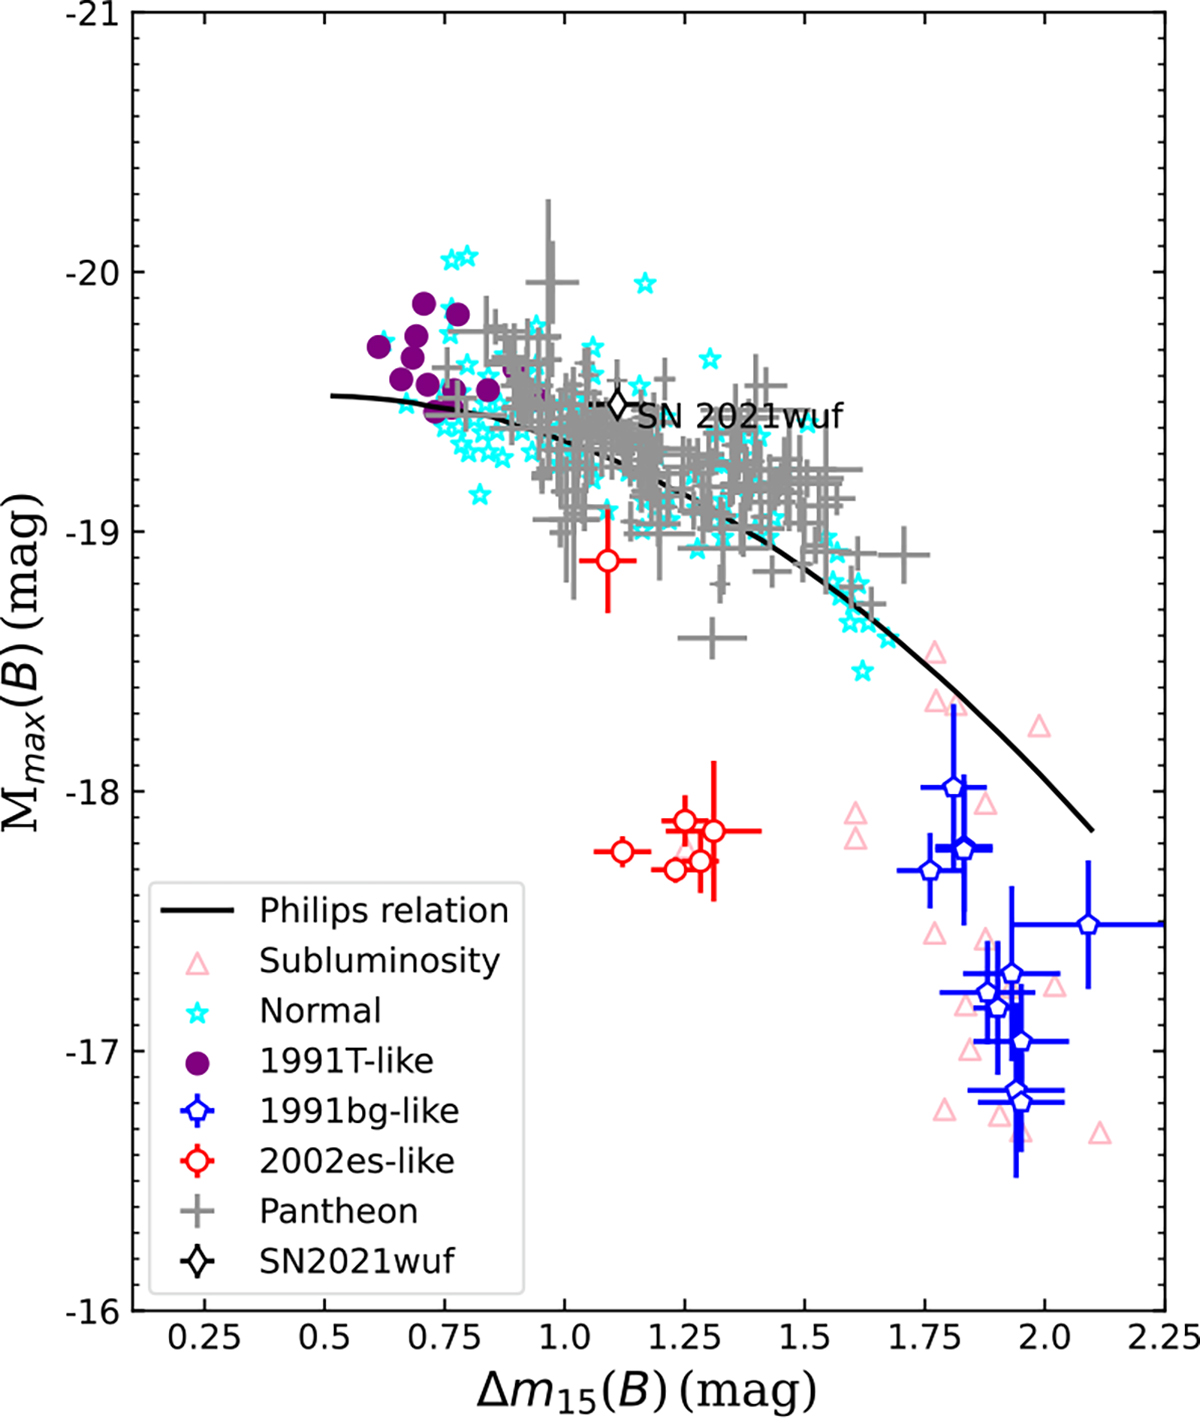
Absolute B-band magnitude at peak is plotted against the light-curve decline rate Δm15(B) (Phillips 1993), including the 1991bg-like, 2002es-like, 1999T-like, subluminous events, and normal events. The samples are taken from multiple sources (Filippenko et al. 1992a,b; Taubenberger 2017; Krisciunas et al. 2017; Scolnic et al. 2018; Li et al. 2022b). The solid curve represents the best-fit relation proposed by Phillips et al. (1999) using the CfA3 data. Different classes of objects discussed in this chapter are highlighted by different colors and SN 2021wuf is represented by a black rhombus.
Current usage metrics show cumulative count of Article Views (full-text article views including HTML views, PDF and ePub downloads, according to the available data) and Abstracts Views on Vision4Press platform.
Data correspond to usage on the plateform after 2015. The current usage metrics is available 48-96 hours after online publication and is updated daily on week days.
Initial download of the metrics may take a while.