Fig. 10.
Download original image
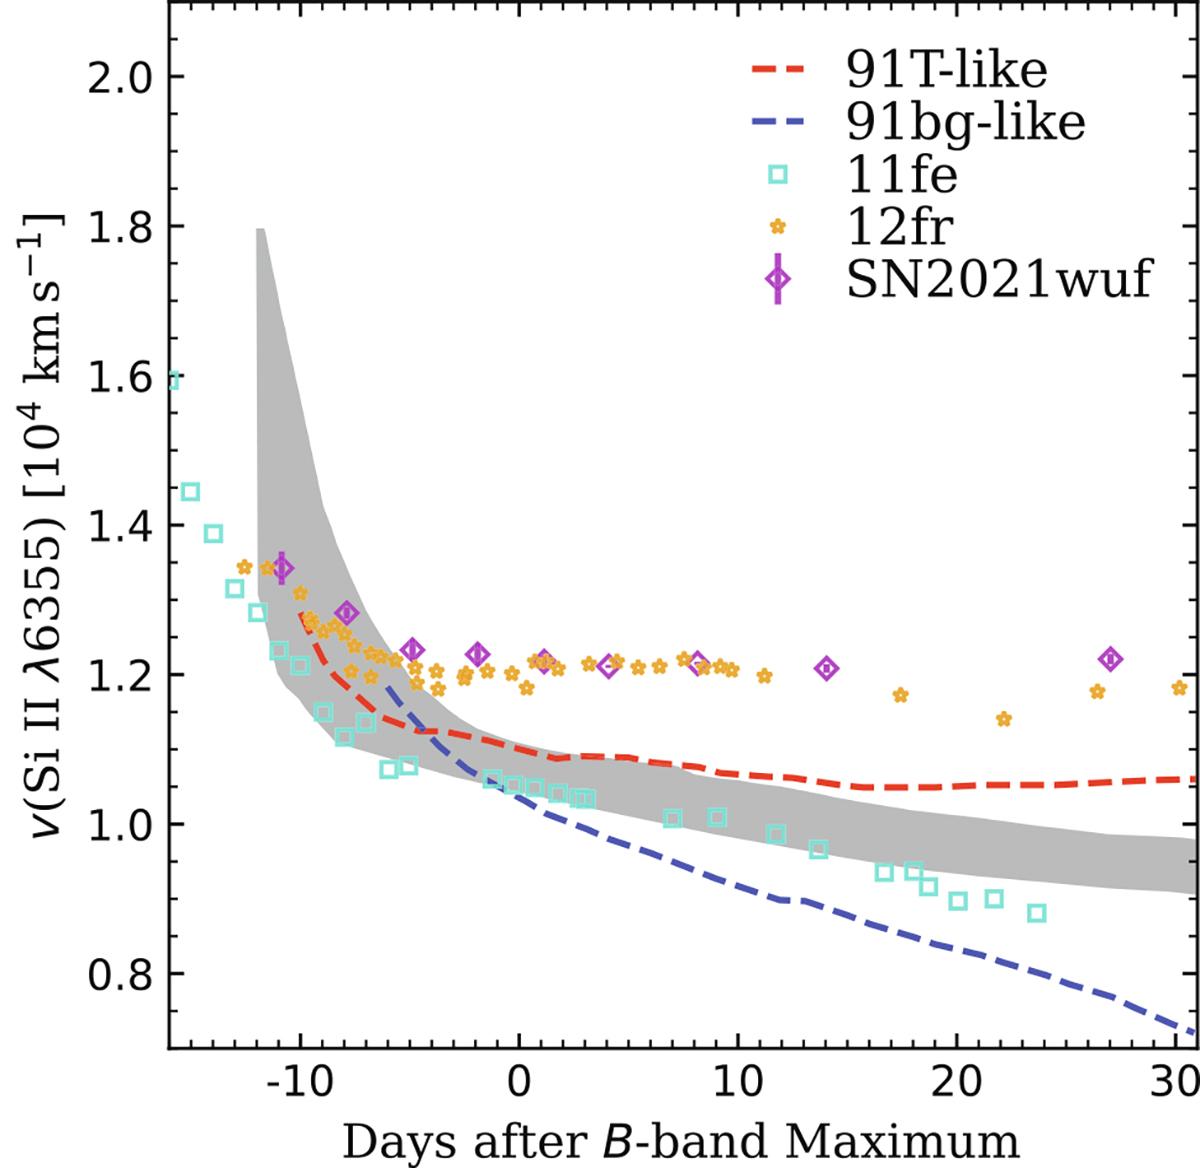
Ejecta velocity evolution of SN 2021wuf is compared with that of SNe 2011fe and 2012fr. The average velocity evolution curves obtained for SN 1991T-like and SN 1991bg-like SNe are overplotted as red and blue dashed lines, respectively. Velocities were measured from the minimum of their Si IIλ6355 absorption lines. The shaded region indicates the 1σ uncertainty of the mean velocity evolution curve for HV SNe Ia as derived from Wang et al. (2009a). Data for the comparison SNe and the region of normal SNe Ia are extracted from Li et al. (2019).
Current usage metrics show cumulative count of Article Views (full-text article views including HTML views, PDF and ePub downloads, according to the available data) and Abstracts Views on Vision4Press platform.
Data correspond to usage on the plateform after 2015. The current usage metrics is available 48-96 hours after online publication and is updated daily on week days.
Initial download of the metrics may take a while.