| Issue |
A&A
Volume 691, November 2024
|
|
|---|---|---|
| Article Number | A69 | |
| Number of page(s) | 11 | |
| Section | Extragalactic astronomy | |
| DOI | https://doi.org/10.1051/0004-6361/202450541 | |
| Published online | 29 October 2024 | |
An optically dark merging system at z ∼ 6 detected by JWST
1
Department of Physics and Astronomy, Università degli Studi di Padova, Vicolo dell’Osservatorio 3, I-35122 Padova, Italy
2
INAF – Osservatorio Astronomico di Padova, Vicolo dell’Osservatorio 5, I-35122 Padova, Italy
3
University of Bologna – Department of Physics and Astronomy “Augusto Righi” (DIFA), Via Gobetti 93/2, I-40129 Bologna, Italy
4
INAF – Osservatorio di Astrofisica e Scienza dello Spazio, Via Gobetti 93/3, I-40129 Bologna, Italy
5
INAF – Istituto di Radioastronomia, Via Gobetti 101, I-40129 Bologna, Italy
6
Scuola Internazionale Superiore Studi Avanzati (SISSA), Physics Area, Via Bonomea 265, I-34136 Trieste, Italy
7
Institute for Fundamental Physics of the Universe (IFPU), Via Beirut 2, I-34014 Trieste, Italy
8
Istituto Nazionale Fisica Nucleare (INFN), Sezione di Trieste, Via Valerio 2, I-34127 Trieste, Italy
9
Scuola Normale Superiore, Piazza dei Cavalieri 7, I-56126 Pisa, Italy
10
Département d’Astronomie, Université de Genève, Chemin Pegasi 51, 1290 Versoix, Switzerland
11
INAF – Osservatorio Astronomico di Roma, Via Frascati 33, I-00078 Monteporzio Catone, Rome, Italy
12
INAF – Osservatorio di Astrofisica e Scienza dello Spazio (OAS), Via Gobetti 101, I-40129 Bologna, Italy
⋆ Corresponding author; This email address is being protected from spambots. You need JavaScript enabled to view it.
Received:
29
April 2024
Accepted:
26
August 2024
Abstract
Context. Near- to mid-infrared observations (from Spitzer and JWST) have revealed a hidden population of galaxies at redshift z = 3 − 6 called optically dark objects, which are believed to be massive and dusty star-formers. They contribute substantially to the cosmic star-formation rate (SFR) density at z ∼ 4 − 5 (up to 30 − 40%).
Aims. While optically dark sources are widely recognized as a significant component of the stellar mass function, the history of their stellar mass assembly (and the evolution of their interstellar medium) remains unexplored. However, they are thought to be the progenitors of the more massive early-type galaxies found in present-day groups and clusters. It is thus important to examine the possible connection between dark sources and merging events in order to understand the environment in which they live.
Methods. Here, we report our search for close companions in a sample of 19 optically-dark objects identified in the SMACS0723 JWST deep field. They were selected in the NIRCam F444W band and undetected below 2 μm. We restricted our analysis to the reddest (i.e., F277W–F444W > 1.3) and brightest (F444W < 26 mag) objects.
Results. We identified KLAMA, an optically dark source showing a very close companion (angular distance < 0.5″). The spatially resolved SED fitting procedure indicates that all components lying within 1.5″ of who is it the dark source are indeed at z ∼ 5.7. Tidal features (leading to a whale-shaped morphology) corroborate the hypothesis that KLAMA is the most massive (log(M⋆/M⊙) > 10.3) and dusty (AV ∼ 3 at the core) system of an ongoing merger with a mass ratio of ∼10. Thus, around ten similar merger events would be required to double the stellar mass of KLAMA. Merging systems with properties similar to KLAMA are identified in the SERRA simulations, allowing us to reconstruct their stellar-mass assembly history and predict their molecular gas properties (in particular, the [CII] emission for the simulated system).
Conclusions. The discovery of mergers within dark galaxies at the end of the Epoch of Reionization highlights the importance of conducting a statistical search for additional candidates in deep NIRCam fields. Such research will aid in our understanding of the significance of merging processes during the obscured phase of stellar-mass accumulation.
Key words: galaxies: evolution / galaxies: formation / galaxies: groups: general / galaxies: high-redshift / galaxies: interactions
© The Authors 2024
 Open Access article, published by EDP Sciences, under the terms of the Creative Commons Attribution License (https://creativecommons.org/licenses/by/4.0), which permits unrestricted use, distribution, and reproduction in any medium, provided the original work is properly cited.
This article is published in open access under the Subscribe to Open model. This email address is being protected from spambots. You need JavaScript enabled to view it. to support open access publication.
1. Introduction
While the formation of stars in cosmic structures has been a pivotal observational focus for many decades, modern astronomical facilities are continuously revising the timeline for the emergence of the first galaxies. In this quest, the Hubble Space Telescope has been a pioneering force, particularly in its exploration of high-redshift galaxies through their rest-frame ultraviolet (UV) emission. These high-redshift galaxies, called Lyman break galaxies (LBG) for their distinctive selection method, have undergone extensive scrutiny, spanning from approximately z ∼ 3 to z ∼ 11 (e.g. Reddy & Steidel 2009; McLure et al. 2013; Finkelstein et al. 2015; Oesch et al. 2016; Ono et al. 2018; Atek et al. 2018. These galaxies typically exhibit moderate star formation rates (SFR) and stellar masses, and they make up a significant portion of the galaxy population. However, despite thorough research into these “normal”, unobscured galaxies, full understanding of the entire galaxy population remains incomplete beyond z > 3. Such incompleteness arises because systematic selections based on rest-frame UV often miss massive, obscured sources. In addition, the physical properties of these obscured sources, such as redshift, stellar mass, and SFR, are often difficult to constrain from the available spectral energy distribution (SED).
Such bias also affects the measurement of the star-formation rate density (SFRD) of the Universe (e.g., Madau & Dickinson 2014). The SFRD reaches its peak around z ≈ 1 − 3, an era commonly referred to as Cosmic Noon, and then experiences a rapid decline up to the present epoch. However, numerous investigations indicate that the fraction of the SFRD obscured by dust, not considered in optical/UV surveys at z > 2, is likely significant (up to 30 − 40%) and increases with redshift, at least up to z ≈ 5 − 7 (e.g., Novak et al. 2017; Gruppioni et al. 2020; Jones et al. 2020; Fudamoto et al. 2021; Barrufet et al. 2023a; Fujimoto et al. 2023; Algera et al. 2023; Xiao et al. 2023a; Barrufet et al. 2023b).
A significant population of optically dark galaxies (ODGs) emitting relatively bright infrared (IR) or sub-millimeter (sub-mm) radiation has been discovered in Spitzer (Werner et al. 2004) data. Some ODGs have been detected using the Atacama Large Millimeter/submillimeter Array (ALMA, e.g. Wang et al. 2016; Xiao et al. 2023a,b) and radio telescopes (Talia et al. 2021; Enia et al. 2022). These galaxies have very red colors and remain undetected, even in the deepest Hubble Space Telescope (HST) band observations (Rodighiero et al. 2007; Sun et al. 2024).
The James Webb Space Telescope (JWST) is now transforming our understanding of optically dark objects, enabling the detection of galaxies much fainter than Spitzer-detected ones at z > 3 (i.e., [F444W] > 25 mag). Various NIRCam color combinations have been proposed to identify such massive and dusty systems, in particular through an F277W–F444W cut. The reddest selection (e.g., F277W–F444W > 1.5) has proven to include a “triality” (as in Pérez-González et al. 2023) of different populations: (1) red AGNs at 4 < z < 8 (called “little red dots” for their point-like morphology) that, however, are flat in the UV and steep in the optical rest frame of their SED (Labbe et al. 2023; Furtak et al. 2023; Greene et al. 2023; Kokorev et al. 2024; Pérez-González et al. 2024; Kocevski et al. 2024); (2) passive sources dominated by old stellar populations at 3 < z < 5 (e.g. Carnall et al. 2023a; Valentino et al. 2023); (3) massive star-forming systems at 3 < z < 8 (Akins et al. 2023; Barrufet et al. 2023a; Rodighiero et al. 2023; Gottumukkala et al. 2023; Barro et al. 2023). The latter has been confirmed to provide a dominant contribution to both the obscured SFR density at 3 < z < 8 (Williams et al. 2023) and to the high-mass end of the stellar-mass function at similar epochs (Rodighiero et al. 2007; Gottumukkala et al. 2023).
The clustering properties of ODGs at z ∼ 4 (in particular for a sample of dusty H-dropouts, Wang et al. 2019) suggest that some of these objects could reside in the most massive dark-matter halos at the epoch of observation, making them likely progenitors of the biggest early-type galaxies in today’s groups and clusters. The current consensus on the formation and evolution of cluster cores and Brightest Cluster galaxies (BCG) is that their stellar mass forms early (z > 4) in separate galaxies (De Lucia et al. 2006) that eventually assemble the main structure at late times (z < 1). Understanding how these massive galaxies form and evolve over time and what regulates and eventually shuts off their star formation are open questions in the field of galaxy evolution.
At Cosmic Noon and beyond, some studies (e.g. Clements et al. 2014; Dannerbauer et al. 2014; Casey 2016; Kato et al. 2016) report an increase in the SFRD on the order of magnitudes, when compared to the average field values at the same z, in the volumes filled by the cores of dusty protoclusters.
Moreover, a blind [CII] line search at z ∼ 5 (ALPINE survey, Loiacono et al. 2021) found that, for sources residing in overdense regions, the resulting SFRD is ten times higher than the corresponding the field value. Similar results were obtained for sources serendipitously detected in the continuum by ALMA (Gruppioni et al. 2020). These hints of enhanced SFRD in highly dense regions could be driven by the larger gas/stellar mass content of clustered dusty galaxies and by environmental processes (Lemaux et al. 2022).
A systematic study of the clustering properties of optically dark galaxies in the JWST era is still missing. However, the role of the environment can be investigated by studying the presence of local overdensities around such massive systems. In particular, the role of galaxy mergers and interactions in the growth and evolution of the reddest galaxies is fundamental to our understanding of the Universe. Interactions among galaxies are crucial in shaping their physical characteristics, and these significantly contribute to their mass accumulation and growth, leading to morphological changes and frequently culminating in mergers (Toomre & Toomre 1972). At high redshifts, major mergers are expected and observed to increase their significance, with their fraction scaling as (1 + z)2 − 3 up to z ∼ 5 − 6 (e.g. Rodriguez-Gomez et al. 2015; Ventou et al. 2017; Snyder et al. 2017; Romano et al. 2021) and approaching a constant value at higher redshifts (e.g. Dalmasso et al. 2024).
Many merger systems have already been identified at z > 5 − 6 with HST, the JWST, and ALMA. These include some ultra-luminous IR galaxies at z ∼ 7 (e.g. Hygate et al. 2023) and UV-bright Lyman α emitters at z ∼ 6.6 (e.g. Ouchi et al. 2013; Boyett et al. 2024). However, the direct detection of a merger with high-resolution optical imaging associated with a classical optically dark galaxy has not been reported yet (but see the “Jekyll & Hide” analogue case at lower redshift, Schreiber et al. 2018). This work is thus a pilot study aimed at characterizing the physical condition of the candidate group. A systematic search of mergers, including even fainter ODGs, is necessary to probe their statistical impact in the assembly of massive sources.
Here, we report the discovery of a candidate multiple merger at z ∼ 6, involving one of the F444W/NIRCam brightest dark objects identified in the early JWST observations in the SMACS0723 field. The presence of a close blue companion and the evidence of some tidal features classify this source (called KLAMA, see Rodighiero et al. 2023, hereafter R23) as a group of galaxies whose stellar-mass content is dominated by the optically dark system. While this system is quite unique among the public JWST extragalactic fields, its existence highlights the importance of environmentally driven processes in feeding the stellar-mass assembly (such as galaxy interactions) of the most obscured systems when the Universe was just one billion years old (see also Gentile et al. 2024). This work is thus a pilot study aimed at characterizing the physical properties of the candidate group. A systematic search for mergers, including even fainter HST-dark objects, is necessary in order to probe their statistical impact in the assembly of massive sources.
The paper is structured as follows. In Sect. 2, we describe the JWST dataset adopted for our analyses. In Sect. 3, we report the selection of optically dark systems presenting a close companion, while Sect. 4 describes the spatially resolved study that we adopted to derive the physical properties of the sample. The main results are reported in Sect. 5 and compared to hydrodynamical simulations in Sect. 6. Throughout the paper, we assume a ΛCDM cosmology with parameters from Planck Collaboration XIII (2016) and a Chabrier (2003) initial mass function (IMF).
2. NIRCam JWST observations of SMACS0723
The initial images of SMACS0723, obtained using the NIRCam and MIRI instruments, showcase the exceptional quality of the JWST’s observations (Pontoppidan et al. 2022a). The Early Release Observations were designed to confirm the JWST’s capability of capturing high-redshift galaxies with unparalleled depth, surpassing the capabilities of HST and ground-based telescopes. SMACS0723 is one of the 41 most massive galaxy clusters identified by Planck at redshifts around z ∼ 0.2 − 1.0, a target of the HST program RELICS (Reionization Lensing Cluster Survey).
The NIRCam instrument focused on SMACS0723, allocating one detector to the cluster and the other to an adjacent off-field region. Exposures were conducted with NIRCam filters F090W, F150W, F200W, F277W, F356W, and F444W, each lasting approximately 7500 seconds. This resulted in a 5σ sensitivity limit of approximately 28.5 − 29.6 AB in magnitude for point-like sources. These depths are comparable to those achieved with WFC3/IR for the HUDF12 pointing (Koekemoer et al. 2013), and they exhibit a sensitivity level ten times greater than the deepest Spitzer/IRAC imaging available at 3.6 and 4.5 μm. NIRCam reduced images are available from the Mikulski Archive for Space Telescopes (MAST)1. In this work, we adopted the NIRCam mosaic produced with the GRIZLI pipeline (Brammer & Matharu 2021)2.
3. Searching for mergers among optically dark objects in the SMACS0723 field
3.1. Merger selection
We explored the existence of close companions within a set of optically dark galaxies, which were selected to be candidate massive and dusty sources at z > 3. We focused on a pilot sample of 19 sources (presented in Rodighiero et al. 2023) that we derived from the Early Release Observations (ERO) of the SMACS0723 field (Pontoppidan et al. 2022b). The selection was based on a catalogue of F444W detections at the 5σ limit of [F444W] < 29 mag, lacking an F200W counterpart in blind photometric catalogs obtained with SExtractor. Such a dropout technique naturally classifies these sources as optically dark objects. We note that, after selection, we performed ad hoc photometry on each object of the sample. This refined procedure, better accounting for the local variation of the sky background, has turned some non-detections at wavelengths shorter than F200W in the preliminary SExtractor catalogs into faint detections (see R23 for details).
As we were mainly interested in identifying merging processes in massive dust-obscured sources at z > 3 in this study, we limited our analysis to the reddest objects. To this aim, we applied a conservative color cut of F277W–F444W > 1.3 mag in order to maximize the probability of identifying high-z dusty sources. We relaxed more extreme criteria such as those adopted by Akins et al. (2023, F277W–F444W > 1.8 mag) and Barro et al. (2023, F277W–F444W > 1.5 mag) in order to account for the scatter due to the photometric uncertainties in the NIRCam bands. We also imposed a flux cut of [F444W] < 26 mag (roughly corresponding to a stellar mass of log(M⋆/M⊙) = 10.5 at z ∼ 6) to limit our investigation to the most massive candidates. Among the 19 sources of R23, seven objects have colors redder than F277W–F444W > 1.3 (with values spanning the 1.3 − 5 mag range), but only one source stands with a magnitude [F444W] < 26.00 (KLAMA, as dubbed in R23).
Here, we neglect the effect of lensing magnification, since the targeted source is located at 1.4′ from the cluster core. In support of this assumption, we note that Castellano et al. (2016) showed that the parallel observations of Hubble Frontiers Fields have little magnification (e.g., 10−15% at most).
The NIRCam images of the selected source are presented in Fig. 1. In the next sections, we provide an in-depth investigation of the morphological and spatially resolved photometric properties of KLAMA and of its local environment.
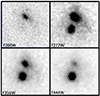 |
Fig. 1. NIRCam cutouts for KLAMA, including filters F200W, F277W, F356W, and F444W (from top left to bottom right, respectively; north is up, east at left). The size of each postage stamp is 1.5″ × 1.5″. KLAMA is the southern source, clearly undetected in the F200W band. A bluer companion is located at 0.4″ in the northern direction. The nature of the two objects is further discussed in the paper. |
3.2. KLAMA: A candidate merging system
As is clearly visible in Fig. 1, KLAMA is an F200W dropout source, resolved in all bands where it is detected. A nearby source is found around 0.4″ from the galaxy center, toward the north. Since we are interested in identifying potential mergers among optically dark sources, understanding if the two objects in the small field of view (1.5″ × 1.5″) of Fig. 1 are physically associated or if they simply sit along the same line of sight is relevant.
It is interesting to zoom out from the small region shown in Fig. 1 to better characterize the environment in a larger volume around the potential double system. This is presented in Fig. 2 (left panel), where we report a NIRCam color map (RGB image combining F200W, F277W, and F444W filters) in the immediate surrounding region (i.e., 3″ × 3″) to look for the presence of other potential companions.
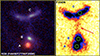 |
Fig. 2. Left panel: RGB image of the KLAMA system (Red = F444W, Green = F277W, Blue = F200W). For reference, the yellow square marks a (3″ × 3″) area. We indicate the three components of the galaxy group with capital letters (A, B, and C). KLAMA is the reddest source (A). Right panel: F356W highly contrasted image of the same region shown in the left panel. The three components are indicated. Interestingly, a diffuse emission clearly rises as a bridge (marked with the red arrow) connecting the main system (A+B) to the tail (C). The green circles represent the apertures (equal to the FWHM of the F444W PSF) and the positions used to extract the photometry for the Bagpipes fit. |
The reddest object in the bottom part of the field (A component) is KLAMA, which has a bluer close companion (B component). This snapshot reveals the presence of an elongated structure in the upper part of the map (which we mark as the C component). While the blue colors of B and C might naturally indicate a different redshift as compared to the red A source (KLAMA), in the next section we provide evidence of a physical connection among the three components. Once the photometric analysis of this system is presented in Sect. 5.1, we further discuss the eventual presence of large overdensities in the SMACS0723 field at the same photo-z of the KLAMA group.
To enhance the color bimodality among objects A and B, in Fig. 3 (left panel) we report a spatially resolved color-magnitude diagram (i.e., F277W–F444W versus F444W) of the pair. Red- and blue-filled circles correspond to the values of each pixel (at the original size of the NIRCam detector pixels) of each source (A and B, respectively). The spatial separation between the two sources is based on a SExtractor segmentation map. The right panel shows the distribution of the F277W–F444W color in the sky plane. Clearly, the central part of KLAMA turns out to be up to two magnitudes redder than its potential companion, reaching values as red as those of the very dusty galaxies at z > 4 (e.g. Akins et al. 2023; Bisigello et al. 2023; Barro et al. 2023; Williams et al. 2023).
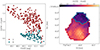 |
Fig. 3. Left panel: Spatially resolved color magnitude diagram for KLAMA and its closest companion (components A/red and B/blue, respectively). Each filled circle corresponds to a pixel of the parent source, as detailed in the right panel. Right panel: F277W–F444W color map for sources A and B. The color scale highlights the gradient from KLAMA toward the companion. The spatial separation between the two sources is based on a SExtractor segmentation map. The boundaries are marked with solid red and blue lines for components A and B (respectively). The pixel size is that of the original NIRCam detector. |
4. Methodology
The superb angular resolution achievable with the JWST allows us to probe the optical morphology of galaxies up to z ∼ 6 − 8, translating into physical scales of 0.7 − 0.5 kpc. In this work, we maximize the photometric information, appreciable in Fig. 1, by adopting a spatially resolved SED-fitting approach to study the KLAMA system (for clarity, in the following, we refer to KLAMA as only to the A component, while we call the Whale the whole system composed by A+B+C. This method has already been successfully applied to estimate photometric redshifts and stellar population properties on a pixel-by-pixel basis in JWST samples (see Pérez-González et al. 2023; García-Argumánez et al. 2023 for a detailed methodological discussion; see also Abdurro’uf et al. 2023).
4.1. Source segmentation
From a visual inspection of the RGB image (left panel of Fig. 2), it is clear how the system can be decomposed into three components:
-
A, the southernmost redder component (i.e., KLAMA);
-
B, its companion, with bluer colors;
-
C, a more extended uppermost component, which could in principle be subdivided into two other components reminiscent of two highly inclined spiral galaxies.
We recovered the same results of the visual inspection by applying the Source Extraction and Photometry library (SEP, Barbary 2016), a Python-wrapper of SEXtractor (Bertin & Arnouts 1996), to the available maps. This segmentation is then applied in the following sections, describing individual properties of the sources composing the system.
4.2. Spatially resolved SED fitting
In the following paragraph, we briefly summarize our multiwavelength, spatially-resolved procedure, while we demand a more accurate description in a forthcoming publication (Enia et al., in prep.). The full procedure follows three steps:
-
(i)
degradation of each image to a spatial resolution equal to the lowest available (in our case, that provided by the F444W band; i.e., 0.14″);
-
(ii)
measuring the flux and associated error in every pixel for each filter;
-
(iii)
SED-fitting, deriving the physical properties on the scale of individual pixels.
4.2.1. PSF-matching and photometry
The first step is to degrade the resolution of all the available maps to the lowest one. In this case, we have six filters, ranging from 0.9 μm to 4.4 μm, with the lowest one being the F444W filter. We thus convolved all the other filters using the convolution kernels built following Aniano et al. (2011)3, matching each observation with the PSF of F444W. When dealing with weight images (or error ones), we performed the convolution step with the square of the convolution kernels.
All the images are at the same pixel scale (0.04″), so there is no need to re-bin them to match the scale. However, we grouped pixels into 3 × 3 pools to match the PSF of the F444W image, summing (or square-summing, for error images) the single pixel fluxes within the pool. This is to reduce the impact of information correlation between close pixels due to the PSF-convolution smearing. In the end, the sampled scales are of 0.12″, corresponding to physical scales of ∼0.7 kpc at z ∼ 6.
At the end of this step, we have a three-dimensional datacube, containing all the fluxes at each (3 × 3 pool of) pixels per band in the spaxels.
4.2.2. SED-fitting with Bagpipes
We performed SED-fitting with Bagpipes (Carnall et al. 2018), an algorithm widely used in extragalactic astronomy (Strait et al. 2021) to recover the photometric redshifts and physical properties of the first detected sources in the first JWST public releases (Akins et al. 2023; Donnan et al. 2023; Carnall et al. 2023a,b), and for a spatially resolved analysis (Giménez-Arteaga et al. 2023). When operating at full capacity, Bagpipes is able to simultaneously deal with spectral and broad-band photometric information coming from the same source. Here, we only deal with the latter, as no spectroscopic information is available at the moment. We only fit the spaxels belonging to the above-mentioned A, B, and C components obtained after image segmentation, thus ensuring that a satisfying signal-to-noise ratio is achieved (i.e., S/N > 3).
Differently from the released version of Bagpipes, we refine the definition of likelihood in the code in order to properly account for upper limits to our photometric measurements, which are present in the outskirts of KLAMA in the shorter wavelength filters, following the recipe in Eq. (8) of Sawicki (2012).
Following Rodighiero et al. (2023), we fit the star-formation histories with an exponentially declining τ-model, SFH ∝ exp−t/τ, with uniform priors on τ between 0.01 and 10 Gyr and time since the beginning of the star formation between 0.001 and 14 Gyr. All of these – as the following ones – are uniform priors. Stellar metallicity is left free to vary between 0.005 and 2.5 solar metallicities, and the total mass-formed priors are 1.0 < log(M⋆/M⊙) < 12.5. We also include a nebular component with logarithm of the ionization parameter varying between −4 and −2. As for the dust, we used a Calzetti attenuation law (Calzetti et al. 2000) with AV priors between 0 and 6. The spaxels’ photo-z is left as a free parameter, varying between 0 and a maximum of 15, except in the run where we fixed the redshift of all the components at 5.7 (see Sect. 5.1 for further details).
From the PDFs provided by Bagpipes, we took the 16th, 50th, and 84th percentiles to estimate the fiducial value and errors of the parameters. We also verified that the results are consistent when taking the maximum-likelihood estimator from the PDFs. We now have a catalog of all the recovered photo-zs and physical properties (such as stellar masses, SFR, and dust attenuation) of each spaxel from which we can start our data analysis.
5. Results
5.1. Photometric redshift of the system
We ran Bagpipes over all beam-convoluted pixels, in a region covering the whole system. The most relevant information lies in the determination of the photometric redshift for the three components; this allows us to statistically evaluate the likelihood that they are, indeed, a physically bound system.
We first consider the results drawn from lux measurements extracted from a fixed aperture centered on the brightest pixel in each of the three components. The angular size (corresponding to the FWHM in the F444W filter) and the positions of these three apertures are reported as green circles in Fig. 2 (right panel). For components A and B, they coincide with the luminous centers of their host galaxies, while for the elongated structure C it corresponds to the position of a likely star-forming clump. These apertures represent the less contaminated regions of each component (in particular for A and B) in terms of flux from nearby objects polluting the surrounding environment.
In Fig. 4 (top panel), we report the PDF(z) for these three small regions. KLAMA (red histogram) shows a bimodal distribution, with a primary solution of z ∼ 5.7 and a secondary peak at z ∼ 10 (associated with the position of the Balmer or Lyman break, respectively). The identification of such a bright source at z > 10 would correspond to a very massive galaxy (M⋆ > 1011 M⊙), challenging standard cosmological models (e.g. Menci et al. 2022; Boylan-Kolchin 2023; Lovell et al. 2023). The B component (blue histogram) has a very narrow and peaked solution at the same low-z solution of KLAMA (i.e., z ∼ 6). This preliminary result suggests that A and B could formally be a physical pair of sources sitting in the same cosmic volume (which would correspond to a physical distance between their centers of ∼2.5 kpc).
Interestingly, even if the northern arc-like structure (C, orange histogram) has a primary photo-z at z < 1, it shows a likelihood compatible with the redshift of the main doublet. The hypothesis that source C is linked to A and B is corroborated by the evidence of a diffuse emission in the highly contrasted NIRCam image (see right panel of Fig. 2, F356W map), acting as a bridge between the main pair (A+B) and the morphologically disturbed C component. Even if we cannot exclude this emission being background noise, we consider the possibility that it is the result of a tidal interaction within the galaxy group.
To account for the global information available from the spatially resolved methodology, we illustrate the results of a luminosity-weighted scheme, averaging the PDF(z) of all the pixels belonging to the parent object, in the bottom panel of Fig. 4. It can be seen that KLAMA (A) still has the highest probability of lying at z ∼ 6, maintaining the degeneracy of being an LBG at higher z (z > 10). Component B maintains an almost monotonic solution at z ∼ 6, while component C broadens its primary peak at z < 3, but retains a possible (minor) secondary solution compatible with z ∼ 6.
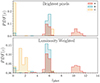 |
Fig. 4. Top panel – brightest pixels: Probability distribution functions of the photometric redshift solutions derived by fitting the brightest convoluted pixel of each source (A, B, and C) with Bagpipes at the positions indicated by the green circles in the right panel of Fig. 2. Each of the three components (A, B, and C) is represented with a different color, as marked in the legend. Bottom panel – all pixels: Luminosity-weighted PDF of the redshifts from all the (convoluted) pixels belonging to a source. |
This analysis illustrates the intrinsic level of degeneracy in the photo-z derivation of optically dark sources selected through JWST photometry and the urgent need for spectroscopic confirmation.
In the following, we concentrate our analysis and discussion on the assumption that all three components of the system are at the same redshift, i.e., z ∼ 6. This choice is mainly driven by the PDF(z) of the brightest pixels for A and B and by the presence of tidal features in the system. To strengthen the latter hypothesis, we studied the significance of the diffuse emission connecting components B and C, already highlighted in the F356W map (Fig. 2, right panel), in more detail. As a similar elongated light distribution appears in other NIRCam bands, in Fig. 5 we present the S/N spatial distribution obtained by coadding the F277W, F356W, and F444W images (all convolved to the same PSF of the F444W band). The color scale shows the value of S/N in each pixel. It can be seen that the bridge connecting B and C includes many pixels with significant flux signal (S/N > 3). Averaging the S/N of all the pixels included in this area (see green solid contour in Fig. 5), we obtain a S/N of ∼2.85. This value is not formally significant, but it probes that the diffuse emission is unlikely associated with pure noise and that it might be unravelling a low surface-brightness feature produced by a tidal interaction among some components of the group.
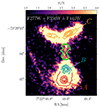 |
Fig. 5. Signal-to-noise spatial distribution of the candidate-merging system derived by co-adding three NIRCam maps (F277W, F356W, and F444W) after convolution to the longest wavelength. The color bar marks the range of S/N variation across the pixels. The solid lines indicate contours of equal S/N for the three components of the system (red: A; light blue: B; orange: C). Five equally spaced contours are shown, starting from a S/N of five up to the maximum. The diffuse tidal emission between B and C presents various pixels with an S/N > 3 and an average S/N of ∼2.85 (computed within the region delimited by the green solid line). |
Finally, we investigated the possibility that the KLAMA group is sitting on a larger scale structure. To this aim, we performed a statistical analysis of the photometric catalog of NIRCam-detected sources in the SMACS0723 field. As reference, we adopted version 7 of the public catalog provided by G. Brammer at the Dawn JWST archive4. The catalog includes photometric redshifts computed with EAZY-PY5 (Brammer et al. 2008). The derived redshift distribution does not present any significant excess in the 5.5 < z < 6.5 range (i.e., roughly corresponding to the width of the primary peak of the PDF distribution around z ∼ 5.7; see Fig. 4). Moreover, we verified that the closest source to the dark merger, with a compatible photo-z, is located at a distance of 14.5″ from component A. This would correspond to a physical distance of ∼86 kpc. Understanding the likelihood of a gravitational connection between this source and the main system would require further dynamical analysis, which is beyond the scope of this paper. These preliminary results, however, do not provide evidence of a clear galaxy overdensity at the redshift of the KLAMA group.
5.2. Physical properties of a merging system at z = 5.7
We assumed a value of z = 5.7 for the photometric redshift of the system, corresponding to the 50th percentile of the PDF(z) of the main component A (see Fig. 4). We then ran Bagpipes again, this time considering the same parameters as the previous run, but fixing the redshift to the same values for all pixels on the map. The results for the main physical properties are shown in Fig. 6, where we report the spatial distribution of stellar mass (in logarithmic scale; left panel), SFR (in logarithmic scale; central panel), and the extinction parameterized as AV with different color scales. We were then able to derive our general conclusions about the properties of a complex structure with multiple components.
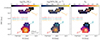 |
Fig. 6. Spatially resolved outputs of Bagpipes run obtained by fixing redshift of all pixels in the system at z = 5.7. The segmentation map obtained from SEP is used to identify the physical regions associated with each of the three main components (A, B, and C) identified in Fig. 2. In the three plots, from left to right, we report the spatial distribution of stellar mass, SFR, and AV, respectively. The pixel size used in this map accounts for the convolution with the PSF in each NIRCam band. In this figure, we adopt the F444W PSF as a reference. In each panel, we report the integrated values of the physical properties obtained for the three separate components. Contours of the F444W flux emission are reported as solid lines in each plot. |
The primary object of our selection, KLAMA (A), is clearly the most luminous component in the F444W band and, thus, the most massive. We computed the integrated values of stellar mass and SFR by simply summing over all the pixels belonging to each source. Figure 6 shows the contours of the segmentation map (generated with SExtractor) used to delimit the boundaries for the integration within each object.
With log(M⋆/M⊙) = 10.3 ± 0.51 and log(SFR/M⊙ yr−1) = 1.91 ± 0.49, KLAMA is a galaxy at z = 5.7 sitting on the main sequence of star-forming galaxies (e.g. Popesso et al. 2023). According to the best-fit model, its extremely red color is due to the dusty nature of this object, reaching values of AV > 3 toward the central core. To obtain an integrated value for AV, we computed the average over all the pixels (see Table 1). The bluer components, B and C, both have negligible (AV < 1) dust attenuation, lower stellar masses, and log(M⋆/M⊙) = 8.85 ± 0.10 and log(M⋆/M⊙) = 8.79 ± 0.10, respectively. Relying on the SFR derived from the SED fitting approach, these values also place the B and C components on the main sequence of star-forming galaxies at z ∼ 6 (Popesso et al. 2023).
A summary of the physical properties of the three components of the system is reported in Table 1.
6. Discussion
In this paper, we report the identification of a candidate multiple-merging system at z ∼ 6, involving a massive, optically dark object with log(M⋆/M⊙)∼10.3 and a smaller bluer source with log(M⋆/M⊙)∼9. It has been suggested that these obscured objects could represent the progenitors of the largest present-day galaxies in massive groups and clusters (Wang et al. 2019). It is thus crucial to monitor how their stellar mass is accumulated through the merging of galaxies in high-density environments at high redshifts, in comparison with the accretion of cold gas flows from the cosmic web (e.g. Kereš et al. 2005; Dekel et al. 2009).
Moreover, galaxy mergers are believed to play a significant role in stellar-mass growth throughout cosmic history. They occur frequently across the timeline of the Universe and can be observed using various methods and at different evolutionary stages. The merging of galaxies is a natural prediction of the hierarchical structure formation model (White & Frenk 1991; Klypin et al. 2011) for which dark matter halos grow their mass and affect the build-up of galaxies in the Universe (e.g. Khochfar & Burkert 2005). Not only can mergers increase the stellar mass of galaxies (up to a factor of 2 for major mergers; e.g. López-Sanjuan et al. 2012; Kaviraj et al. 2014), but they can also trigger starbursts and active galactic nuclei. Recently, new constraints have revealed the presence of a significant merging fraction (i.e., > 30 − 40%) at 4 < z < 6 (Conselice & Arnold 2009; Romano et al. 2021).
Assuming that the whole observed system will eventually merge with time, we can say that the main optically dark A component will increase its stellar mass by ∼10% (if B and C will both merge with A) and that on the order of another ten similar merging events are required to double its mass. To understand the origin and the frequency of merging dusty groups at the epoch of KLAMA, we searched for similar systems within the SERRA simulation suite (Pallottini et al. 2022).
In SERRA, dark-matter gas stars are evolved with a customized version of RAMSES (Teyssier 2002). KROME (Grassi et al. 2014) is adopted in order to follow the nonequilibrium chemistry of up to molecular hydrogen (H2) formation (Bovino et al. 2016; Pallottini et al. 2017a). Radiation is tracked on the fly using RAMSES-RT (Rosdahl et al. 2013), which is coupled to the chemical evolution of the gas (Pallottini et al. 2019; Decataldo et al. 2019). Adopting a Schmidt (1959)–Kennicutt (1998) relation, H2 is converted into stars, which act as a source of mechanical energy, photons, and reprocessed elements according to the metallicity and age of the stellar population (Bertelli et al. 1994). Feedback considers thermal and kinetic energy deposition from supernovae, winds from massive stars, and an approximate treatment of radiation pressure (Pallottini et al. 2017b).
Each of the simulations in the suite starts at z = 100 from cosmological initial conditions and zooms in on a target DM halo (Mh ∼ 1012 M⊙ at z = 6) and its environment – approximately (2 Mpc/h)3 – reaching a gas mass and spatial resolution of ≃1.2 × 10⁴ M⊙ and ≃25 pc at z = 6.3 in the densest regions (i.e., typical mass and size of Galactic molecular clouds).
Exploiting the Kohandel et al. (2024) sample of ∼3000 synthetic observations of SERRA galaxies between 4 ≲ z ≲ 9 (see Kohandel et al. 2020, for the generation of the data cubes), we identify a merging system with physical properties similar to those of the observed one where KLAMA resides. Such a simulated system is presented in Fig. 7, where we report maps of the stellar surface density, gas density, and metallicity (in the left, middle,and right panels, respectively). The central object is “Adenia”, a z = 6.3 galaxy with a stellar mass of log(M⋆/M⊙) = 10.1, log(SFR/M⊙ yr−1) = 1.62, and an average AV = 0.7 mag that reaches values as high as AV ∼ 5 − 6 mag in the central 0.7 kpc (corresponding to the physical scale of the innermost beam of KLAMA; see Fig. 6). All these values, and the presence of a companion source at a physical distance of ∼4 kpc, similar to those of components A and B in Fig. 2 (∼3 kpc), showcase that sources such as KLAMA are predicted to exist in state-of-the-art cosmological simulations.
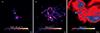 |
Fig. 7. A z = 6.3 merging system found in the SERRA simulation suite (Pallottini et al. 2022) selected from the Kohandel et al. (2024) sample. The central galaxy (“Adenia”) has log(M⋆/M⊙) = 10.1 and SFR ≃ 42 M⊙ yr−1; its kinematics at z ∼ 7.7 was analyzed in Rizzo et al. (2022). The physical scale of the snapshots is reported in the top left corner of each panel (i.e., 1 kpc). The stellar surface density (Σ⋆), average gas density (n), and metallicity (z) distributions are shown in the left, middle, and right panels, respectively. |
The gas-density distribution (middle panel of Fig. 7) highlights the presence of gas streams as the fossil record of the gravitational interactions that involved Adenia in a spherical volume with an ∼10 kpc diameter. This view allows us to better pinpoint the similarity between the simulation with the observation. Indeed, the potential tidal features bridging the “tail” and the “head” of the Whale system (see right panel of Fig. 2) are explained by the complex dynamical interactions among the sources of the group in the simulation.
We studied Adenia’s past merger history to infer the stellar-mass build-up of KLAMA. This is presented in Fig. 8 (left panel), where the merger tree of the central simulated SERRA galaxy, now at z ≃ 6.3, is shown. Multiple mergers have contributed to the stellar-mass growth of Adenia, the latest being, at the age of ∼848 Myr, between two massive galaxies with mass ratios of ∼10. This is intriguingly similar to the stellar-mass ratio of the observed component A with respect to the less massive B+C objects. In the right panel of Fig. 8, we also report the star-formation history of Adenia, showing different starburst events likely associated with a few dramatic merger events. Furthermore, the physical properties of the interstellar medium of Adenia (characterized by high levels of obscuration) allow for the prediction of its observability at submillimeter wavelengths. In particular, the [CII] total luminosity of the central galaxy in the simulation is LCII ∼ 1.7 × 10⁸ L⊙ with an FWHM of ∼530 km s−1. For a firm detection with the Atacama Large Millimeter Array (ALMA), it would take ∼10 − 25 hours of observation, depending on the inclination (face-on/edge-on) of the system, without accounting for the need for spectral scans; this would therefore be challenging, but feasible.
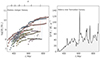 |
Fig. 8. Left panel: Merger history of Adenia, a simulated SERRA galaxy similar to KLAMA. Individual lines show the galaxies’ stellar mass (M*) eventually merging with Adenia as a function of cosmic time (t; redshift z is indicated in the upper axis). Each galaxy track is indicated with a different color; solid lines indicate when the different galaxies evolve as dynamical distinct systems according to the ROCKSTAR phase-space clump finder (Behroozi et al. 2013) and dashed lines highlight the merging events; see Pallottini et al. (2022, in particular Sect. 2.4.1), for details of the merger history computation. Right panel: Star formation history of Adenia as a function of the lookback time with respect to z = 6.3, when the galaxy is experiencing a merger (see Fig. 7). |
The overall physical properties of KLAMA also suggest that this system could be similar to the well-known submillimeter galaxy (SMG) HFD850.1 (Hughes et al. 1998), a heavily dust-obscured merging galaxy at z = 5.18 (Neri et al. 2014). The stellar component of the source was recently resolved by NIRCam (Sun et al. 2024), revealing a stellar mass of log(M⋆/M⊙) = 10.8 ± 0.1. HFD850.1 is among the first discoveries of optical/near-IR-dark SMGs, and it is sitting in a well-characterized galaxy overdense region, suggesting that up to ∼50% of the cosmic SFRD at z ∼ 5.0 − 5.5 could be contributed by sources in protocluster structures (Sun et al. 2024, and references therein). It is thus natural to complement the submillimeter search for elusive high-z obscured groups and protoclusters with deep, near-IR surveys, currently achievable with the JWST (see Fig. 9).
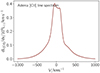 |
Fig. 9. Synthetic [CII] spectra from galaxy Adenia. The spectrum shows an integrated luminosity of L[CII] ≃ 1.7 × 10⁸ L⊙ and full width at half maximum of ≃530 km s−1. The line emission was computed from the simulated galaxy by using cell-by CLOUDY models (Ferland et al. 2017) accounting for the local interstellar radiation field, the gas properties (density, metallicity, proper motion, etc.), and the turbulent structure of molecular clouds (Vallini et al. 2018; Pallottini et al. 2019; Kohandel et al. 2019). |
The conclusions of this work are based on just one object, and further statistical investigation is needed to obtain a definitive answer with regard to the role of merging in the stellar-mass assembly of dusty system at z ∼ 5 − 6. However, our results (based on the comparison of simulations with observations) show strong evidence in support of the fact that mergers are an essential driver of the galaxy’s build-up during the obscured star-formation phase, at least up to the end of the Epoch of Reionization.
7. Summary
In this paper, we present and discuss a single case of a massive, optically dark source (selected through its red F277W–F444W color) likely undergoing a merging process. The detection of these interactions within a dusty galaxy group, occurring right at the conclusion of the Epoch of Reionization, directs focus toward the significance of mergers in the assembly of stellar mass and their impact on the cosmic SFR at high redshifts. We summarize the main findings below:
-
We looked for companions in a sample of ODGs in the SMACS0723 field. The brightest F444W source (with an integrated magnitude on the order of [F444W] ∼ 25 mag) shows a close-by, bluer companion at a distance of < 0.5″ and a secondary elongated object (potentially showing multiple components) at ∼1.5″. The latter is connected to the southern pairs by some tidal features (making the morphology of the group similar to that of a whale).
-
Exploiting the multiwavelength NIRCam observations in this sky region, we convolved each image to the lowest angular resolution (i.e., that of the F444W band). We then performed a spatially resolved SED fitting on each PSF-matched pixel to derive the physical properties of this galaxy system.
-
We found that all the components of the group are consistent with a photometric redshift of z ∼ 5.7. The darkest object turns out to be a massive and dusty galaxy, with log(M⋆/M⊙) = 10.3 ± 0.51, log(SFR/M⊙ yr−1) = 1.91 ± 0.49 and AV ∼ 3 in the central reddest portion of the object. The group’s other sources are bluer and show negligible dust attenuation. The mass ratio between the more massive source and the other surrounding companions is on the order of 1/10. The physical spatial extension of the whole system is ∼10 kpc at z = 5.7.
-
Finally, we investigated the light cones in the SERRA cosmological simulation, and we identified a source showing the same physical and environmental properties of the Whale group presented in this paper (including the presence of companions with the same mass ratio of the observed system within an ∼10 kpc physical distance). The simulation thus allowed us to infer the stellar-mass assembly history of a massive, dusty, optically dark source, showing that multiple merger events are required to build up such an evolved system in times as early as the end of the EoR. Such objects could be directly studied through their [CII] emission line.
-
The conclusions drawn from this study rely on a single object, indicating the need for further statistical investigation to definitively determine the role of merging in the stellar mass assembly of dusty systems at z ∼ 5 − 6. Nevertheless, our findings, supported by comparisons between simulations and observations, strongly suggest that mergers play a crucial role in galaxy formation during the obscured star formation phase, at least until the end of the Epoch of Reionization.
We caution that in order to provide a quantitative measurement of the role of the local environment in the most obscured and massive system from Cosmic Dawn to Cosmic Noon, it is mandatory to perform a systematic analysis of statistical samples (in both observations and simulations). In a future work (Girardi et al., in prep.), we will carry out an in-depth search for physical companions of optically dark sources across all available extragalactic JWST fields.
We also remind the reader that a spectroscopic confirmation is required to unravel the nature and the redshift of the KLAMA system. While submillimeter observations with ALMA have already identified mergers in obscured systems at z ∼ 5 − 6 (e.g. Romano et al. 2021), the JWST represents the ideal instrument to resolve the KLAMA puzzle (in particular the NIRSpec Integral Field Unit, which perfectly matches the field of view of our target; see left panel of Fig. 2).
Available here: https://www.astro.princeton.edu/~draine/Kernels.html
Acknowledgments
G.R., B.V., G.G. and A.G. are supported by the European Union – NextGenerationEU RFF M4C2 1.1 PRIN 2022 project 2022ZSL4BL INSIGHT. G.R., L.B. and A.E. also acknowledge the support from MIUR grant PRIN 2017 20173ML3WW-0013. A.B. and G.R. acknowledge support from INAF under the Large Grant 2022 funding scheme (project “MeerKAT and LOFAR Team up: a Unique Radio Window on Galaxy/AGN co-Evolution”). B.V. acknowledges support from the INAF Mini Grant 2022 “Tracing filaments through cosmic time” (PI: Vulcani). We also acknowledge support from the INAF Large Grant 2022 “Extragalactic Surveys with JWST” (PI: Pentericci). M.K., A.P., and A.F. acknowledge the CINECA award under the ISCRA initiative for the availability of high-performance computing resources and support from the Class B project SERRA HP10BPUZ8F (PI: Pallottini). M.K., A.P., and A.F. gratefully acknowledge the computational resources of the Center for High-Performance Computing (CHPC) at SNS. A.F. acknowledges support from the ERC Advanced Grant INTERSTELLAR H2020/740120 (PI: Ferrara). Any dissemination of results must indicate that it reflects only the author’s view and that the Commission is not responsible for any use that may be made of the information it contains. Partial support (A.F.) from the Carl Friedrich von Siemens-Forschungspreis der Alexander von Humboldt-Stiftung Research Award is kindly acknowledged.
References
- Abdurro’uf, Coe, D., Jung, I., et al. 2023, ApJ, 945, 117 [CrossRef] [Google Scholar]
- Akins, H. B., Casey, C. M., Allen, N., et al. 2023, ApJ, 956, 61 [NASA ADS] [CrossRef] [Google Scholar]
- Algera, H. S. B., Inami, H., Oesch, P. A., et al. 2023, MNRAS, 518, 6142 [Google Scholar]
- Aniano, G., Draine, B. T., Gordon, K. D., & Sandstrom, K. 2011, PASP, 123, 1218 [Google Scholar]
- Atek, H., Richard, J., Kneib, J.-P., & Schaerer, D. 2018, MNRAS, 479, 5184 [Google Scholar]
- Barbary, K. 2016, J. Open Source Softw., 1, 58 [Google Scholar]
- Barro, G., Perez-Gonzalez, P. G., Kocevski, D. D., et al. 2023, ArXiv e-prints [arXiv:2305.14418] [Google Scholar]
- Barrufet, L., Oesch, P. A., Weibel, A., et al. 2023a, MNRAS, 522, 449 [NASA ADS] [CrossRef] [Google Scholar]
- Barrufet, L., Oesch, P. A., Bouwens, R., et al. 2023b, MNRAS, 522, 3926 [NASA ADS] [CrossRef] [Google Scholar]
- Behroozi, P. S., Wechsler, R. H., & Wu, H.-Y. 2013, ApJ, 762, 109 [NASA ADS] [CrossRef] [Google Scholar]
- Bertelli, G., Bressan, A., Chiosi, C., Fagotto, F., & Nasi, E. 1994, A&AS, 106, 275 [NASA ADS] [Google Scholar]
- Bertin, E., & Arnouts, S. 1996, A&AS, 117, 393 [NASA ADS] [CrossRef] [EDP Sciences] [Google Scholar]
- Bisigello, L., Gandolfi, G., Grazian, A., et al. 2023, A&A, 676, A76 [NASA ADS] [CrossRef] [EDP Sciences] [Google Scholar]
- Bovino, S., Grassi, T., Capelo, P. R., Schleicher, D. R. G., & Banerjee, R. 2016, A&A, 590, A15 [NASA ADS] [CrossRef] [EDP Sciences] [Google Scholar]
- Boyett, K., Trenti, M., Leethochawalit, N., et al. 2024, Nat. Astron., accepted [arXiv:2303.00306] [Google Scholar]
- Boylan-Kolchin, M. 2023, Nat. Astron., 7, 731 [NASA ADS] [CrossRef] [Google Scholar]
- Brammer, G., & Matharu, J. 2021, https://doi.org/10.5281/zenodo.5012699 [Google Scholar]
- Brammer, G. B., van Dokkum, P. G., & Coppi, P. 2008, ApJ, 686, 1503 [Google Scholar]
- Calzetti, D., Armus, L., Bohlin, R. C., et al. 2000, ApJ, 533, 682 [NASA ADS] [CrossRef] [Google Scholar]
- Carnall, A. C., McLure, R. J., Dunlop, J. S., & Davé, R. 2018, MNRAS, 480, 4379 [Google Scholar]
- Carnall, A. C., McLeod, D. J., McLure, R. J., et al. 2023a, MNRAS, 520, 3974 [NASA ADS] [CrossRef] [Google Scholar]
- Carnall, A. C., McLure, R. J., Dunlop, J. S., et al. 2023b, Nature, 619, 716 [NASA ADS] [CrossRef] [Google Scholar]
- Casey, C. M. 2016, ApJ, 824, 36 [CrossRef] [Google Scholar]
- Castellano, M., Amorín, R., Merlin, E., et al. 2016, A&A, 590, A31 [NASA ADS] [CrossRef] [EDP Sciences] [Google Scholar]
- Chabrier, G. 2003, PASP, 115, 763 [Google Scholar]
- Clements, D. L., Braglia, F. G., Hyde, A. K., et al. 2014, MNRAS, 439, 1193 [NASA ADS] [CrossRef] [Google Scholar]
- Conselice, C. J., & Arnold, J. 2009, MNRAS, 397, 208 [NASA ADS] [CrossRef] [Google Scholar]
- Dalmasso, N., Calabrò, A., Leethochawalit, N., et al. 2024, ArXiv e-prints [arXiv:2403.11428] [Google Scholar]
- Dannerbauer, H., Kurk, J. D., De Breuck, C., et al. 2014, A&A, 570, A55 [NASA ADS] [CrossRef] [EDP Sciences] [Google Scholar]
- De Lucia, G., Springel, V., White, S. D. M., Croton, D., & Kauffmann, G. 2006, MNRAS, 366, 499 [NASA ADS] [CrossRef] [Google Scholar]
- Decataldo, D., Pallottini, A., Ferrara, A., Vallini, L., & Gallerani, S. 2019, MNRAS, 487, 3377 [Google Scholar]
- Dekel, A., Birnboim, Y., Engel, G., et al. 2009, Nature, 457, 451 [Google Scholar]
- Donnan, C. T., McLeod, D. J., McLure, R. J., et al. 2023, MNRAS, 520, 4554 [NASA ADS] [CrossRef] [Google Scholar]
- Enia, A., Talia, M., Pozzi, F., et al. 2022, ApJ, 927, 204 [NASA ADS] [CrossRef] [Google Scholar]
- Ferland, G. J., Chatzikos, M., Guzmán, F., et al. 2017, Rev. Mex. Astron. Astrofis., 53, 385 [NASA ADS] [Google Scholar]
- Finkelstein, S. L., Ryan, R. E., Papovich, C., et al. 2015, ApJ, 810, 71 [NASA ADS] [CrossRef] [Google Scholar]
- Fudamoto, Y., Oesch, P. A., Schouws, S., et al. 2021, Nature, 597, 489 [CrossRef] [Google Scholar]
- Fujimoto, S., Kohno, K., Ouchi, M., et al. 2023, ArXiv e-prints [arXiv:2303.01658] [Google Scholar]
- Furtak, L. J., Zitrin, A., Plat, A., et al. 2023, ApJ, 952, 142 [NASA ADS] [CrossRef] [Google Scholar]
- García-Argumánez, Á., Pérez-González, P. G., Gil de Paz, A., et al. 2023, ApJ, 944, 3 [CrossRef] [Google Scholar]
- Gentile, F., Talia, M., Daddi, E., et al. 2024, A&A, 687, A288 [NASA ADS] [CrossRef] [EDP Sciences] [Google Scholar]
- Giménez-Arteaga, C., Oesch, P. A., Brammer, G. B., et al. 2023, ApJ, 948, 126 [CrossRef] [Google Scholar]
- Gottumukkala, R., Barrufet, L., Oesch, P. A., et al. 2023, ArXiv e-prints [arXiv:2310.03787] [Google Scholar]
- Grassi, T., Bovino, S., Schleicher, D. R. G., et al. 2014, MNRAS, 439, 2386 [Google Scholar]
- Greene, J. E., Labbe, I., Goulding, A. D., et al. 2023, ArXiv e-prints [arXiv:2309.05714] [Google Scholar]
- Gruppioni, C., Béthermin, M., Loiacono, F., et al. 2020, A&A, 643, A8 [NASA ADS] [CrossRef] [EDP Sciences] [Google Scholar]
- Hughes, D. H., Serjeant, S., Dunlop, J., et al. 1998, Nature, 394, 241 [Google Scholar]
- Hygate, A. P. S., Hodge, J. A., da Cunha, E., et al. 2023, MNRAS, 524, 1775 [NASA ADS] [CrossRef] [Google Scholar]
- Jones, G. C., Béthermin, M., Fudamoto, Y., et al. 2020, MNRAS, 491, L18 [Google Scholar]
- Kato, Y., Matsuda, Y., Smail, I., et al. 2016, MNRAS, 460, 3861 [Google Scholar]
- Kaviraj, S., Huertas-Company, M., Cohen, S., et al. 2014, MNRAS, 443, 1861 [CrossRef] [Google Scholar]
- Kennicutt, R. C. 1998, ApJ, 498, 541 [NASA ADS] [CrossRef] [Google Scholar]
- Kereš, D., Katz, N., Weinberg, D. H., & Davé, R. 2005, MNRAS, 363, 2 [Google Scholar]
- Khochfar, S., & Burkert, A. 2005, MNRAS, 359, 1379 [NASA ADS] [CrossRef] [Google Scholar]
- Klypin, A. A., Trujillo-Gomez, S., & Primack, J. 2011, ApJ, 740, 102 [NASA ADS] [CrossRef] [Google Scholar]
- Kocevski, D. D., Finkelstein, S. L., Barro, G., et al. 2024, ArXiv e-prints [arXiv:2404.03576] [Google Scholar]
- Koekemoer, A. M., Ellis, R. S., McLure, R. J., et al. 2013, ApJS, 209, 3 [Google Scholar]
- Kohandel, M., Pallottini, A., Ferrara, A., et al. 2019, MNRAS, 487, 3007 [NASA ADS] [CrossRef] [Google Scholar]
- Kohandel, M., Pallottini, A., Ferrara, A., et al. 2020, MNRAS, 499, 1250 [Google Scholar]
- Kohandel, M., Pallottini, A., Ferrara, A., et al. 2024, A&A, 685, A72 [NASA ADS] [CrossRef] [EDP Sciences] [Google Scholar]
- Kokorev, V., Caputi, K. I., Greene, J. E., et al. 2024, ArXiv e-prints [arXiv:2401.09981] [Google Scholar]
- Labbe, I., Greene, J. E., Bezanson, R., et al. 2023, ArXiv e-prints [arXiv:2306.07320] [Google Scholar]
- Lemaux, B. C., Cucciati, O., Le Fèvre, O., et al. 2022, A&A, 662, A33 [NASA ADS] [CrossRef] [EDP Sciences] [Google Scholar]
- Loiacono, F., Decarli, R., Gruppioni, C., et al. 2021, A&A, 646, A76 [EDP Sciences] [Google Scholar]
- López-Sanjuan, C., Le Fèvre, O., Ilbert, O., et al. 2012, A&A, 548, A7 [Google Scholar]
- Lovell, C. C., Harrison, I., Harikane, Y., Tacchella, S., & Wilkins, S. M. 2023, MNRAS, 518, 2511 [Google Scholar]
- Madau, P., & Dickinson, M. 2014, ARA&A, 52, 415 [Google Scholar]
- McLure, R. J., Dunlop, J. S., Bowler, R. A. A., et al. 2013, MNRAS, 432, 2696 [Google Scholar]
- Menci, N., Castellano, M., Santini, P., et al. 2022, ApJ, 938, L5 [NASA ADS] [CrossRef] [Google Scholar]
- Neri, R., Downes, D., Cox, P., & Walter, F. 2014, A&A, 562, A35 [NASA ADS] [CrossRef] [EDP Sciences] [Google Scholar]
- Novak, M., Smolčić, V., Delhaize, J., et al. 2017, A&A, 602, A5 [NASA ADS] [CrossRef] [EDP Sciences] [Google Scholar]
- Oesch, P. A., Brammer, G., van Dokkum, P. G., et al. 2016, ApJ, 819, 129 [NASA ADS] [CrossRef] [Google Scholar]
- Ono, Y., Ouchi, M., Harikane, Y., et al. 2018, PASJ, 70, S10 [Google Scholar]
- Ouchi, M., Ellis, R., Ono, Y., et al. 2013, ApJ, 778, 102 [NASA ADS] [CrossRef] [Google Scholar]
- Pallottini, A., Ferrara, A., Bovino, S., et al. 2017a, MNRAS, 471, 4128 [NASA ADS] [CrossRef] [Google Scholar]
- Pallottini, A., Ferrara, A., Gallerani, S., et al. 2017b, MNRAS, 465, 2540 [CrossRef] [Google Scholar]
- Pallottini, A., Ferrara, A., Decataldo, D., et al. 2019, MNRAS, 487, 1689 [Google Scholar]
- Pallottini, A., Ferrara, A., Gallerani, S., et al. 2022, MNRAS, 513, 5621 [NASA ADS] [Google Scholar]
- Pérez-González, P. G., Barro, G., Annunziatella, M., et al. 2023, ApJ, 946, L16 [CrossRef] [Google Scholar]
- Pérez-González, P. G., Barro, G., Rieke, G. H., et al. 2024, ArXiv e-prints [arXiv:2401.08782] [Google Scholar]
- Planck Collaboration XIII. 2016, A&A, 594, A13 [NASA ADS] [CrossRef] [EDP Sciences] [Google Scholar]
- Pontoppidan, K., Blome, C., Braun, H., et al. 2022a, ArXiv e-prints [arXiv:2207.13067] [Google Scholar]
- Pontoppidan, K. M., Barrientes, J., Blome, C., et al. 2022b, ApJ, 936, L14 [NASA ADS] [CrossRef] [Google Scholar]
- Popesso, P., Concas, A., Cresci, G., et al. 2023, MNRAS, 519, 1526 [Google Scholar]
- Reddy, N. A., & Steidel, C. C. 2009, ApJ, 692, 778 [Google Scholar]
- Rizzo, F., Kohandel, M., Pallottini, A., et al. 2022, A&A, 667, A5 [NASA ADS] [CrossRef] [EDP Sciences] [Google Scholar]
- Rodighiero, G., Cimatti, A., Franceschini, A., et al. 2007, A&A, 470, 21 [NASA ADS] [CrossRef] [EDP Sciences] [Google Scholar]
- Rodighiero, G., Bisigello, L., Iani, E., et al. 2023, MNRAS, 518, L19 [Google Scholar]
- Rodriguez-Gomez, V., Genel, S., Vogelsberger, M., et al. 2015, MNRAS, 449, 49 [Google Scholar]
- Romano, M., Cassata, P., Morselli, L., et al. 2021, A&A, 653, A111 [NASA ADS] [CrossRef] [EDP Sciences] [Google Scholar]
- Rosdahl, J., Blaizot, J., Aubert, D., Stranex, T., & Teyssier, R. 2013, MNRAS, 436, 2188 [Google Scholar]
- Sawicki, M. 2012, PASP, 124, 1208 [NASA ADS] [CrossRef] [Google Scholar]
- Schmidt, M. 1959, ApJ, 129, 243 [NASA ADS] [CrossRef] [Google Scholar]
- Schreiber, C., Labbé, I., Glazebrook, K., et al. 2018, A&A, 611, A22 [NASA ADS] [CrossRef] [EDP Sciences] [Google Scholar]
- Snyder, G. F., Lotz, J. M., Rodriguez-Gomez, V., et al. 2017, MNRAS, 468, 207 [NASA ADS] [CrossRef] [Google Scholar]
- Strait, V., Bradač, M., Coe, D., et al. 2021, ApJ, 910, 135 [NASA ADS] [CrossRef] [Google Scholar]
- Sun, F., Helton, J. M., Egami, E., et al. 2024, ApJ, 961, 69 [NASA ADS] [CrossRef] [Google Scholar]
- Talia, M., Cimatti, A., Giulietti, M., et al. 2021, ApJ, 909, 23 [NASA ADS] [CrossRef] [Google Scholar]
- Teyssier, R. 2002, A&A, 385, 337 [CrossRef] [EDP Sciences] [Google Scholar]
- Toomre, A., & Toomre, J. 1972, ApJ, 178, 623 [Google Scholar]
- Valentino, F., Brammer, G., Gould, K. M. L., et al. 2023, ApJ, 947, 20 [NASA ADS] [CrossRef] [Google Scholar]
- Vallini, L., Pallottini, A., Ferrara, A., et al. 2018, MNRAS, 473, 271 [NASA ADS] [CrossRef] [Google Scholar]
- Ventou, E., Contini, T., Bouché, N., et al. 2017, A&A, 608, A9 [NASA ADS] [CrossRef] [EDP Sciences] [Google Scholar]
- Wang, T., Elbaz, D., Schreiber, C., et al. 2016, ApJ, 816, 84 [Google Scholar]
- Wang, T., Schreiber, C., Elbaz, C., et al. 2019, ArXiv e-prints [arXiv:1908.02372] [Google Scholar]
- Werner, M. W., Roellig, T. L., Low, F. J., et al. 2004, ApJS, 154, 1 [NASA ADS] [CrossRef] [Google Scholar]
- White, S. D. M., & Frenk, C. S. 1991, ApJ, 379, 52 [Google Scholar]
- Williams, C. C., Alberts, S., Ji, Z., et al. 2023, ArXiv e-prints [arXiv:2311.07483] [Google Scholar]
- Xiao, M., Oesch, P., Elbaz, D., et al. 2023a, ArXiv e-prints [arXiv:2309.02492] [Google Scholar]
- Xiao, M. Y., Elbaz, D., Gómez-Guijarro, C., et al. 2023b, A&A, 672, A18 [NASA ADS] [CrossRef] [EDP Sciences] [Google Scholar]
All Tables
All Figures
|
Fig. 1. NIRCam cutouts for KLAMA, including filters F200W, F277W, F356W, and F444W (from top left to bottom right, respectively; north is up, east at left). The size of each postage stamp is 1.5″ × 1.5″. KLAMA is the southern source, clearly undetected in the F200W band. A bluer companion is located at 0.4″ in the northern direction. The nature of the two objects is further discussed in the paper. |
| In the text | |
|
Fig. 2. Left panel: RGB image of the KLAMA system (Red = F444W, Green = F277W, Blue = F200W). For reference, the yellow square marks a (3″ × 3″) area. We indicate the three components of the galaxy group with capital letters (A, B, and C). KLAMA is the reddest source (A). Right panel: F356W highly contrasted image of the same region shown in the left panel. The three components are indicated. Interestingly, a diffuse emission clearly rises as a bridge (marked with the red arrow) connecting the main system (A+B) to the tail (C). The green circles represent the apertures (equal to the FWHM of the F444W PSF) and the positions used to extract the photometry for the Bagpipes fit. |
| In the text | |
|
Fig. 3. Left panel: Spatially resolved color magnitude diagram for KLAMA and its closest companion (components A/red and B/blue, respectively). Each filled circle corresponds to a pixel of the parent source, as detailed in the right panel. Right panel: F277W–F444W color map for sources A and B. The color scale highlights the gradient from KLAMA toward the companion. The spatial separation between the two sources is based on a SExtractor segmentation map. The boundaries are marked with solid red and blue lines for components A and B (respectively). The pixel size is that of the original NIRCam detector. |
| In the text | |
|
Fig. 4. Top panel – brightest pixels: Probability distribution functions of the photometric redshift solutions derived by fitting the brightest convoluted pixel of each source (A, B, and C) with Bagpipes at the positions indicated by the green circles in the right panel of Fig. 2. Each of the three components (A, B, and C) is represented with a different color, as marked in the legend. Bottom panel – all pixels: Luminosity-weighted PDF of the redshifts from all the (convoluted) pixels belonging to a source. |
| In the text | |
|
Fig. 5. Signal-to-noise spatial distribution of the candidate-merging system derived by co-adding three NIRCam maps (F277W, F356W, and F444W) after convolution to the longest wavelength. The color bar marks the range of S/N variation across the pixels. The solid lines indicate contours of equal S/N for the three components of the system (red: A; light blue: B; orange: C). Five equally spaced contours are shown, starting from a S/N of five up to the maximum. The diffuse tidal emission between B and C presents various pixels with an S/N > 3 and an average S/N of ∼2.85 (computed within the region delimited by the green solid line). |
| In the text | |
|
Fig. 6. Spatially resolved outputs of Bagpipes run obtained by fixing redshift of all pixels in the system at z = 5.7. The segmentation map obtained from SEP is used to identify the physical regions associated with each of the three main components (A, B, and C) identified in Fig. 2. In the three plots, from left to right, we report the spatial distribution of stellar mass, SFR, and AV, respectively. The pixel size used in this map accounts for the convolution with the PSF in each NIRCam band. In this figure, we adopt the F444W PSF as a reference. In each panel, we report the integrated values of the physical properties obtained for the three separate components. Contours of the F444W flux emission are reported as solid lines in each plot. |
| In the text | |
|
Fig. 7. A z = 6.3 merging system found in the SERRA simulation suite (Pallottini et al. 2022) selected from the Kohandel et al. (2024) sample. The central galaxy (“Adenia”) has log(M⋆/M⊙) = 10.1 and SFR ≃ 42 M⊙ yr−1; its kinematics at z ∼ 7.7 was analyzed in Rizzo et al. (2022). The physical scale of the snapshots is reported in the top left corner of each panel (i.e., 1 kpc). The stellar surface density (Σ⋆), average gas density (n), and metallicity (z) distributions are shown in the left, middle, and right panels, respectively. |
| In the text | |
|
Fig. 8. Left panel: Merger history of Adenia, a simulated SERRA galaxy similar to KLAMA. Individual lines show the galaxies’ stellar mass (M*) eventually merging with Adenia as a function of cosmic time (t; redshift z is indicated in the upper axis). Each galaxy track is indicated with a different color; solid lines indicate when the different galaxies evolve as dynamical distinct systems according to the ROCKSTAR phase-space clump finder (Behroozi et al. 2013) and dashed lines highlight the merging events; see Pallottini et al. (2022, in particular Sect. 2.4.1), for details of the merger history computation. Right panel: Star formation history of Adenia as a function of the lookback time with respect to z = 6.3, when the galaxy is experiencing a merger (see Fig. 7). |
| In the text | |
|
Fig. 9. Synthetic [CII] spectra from galaxy Adenia. The spectrum shows an integrated luminosity of L[CII] ≃ 1.7 × 10⁸ L⊙ and full width at half maximum of ≃530 km s−1. The line emission was computed from the simulated galaxy by using cell-by CLOUDY models (Ferland et al. 2017) accounting for the local interstellar radiation field, the gas properties (density, metallicity, proper motion, etc.), and the turbulent structure of molecular clouds (Vallini et al. 2018; Pallottini et al. 2019; Kohandel et al. 2019). |
| In the text | |
Current usage metrics show cumulative count of Article Views (full-text article views including HTML views, PDF and ePub downloads, according to the available data) and Abstracts Views on Vision4Press platform.
Data correspond to usage on the plateform after 2015. The current usage metrics is available 48-96 hours after online publication and is updated daily on week days.
Initial download of the metrics may take a while.