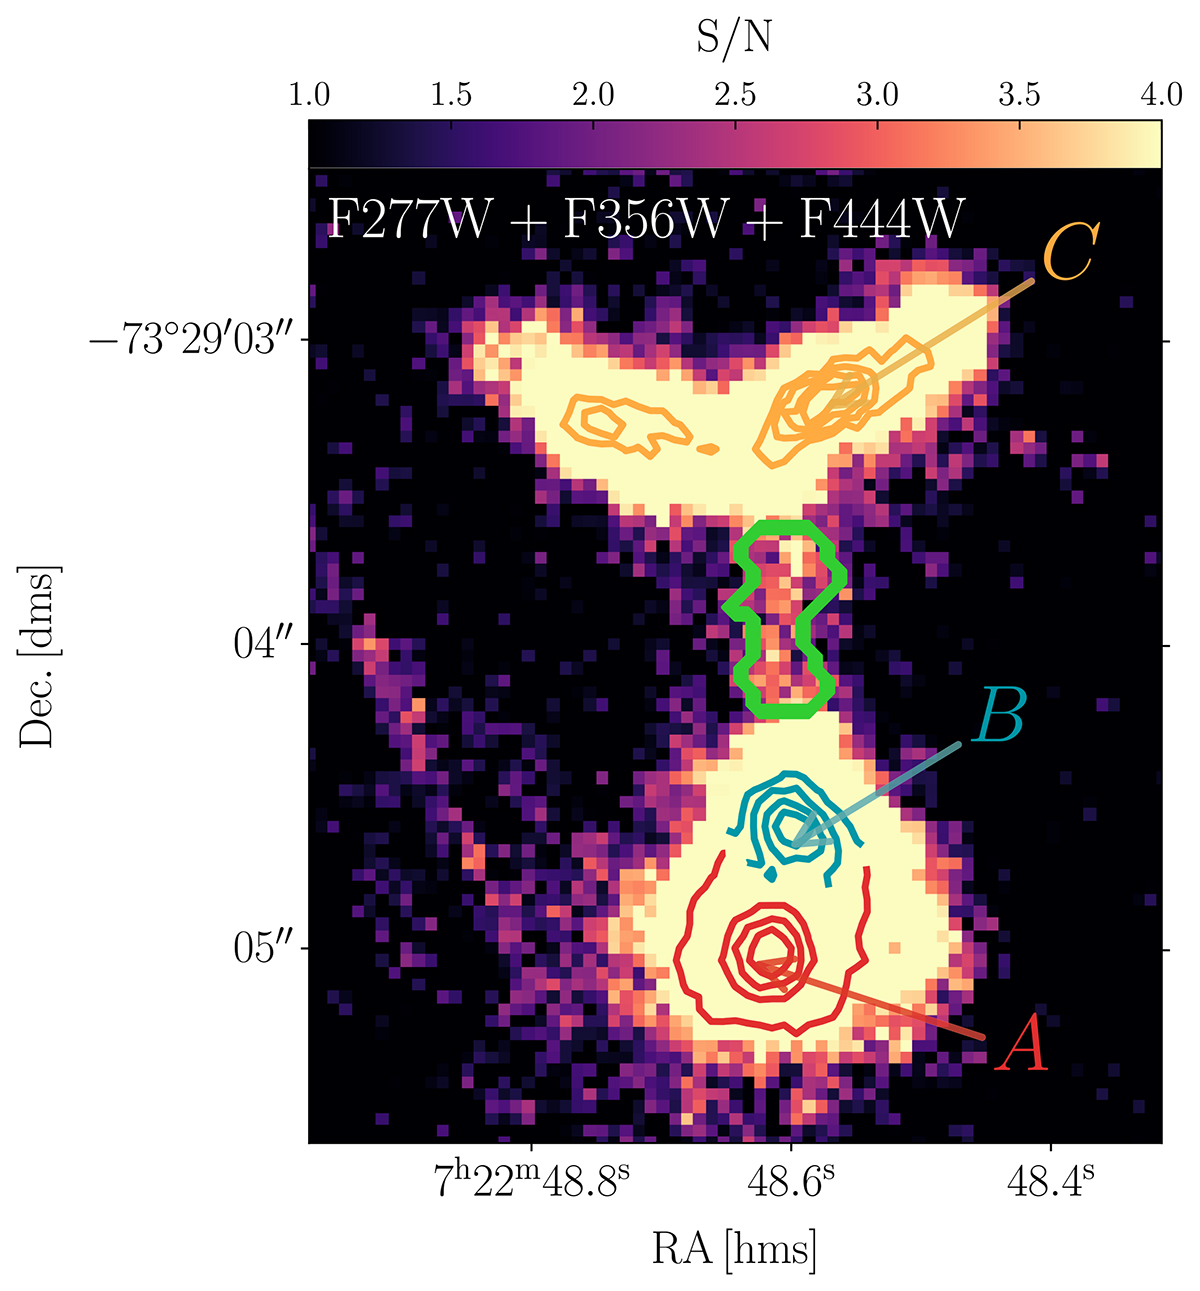
Fig. 5.
Download original image
Signal-to-noise spatial distribution of the candidate-merging system derived by co-adding three NIRCam maps (F277W, F356W, and F444W) after convolution to the longest wavelength. The color bar marks the range of S/N variation across the pixels. The solid lines indicate contours of equal S/N for the three components of the system (red: A; light blue: B; orange: C). Five equally spaced contours are shown, starting from a S/N of five up to the maximum. The diffuse tidal emission between B and C presents various pixels with an S/N > 3 and an average S/N of ∼2.85 (computed within the region delimited by the green solid line).
Current usage metrics show cumulative count of Article Views (full-text article views including HTML views, PDF and ePub downloads, according to the available data) and Abstracts Views on Vision4Press platform.
Data correspond to usage on the plateform after 2015. The current usage metrics is available 48-96 hours after online publication and is updated daily on week days.
Initial download of the metrics may take a while.