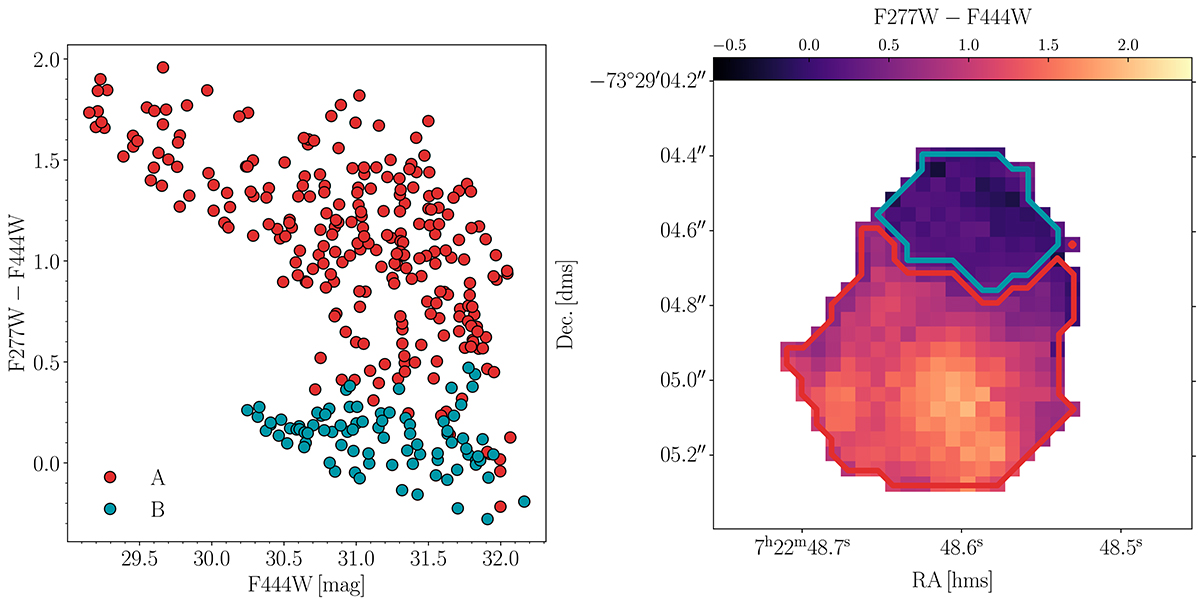
Fig. 3.
Download original image
Left panel: Spatially resolved color magnitude diagram for KLAMA and its closest companion (components A/red and B/blue, respectively). Each filled circle corresponds to a pixel of the parent source, as detailed in the right panel. Right panel: F277W–F444W color map for sources A and B. The color scale highlights the gradient from KLAMA toward the companion. The spatial separation between the two sources is based on a SExtractor segmentation map. The boundaries are marked with solid red and blue lines for components A and B (respectively). The pixel size is that of the original NIRCam detector.
Current usage metrics show cumulative count of Article Views (full-text article views including HTML views, PDF and ePub downloads, according to the available data) and Abstracts Views on Vision4Press platform.
Data correspond to usage on the plateform after 2015. The current usage metrics is available 48-96 hours after online publication and is updated daily on week days.
Initial download of the metrics may take a while.