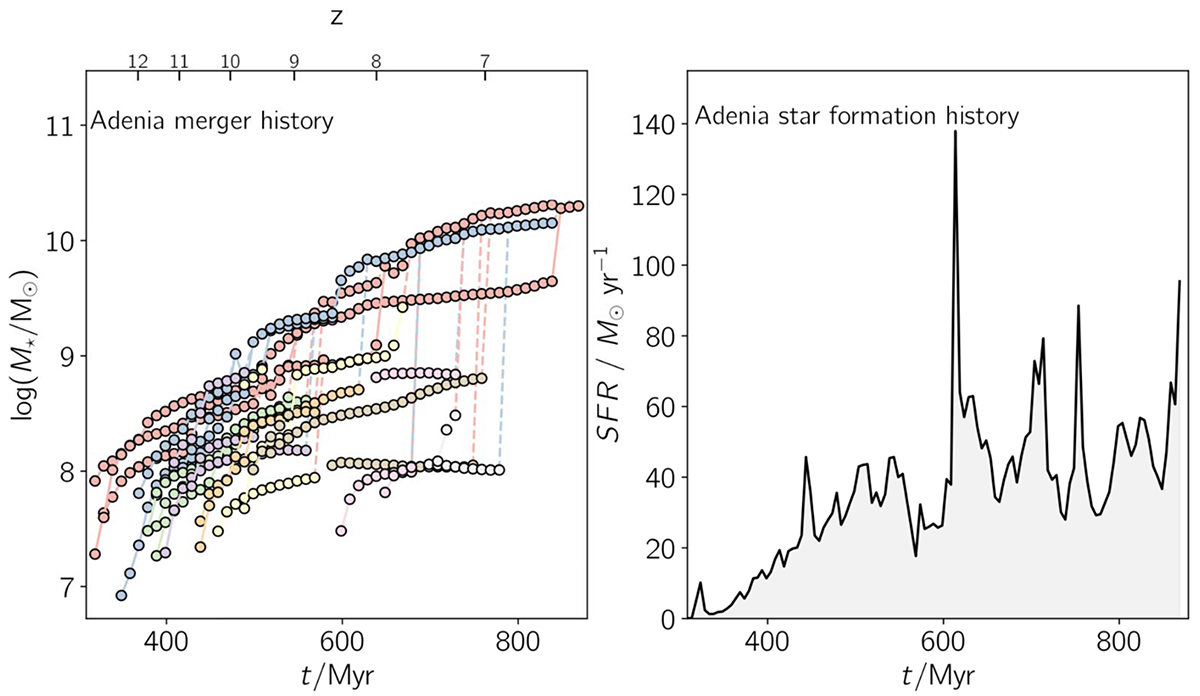
Fig. 8.
Download original image
Left panel: Merger history of Adenia, a simulated SERRA galaxy similar to KLAMA. Individual lines show the galaxies’ stellar mass (M*) eventually merging with Adenia as a function of cosmic time (t; redshift z is indicated in the upper axis). Each galaxy track is indicated with a different color; solid lines indicate when the different galaxies evolve as dynamical distinct systems according to the ROCKSTAR phase-space clump finder (Behroozi et al. 2013) and dashed lines highlight the merging events; see Pallottini et al. (2022, in particular Sect. 2.4.1), for details of the merger history computation. Right panel: Star formation history of Adenia as a function of the lookback time with respect to z = 6.3, when the galaxy is experiencing a merger (see Fig. 7).
Current usage metrics show cumulative count of Article Views (full-text article views including HTML views, PDF and ePub downloads, according to the available data) and Abstracts Views on Vision4Press platform.
Data correspond to usage on the plateform after 2015. The current usage metrics is available 48-96 hours after online publication and is updated daily on week days.
Initial download of the metrics may take a while.