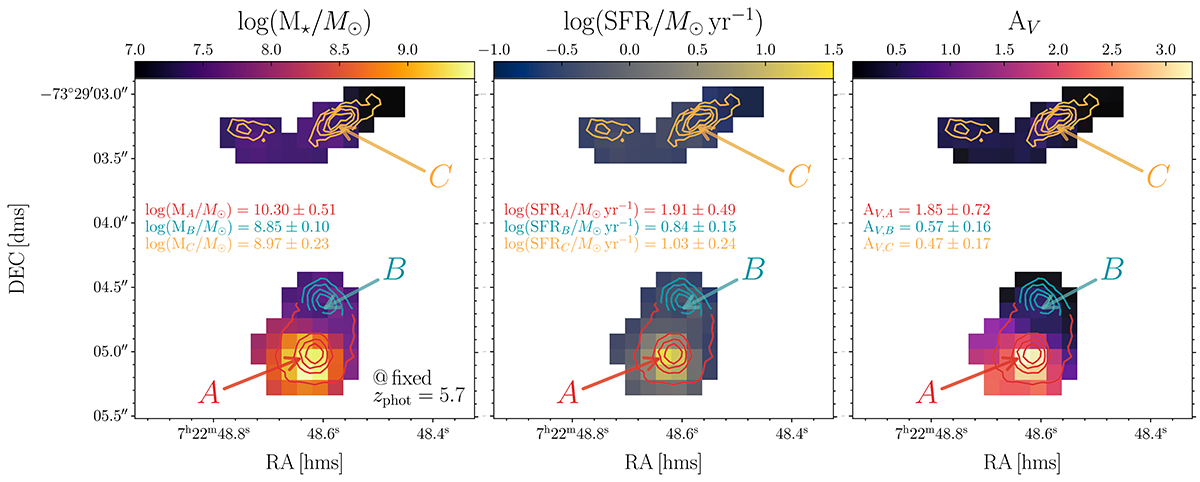
Fig. 6.
Download original image
Spatially resolved outputs of Bagpipes run obtained by fixing redshift of all pixels in the system at z = 5.7. The segmentation map obtained from SEP is used to identify the physical regions associated with each of the three main components (A, B, and C) identified in Fig. 2. In the three plots, from left to right, we report the spatial distribution of stellar mass, SFR, and AV, respectively. The pixel size used in this map accounts for the convolution with the PSF in each NIRCam band. In this figure, we adopt the F444W PSF as a reference. In each panel, we report the integrated values of the physical properties obtained for the three separate components. Contours of the F444W flux emission are reported as solid lines in each plot.
Current usage metrics show cumulative count of Article Views (full-text article views including HTML views, PDF and ePub downloads, according to the available data) and Abstracts Views on Vision4Press platform.
Data correspond to usage on the plateform after 2015. The current usage metrics is available 48-96 hours after online publication and is updated daily on week days.
Initial download of the metrics may take a while.