| Issue |
A&A
Volume 689, September 2024
|
|
|---|---|---|
| Article Number | L4 | |
| Number of page(s) | 14 | |
| Section | Letters to the Editor | |
| DOI | https://doi.org/10.1051/0004-6361/202450988 | |
| Published online | 30 August 2024 | |
Letter to the Editor
PDRs4All
X. ALMA and JWST detection of neutral carbon in the externally irradiated disk d203-506: Undepleted gas-phase carbon
1
Instituto de Física Fundamental (CSIC), Calle Serrano 121-123, 28006 Madrid, Spain
2
Université Paris Cité, Paris, France
3
Chalmers University of Technology, Onsala Space Observatory, Onsala, Sweden
4
Dept. of Astronomy, University of Michigan, Ann Arbor, MI, USA
5
Institut de Recherche en Astrophysique et Planétologie, Université Toulouse III - Paul Sabatier, CNRS, CNES, Toulouse, France
6
LERMA, Observatoire de Paris, PSL Research University, CNRS, Sorbonne Universités, Paris-Meudon, France
7
IRAM, 300 rue de la Piscine, 38406 Saint Martin d’Hères, France
8
Department of Physics and Astronomy, University of Western Ontario, London, Ontario, Canada
9
Institute for Earth and Space Exploration, University of Western Ontario, London, Ontario, Canada
10
Department of Astronomy, The Ohio State University, 140 West 18th Avenue, Columbus, OH 43210, USA
11
Institut des Sciences Moléculaires d’Orsay, CNRS, Université Paris-Saclay, Orsay, France
12
Université Paris-Saclay, CNRS, Institut d’Astrophysique Spatiale, Orsay, France
13
School of Physics and Astronomy, Queen Mary University of London, London E1 4NS, UK
14
Department of Astronomy, Graduate School of Science, University of Tokyo, Tokyo, Japan
15
Carl Sagan Center, SETI Institute, Mountain View, CA, USA
16
Leiden Observatory, Leiden University, Leiden, The Netherlands
17
Astronomy Department, Univ. of Maryland, College Park, MD, USA
18
Space Telescope Science Institute, Baltimore, MD, USA
19
Instituto de Astrofísica e Ciências do Espaçsbon, Lisbon, Portugal
Received:
4
June
2024
Accepted:
7
August
2024
Abstract
The gas-phase abundance of carbon, xC = [C/H]gas = xC+ + xC0 + xCO + … , and its depletion factors are essential parameters for understanding the gas and solid compositions that are ultimately incorporated into (exo)planets. The majority of protoplanetary disks are born in clusters and, as a result, are exposed to external far-ultraviolet (FUV) radiation. These FUV photons potentially affect the disk’s evolution, chemical composition, and line excitation. We present the first detection of the [C I] 609 μm fine-structure (3P1–3P0) line of neutral carbon (C0), achieved with ALMA, toward one of these disks, d203-506, in the Orion Nebula Cluster. We also report the detection of [C I] forbidden and C I permitted lines (from electronically excited states up to ∼10 eV) observed with JWST in the near-infrared (NIR). These lines trace the irradiated outer disk and photo-evaporative wind. Contrary to the common belief that these NIR lines are C+ recombination lines, we find that they are dominated by FUV-pumping of C0 followed by fluorescence cascades. They trace the transition from atomic to molecular gas, and their intensities scale with G0. The lack of outstanding NIR O I fluorescent emission, however, implies a sharper attenuation of external FUV radiation with E ≳ 12 eV (λ ≲ Lyman-β). This is related to a lower effective FUV dust absorption cross section compared to that of interstellar grains, implying a more prominent role for FUV shielding by the C0 photoionization continuum. The [C I] 609 μm line intensity is proportional to N(C0) and can be used to infer xC. We derive xC ≃ 1.4 × 10⁻⁴. This implies that there is no major depletion of volatile carbon compared to xC measured in the natal cloud, hinting at a young disk. We also show that external FUV radiation impacts the outer disk and wind by vertically shifting the water freeze-out depth, which likely results in less efficient grain growth and settling. This shift leads to nearly solar gas-phase C/O abundance ratios in these irradiated layers.
Key words: protoplanetary disks / ISM: abundances / photon-dominated region (PDR)
Corresponding author; This email address is being protected from spambots. You need JavaScript enabled to view it. .
© The Authors 2024
 Open Access article, published by EDP Sciences, under the terms of the Creative Commons Attribution License (https://creativecommons.org/licenses/by/4.0), which permits unrestricted use, distribution, and reproduction in any medium, provided the original work is properly cited.
This article is published in open access under the Subscribe to Open model. This email address is being protected from spambots. You need JavaScript enabled to view it. to support open access publication.
1. Introduction
Tracing the carbon reservoir in protoplanetary disks is essential for understanding the variations in the gaseous elemental carbon-to-oxygen abundance1 ratio, which connects the atmospheric composition of a planet with its formation site (e.g., Öberg et al. 2011, 2023; Madhusudhan 2012; Miotello et al. 2019; Bosman et al. 2021; Mah et al. 2023). In addition, carbon plays a key role in the formation of the complex organics that serve as the foundation for prebiotic chemistry and can be incorporated into planetary systems as they form.
Observations show that the gas-phase CO abundance in 1–10 Myr old disks can be depleted by a factor of 10–100 compared to molecular clouds, even after accounting for freeze-out and photodissociation. This suggests that something happens to CO by ∼1 Myr (Zhang et al. 2020; Bergner et al. 2020). Grain growth, facilitated by the formation of water-rich ice mantles, followed by settling to the midplane and radial drift may explain these depletion factors (Bergin et al. 2016; Krijt et al. 2020). However, the majority of observational studies target “isolated” disks in nearby low-mass star-forming regions such as Taurus, Lupus, Ophiuchus, and Chameleon (at d ∼ 150 pc; e.g., ALMA Partnership et al. 2015; Öberg et al. 2021). Yet, most low-mass stars (and thus planets) are born in clusters that contain one or more high-mass stars (e.g., Lada & Lada 2003). These OB stars emit intense ultraviolet (UV) radiation that illuminates the disk populations that gradually emerge from the natal cloud (e.g., O’Dell et al. 1993). External UV illumination leads to disk mass-loss driven by photo-evaporation (Johnstone et al. 1998; Störzer & Hollenbach 1999; Winter & Haworth 2022) and potentially impacts the properties of planets forming within those disks (Winter et al. 2022; Qiao et al. 2023). However, due to the greater distance to clusters, spectroscopic studies are scarcer (Boyden & Eisner 2020, 2023; Maucó et al. 2023), and it is still a matter of debate whether environmental UV radiation modifies the chemistry of “externally irradiated” disks (Walsh et al. 2013; Ramírez-Tannus et al. 2023; Díaz-Berríos et al. 2024).
The d203-506 system, in the Orion Nebula Cluster (ONC; at d ∼ 400 pc; see Habart et al. 2024), is a remarkable example of a disk around a low-mass star that is externally irradiated by far-ultraviolet (FUV) radiation (∼6 < E < 13.6 eV) with no evidence for the comet-shaped ionization front seen in proplyds (e.g., O’Dell et al. 1993; Ricci et al. 2008). This implies a shielding from ionizing extreme-ultraviolet (EUV) radiation (E > 13.6 eV). The estimated FUV flux from the O-type stars θ1 Ori C and θ2 Ori A is ∼104 times higher than around the profusely studied isolated disks in Taurus-like clouds. Thus, d203-506 may be more representative of the initial conditions of the proto-Solar System disk (Fatuzzo & Adams 2008; Adams 2010; Bergin et al. 2023). This flared and nearly edge-on disk, located toward the Orion Bar (Champion et al. 2017, but see our Appendix A), was first detected by the Hubble Space Telescope in silhouette against the optical nebular background (Bally et al. 2000). More recent Keck, James Webb Space Telescope (JWST), and Very Large Telescope (VLT) Multi Unit Spectroscopic Explorer (MUSE) observations unveiled the extended nature of the FUV-pumped vibrationally excited H2 (hereafter H ) and [C I] 0.8729 μm emissions (Habart et al. 2023; Haworth et al. 2023; Berné et al. 2024).
The JWST PDRs4All team constrained the mass of the host star (∼0.3 M⊙), the disk’s mass (∼10 MJup ≃ 10−2 M⊙) and radius (∼100 au ≃ 0.25″), and a high mass-loss rate due to external photo-evaporation of (0.1–4.6) × 10−6 M⊙ yr−1 (Berné et al. 2024). The infrared (IR) spectrum shows the presence of highly excited rotational lines of OH probing the ongoing photodissociation of a hidden reservoir of water vapor (Zannese et al. 2024). It also shows bright CH+ and CH rovibrational emission (which was first detected in space toward this disk by Berné et al. 2023 and Changala et al. 2023). These ions form due to the high temperatures and the enhanced reactivity of H
 with C+ ions. Their abundances scale with the FUV flux (Goicoechea et al. 2019). These photochemical signatures differ from what is commonly observed in isolated disks (e.g., van Dishoeck et al. 2023; Kamp et al. 2023; Perotti et al. 2023; Grant et al. 2023), suggesting that the outer disk gas reservoir in d203-506 is significantly reprocessed by the external FUV field.
A powerful tracer of this photo-processing is the ground-state 3P1 – 3P0 fine-structure line of neutral carbon (C0), the [C I] 609 μm line, which can be observed by the Atacama Large Millimeter/submillimeter Array (ALMA) at subarcsecond and sub-km s−1 resolutions. However, low-angular-resolution searches toward proplyds in the NGC 1977 cluster (illuminated by the B1V-type star 43 Ori, north of the ONC) yielded non-detections, which were interpreted as being due to either very low-mass disks or a depletion of carbon in the outer disk (Haworth et al. 2022). Here we present its first detection toward an externally irradiated disk, complemented with the JWST detection of electronically excited C0 lines in the near-infrared (NIR).
2. ALMA and JWST observations of d203-506
We used ALMA to observe the protoplanetary disk d203-506, located at α(2000) = 5h35m20.32s, δ(2000) = −5°25′05.55″. These observations, a ∼40″ × 40″ mosaic using 47 ALMA 12 m antennas, are part of an imaging program of the Orion Bar (2021.1.01369.S, P.I.: J. R. Goicoechea). Here we present the detection of the [C I] 609 μm (492 GHz, in band 8) and C18O J = 3–2 (329 GHz, in band 7) lines. We used correlators that provide ∼282 kHz and ∼564 kHz resolution, respectively. We binned all spectra to a common velocity resolution of 0.4 km s−1. The total observation times with the ALMA 12 m array were ∼4.6 h (492 GHz) and 2.7 h (329 GHz). The final synthesized beams are 0.52″ × 0.38″ at position angle PA = 110° (492 GHz) and 0.77″ × 0.60″ at PA = 64° (329.3 GHz). The achieved rms noises are 25 mJy and 10 mJy per velocity channel, respectively. The complete data cubes and calibration strategy will be described in an accompanying paper that focuses on the Bar.
We also observed d203-506 as part of the PDRs4All JWST Early Release Science program (ID # 1288; Berné et al. 2022). Our study focuses on NIRSpec’s spectral cube from 0.97 to ∼5 μm, observed with grating dispersers at R = λ/Δλ ∼ 2700 resolution. The angular resolution is ∼0.1″ (∼40 au at the distance to Orion). Peeters et al. (2024) describe the data reduction in detail. We extracted a NIR spectrum in two apertures: one toward d203-506 (ON measurement) and the other near the disk, providing the OFF reference. The intrinsic spectrum of d203-506 is the ON – f ⋅ OFF measurement (see Appendices B and C).
3. Results
Figure 1 shows the detection of [C I] 609 μm emission in d203-506 as well as extended [C I] 0.9853 μm forbidden line emission, which connects the first electronic excited state 1D2 with the ground state. To our knowledge, this is the first detection of these lines toward an externally photoevaporating disk2. Only the NIRSpec [C I] 0.9853 μm observation spatially resolves the outer disk and photo-evaporative wind. The [C I] 0.9853 μm emission is similar to that of H (see Fig. B.1), and significantly more extended than the submillimeter dust continuum emission from the inner, dense Keplerian disk (orange contours in Fig. 1b).
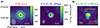 |
Fig. 1. Images of d203-506 (same field of view). (a): C18O J = 3–2 and [C I] 609 μm integrated line emission (spatially unresolved). Contours show 10σ and 20σ intensity levels for C18O, and 5σ and 10σ for [C I] 609 μm. Synthesized beam sizes are shown at the bottom corner. The apparent larger extent of the C18O emission is due to the larger beam and faint background emission. (b): [C I] 0.9853 μm emission from the photo-evaporative wind observed with NIRSpec (colored image). Orange contours show he 0.8 mm dust continuum observed by ALMA (from Berné et al. 2024). |
Figure 2 shows the velocity-resolved [C I] 609 μm and C18O 3–2 line profiles observed by ALMA. The [C I] 609 μm line does not show the characteristic double-peak profile of an edge-on rotating disk. Instead, it is similar to that of HCO+ 4–3 (convolved to the same angular resolution), which is dominated by emission from the outer disk and the quasi-spherical photo-evaporative wind (Berné et al. 2024). Since our observation does not spatially resolve d203-506, the resulting line profile is more or less Gaussian. The remaining blueshifted [C I] 609 μm emission may originate from a slow wind not traced by HCO+. A two-Gaussian fit to the two [C I] 609 μm components shows a velocity centroid difference of only 2.3 ± 0.4 km s−1, which is inconsistent with emission from the fast jet that emerges from the object (e.g., Haworth et al. 2023). In contrast, C18O 3–2 shows a clear double-peak profile, which traces deeper layers (we infer NH ≳ 1023 cm−2) of the Keplerian disk (Miotello et al. 2016).
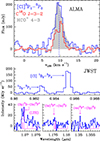 |
Fig. 2. Neutral carbon toward d203-506. Upper: [C I] 609 μm and C18O J = 3–2 line profiles. The gray-shaded spectrum shows HCO+J = 4–3 (Berné et al. 2024) scaled and convolved to the angular resolution of the [C I] 609 μm observations. Lower: NIR detection of [C I] forbidden lines at 0.9827 and 0.9853 μm (top) and C I permitted line multiplets at ∼1.069, ∼1.176, and ∼1.355 μm (bottom). Magenta lines represent the position and relative local thermodynamic equilibrium (LTE) intensity of each component. |
Figure 2 also shows NIR excited lines from neutral carbon: [C I] (2p2) 1D2 – (2p2) 3P forbidden lines at 0.9827 and 0.9853 μm (Eu ≃ 1.3 eV), and the highly excited (3p) 3D – (3s) 3Po, (3d) 3Fo – (3p) 3D, and (4s) 3Po – (3p) 3S permitted line multiplets at ∼1.069, ∼1.176, and ∼1.355 μm, respectively (with Eu ≃ 10 eV). In addition, Haworth et al. (2023) imaged the [C I] (2p) 1S0 – (2p) 1D2 forbidden line emission at 0.8729 μm (Eu ≃ 2.7 eV) with VLT/MUSE. Table I.1 summarizes the observed line intensities. As we show here, all these lines arise from neutral photodissociation region (PDR) gas (not from H+ ionized gas), which is consistent with the low ionization potential (IP) of C0 (11.26 eV) and with the lack of cometary ionization fronts in d203-506.
4. Analysis: Thermochemistry and line excitation
Neutral carbon lines are expected to trace warm molecular gas at the C+/C0/CO transition zone of the outer disk and inner photo-evaporative wind (e.g., Haworth & Owen 2020). At the high gas densities relative to the FUV flux in a disk (nH/G0 > 102 cm−3), H2 and CO line self-shielding shifts the atomic to molecular gas transitions close to the irradiated surface, where the FUV flux is strong and the H2-emitting gas is heated to Tk ≳ 1000 K (Johnstone et al. 1998; Störzer & Hollenbach 1999; Champion et al. 2017). To derive the beam-averaged column density of C0 in this zone, N(C0), and the (total) gas-phase abundance of carbon, xC = xC+ + xC0 + xCO + … , we used the Meudon code (Le Petit et al. 2006), a fully benchmarked PDR model (see Röllig et al. 2007). We simulated the [C I] 609 μm- and NIR-emitting zones as a 1D stationary slab of constant-density gas. This model involves solving the λ-dependent attenuation of external FUV photons (considering dust extinction and line self-shielding; Goicoechea & Le Bourlot 2007), C0 photoionization, C+ recombination, and CO photodissociation. Our detailed treatment of the penetration of FUV radiation, H2 excitation, thermal balance, and chemistry allows a precise determination of the H/H2 and C+/C/CO transition layers in the slab, but neglects the wind dynamics (e.g., Haworth & Owen 2020). We implicitly assumed that the contribution to the [C I] 609 μm intensity from the inner disk close to the central star (Gressel et al. 2020) is negligible and beam-diluted. We treated the λ-dependent absorption and scattering of FUV photons by dust, providing an effective absorption cross section of 7 × 10⁻²² cm2 H−1 at 1000 Å. These grains are bigger than interstellar medium (ISM) grains but consistent with the modest grain growth expected in the upper layers of irradiated disks (Störzer & Hollenbach 1999; Birnstiel et al. 2018).
The [C I] 609 and 370 μm lines involve forbidden transitions with very low Einstein coefficients for spontaneous emission. In dense and warm gas, and because of their low excitation requirements – low critical density (ncr ≲ 103 cm−3) and low level energy separation compared to Tk (ΔE/kB = 23.6 K ≪ Tk) – the [C I] 609 μm emission is optically thin3, collisionally excited, and thermalized (Tex = Tk). In this regime, I([C I] 609 μm) is proportional to N(C0) irrespective of the physical conditions. In addition, N(C0) is not very sensitive to variations in G0 (Appendix G). Figure 3 shows the N(C0) and I([C I] 609 μm), integrating up to an equivalent extinction depth of AV = 10 mag, predicted by models of varying gas densities, with nH = n(H) + 2n(H2), and G0 = 2 × 10⁴. Our models encompass the [C I] 609 μm-emitting layers and thus can be used, for a given nH, to constrain N(C0) and xC. Figure 3 shows that I([C I] 609 μm), a surface tracer, scales with N(C0) and xC. Models marked with squares have xC = 1.4 × 10⁻⁴, which is the gas-phase abundance of interstellar carbon measured4 in the line of sight toward the Trapezium stars (Sofia et al. 2004). Our main result is that the observed I([C I] 609 μm) implies high xC abundances, roughly the same as those in the natal cloud. The lack of significant volatile carbon depletion, which would evolve with time (e.g., Kama et al. 2016; Krijt et al. 2020), suggests that this protoplanetary disk is young.
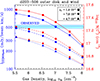 |
Fig. 3. Models with G0 = 2 × 10⁴ and different values of nH and xC . Red and blue markers show the predicted C0 column density and [C I] 609 μm intensity, respectively, from AV = 0 to 10 mag into the wind and disk system. The gas density derived from H2 observations is ≈107 cm−3 (Berné et al. 2024). The horizontal line marks the observed intensity (±1σ). Circles and triangles represent models with small depletion factors of two and three, respectively. |
We adopted nH ≈ 107 cm−3 as the gas density in the [C I] 609 μm-emitting zone, as determined from H2 observations with JWST (Berné et al. 2024). At these densities, the spatial scale of the [C I] 609 μm emission is a few tens of au, a fraction of an arcsecond, in agreement with the observed size of d203-506. Models with nH ≃ 107 cm−3 fit the observed I([C I] 609 μm) with N(C0) ≃ 2 × 1017 cm−2 and xC ≃ 1.4 × 10⁻⁴, with an uncertainty of less than a factor of 2. Figure 4 (upper panel) shows the predicted structure of the [C I] 609 μm-emitting layer, roughly representing the vertical structure of the outer disk and inner wind. The middle panel shows the normalized [C I] 609 μm, H2 1–0 S(1), and CO 3–2 line emissivities. [C I] 609 μm peaks just beyond the H2 dissociation front. The lower panel shows the C+, C0, CO, water ice, and CO ice abundance profiles. The predicted gas temperature in the H2-emitting zone is Tk ≳ 1000–1200 K, consistent with the observed H2 rotational temperatures (Berné et al. 2024), and drops to Tk ≃ 700 K at the [C I] 609 μm intensity peak, where C0 becomes the most abundant carbon species.
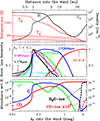 |
Fig. 4. Model of the outer disk and inner wind (nH = 107 cm−3 and G0 = 2 × 10⁴). Upper panel: H2 and H densities and gas and dust temperatures as a function of depth into the disk. Middle: Normalized line emissivity profiles, including NIR C0 lines. Lower: Abundance profiles. |
Turning back to the NIR carbon lines, we note that the (3p) 3D – (3s) 3Po (1.069 μm) and (3d) 3F – (3p) 3D (1.176 μm) multiplets are the brightest permitted lines predicted by recombination theory (C+ + e− → C* + line cascade; Escalante & Victor 1990). However, the observed I(1.069 μm)/I(1.176 μm) and I(0.984 μm)/I(1.069 μm) intensity ratios do not match the ratios predicted by this theory (see Appendix D). In analogy with the NIR O I fluorescent lines detected very close behind the ionization fronts of interstellar PDRs (Walmsley et al. 2000; Lucy 2002; Peeters et al. 2024), the NIR C0 lines could form via de-excitation cascades following FUV-pumping from the ground-state 3P to the high-energy triplets (3s) 3Po, (3d) 3Do, (3d) 3Fo, (4s) 3Po, and so on (i.e., C + hν0 → C* + line cascade). The FUV-pumping lines of these transitions lie at 1656 Å, 1277 Å, 1279 Å, and 1280 Å, respectively, that is, FUV photons with energies hν0 = 7.5–9.6 eV (see Fig. E.1 for a Gotrian diagram). Here we included FUV-pumping followed by radiative cascades in the Meudon PDR code (Appendix E). This mechanism greatly increases the intensities of all the observed NIR C0 lines (both forbidden and permitted) compared to models that consider collisional excitation and C+ recombination alone, thereby fitting the observations (Table I.1). NIR C0 line intensities scale with G0 (see Appendix G) and are a powerful diagnostic of external FUV irradiation (we derive G0 ≃ (1–2) × 104 in d203-506). Figure 4 shows their emissivity profiles, which peak very close to the H2 1–0 S(1) emission, as observed. Thus, NIR C0 lines trace the transition from neutral atomic gas to molecular gas. The lack of bright NIR O I fluorescent lines (other than a faint O I 1.317 μm emission; Appendix C) implies that d203-506 is pervaded by a reduced flux of FUV photons at the pumping transitions of these lines: photons with E ≳ 12 eV (λ ≲ Lyman–β, Walmsley et al. 2000). Furthermore, grain sizes and gas-to-dust mass ratios in the outer disk and wind are likely larger than those in the ISM (e.g., Winter & Haworth 2022). This results in lower effective FUV dust absorption cross sections, and implies that the attenuation of these FUV photons is dominated by H I and H2 absorption lines, and by the C0 photoionization continuum at λ < 1101 Å (Appendix F). In contrast, the attenuation of FUV photons at the pumping transitions of C0 (λ ≃ 1300 Å) is less pronounced and is dominated by dust grains. The lack of outstanding oxygen fluorescent lines but detectable carbon lines in d203-506 agrees with this scenario.
5. Discussion: Photo-processing in d203-506
The [C I] 609 μm line fluxes observed in nearby isolated disks (i.e., disks that are not externally irradiated) such as TW Hya suggest carbon depletion by 1–2 orders of magnitude in these disks (e.g., Kama et al. 2016). In d203-506, however, we determine a high gas-phase xC abundance. Furthermore, the outer layers of externally FUV-irradiated disks are heated to high gas and dust temperatures, Tk up to 1000 K and Td up to ≃100 K (red curves in the upper panel of Fig. 4). These warm dust temperatures are on the order of the freezing temperature of H2O and significantly higher than that of CO (∼25 K; e.g., Öberg et al. 2011), thus preventing their freeze-out in the outer disk and wind.
A strong external FUV flux leads to high ice photo-desorption rates and high Td, and shifts the freeze-out depth (e.g., in disk height) where most oxygen becomes trapped in ice mantles (see Fig. 4 and Appendix H). Thus, we expect the vertical distribution of the xC /xO abundance ratio in irradiated disks to differ from that of isolated disks. In particular, grain growth, settling, and subsequent radial drift (Krijt et al. 2020; Zhang et al. 2020) will be less efficient due to the lack of thick ice mantles in the strongly irradiated outer disk. This will result in lower depletions of gaseous CO compared to more evolved, ≳ 1 Myr, disks (e.g., Bergner et al. 2020). Interestingly, the NIRSpec spectrum of d203-506 shows bright CO ro-vibrational emission at ∼4.7 μm (see Berné et al. 2024), which we attribute to the externally irradiated layers. All in all, the outer gas layers of d203-506, and presumably of other externally irradiated disks (e.g., Boyden & Eisner 2023), must be “oxygen rich,” with xC/xO very close to the solar ratio (assuming gaseous oxygen abundances as in the Orion cloud4). In d203-506, this is further demonstrated by the presence of abundant gaseous OH, with xOH + xH2O ≳ 10−5 (Zannese et al. 2024), and by the detection of bright and extended [O I] 6302 Å emission (Haworth et al. 2023), where the excited O(1D) atoms in PDR gas (close to the H/H2 dissociation front) are produced by OH photodissociation (van Dishoeck & Dalgarno 1983; Störzer & Hollenbach 1998). In these irradiated layers, water undergoes photo-processing and cycles between gas-phase formation and photodissociation. Other inherited ice mantles will undergo photo-desorption and photo-processing as well. Does this mean that strongly irradiated disks develop a less rich carbon chemistry than isolated disks? On the contrary, we expect that hydrocarbons will be abundant in these O-rich disk layers, formed by gas-phase reactions triggered by the external FUV radiation, high temperatures, and enhanced abundances of C+, C*, C0, and H (see also Agúndez et al. 2008; Berné et al. 2023). These FUV-induced processes, facilitated by vertical transport, likely lead to different chemical compositions – similar to interstellar PDRs (rich in hydrocarbons, e.g., Cuadrado et al. 2015) – in the outer disk regions where gas-giant planets form. Additionally, the absence of carbon depletion in other proplyds would imply low disk masses for the non-detections in NGC 1977 by Haworth et al. (2022). Still, even higher angular resolution will be needed to map radial and vertical chemical abundances in Orion’s disks.
We denote the total “solar” abundance of element X as xX⊙, with xC⊙ = 2.9 × 10⁻⁴ and xC⊙/xO⊙ = 0.54 (Asplund et al. 2009). We refer to the gas-phase abundance of species Y with respect to H nuclei as the density ratio xY = n(Y)/nH, where nH = n(H) + 2n(H2) in neutral gas.
Nearby low-mass isolated disks such as DM Tau or TW Hya as well as Herbig Ae/Be disks show faint [C I] 609 μm line emission (Tsukagoshi et al. 2015; Kama et al. 2016; Sturm et al. 2022; Alarcón et al. 2022; Pascucci et al. 2023; Temmink et al. 2023). This emission is driven by internal FUV illumination from the central star. In addition, T Tauri stars show NIR C I permitted lines (interpreted as C+ + e− recombination lines) from the innermost < 1 au disk regions, interior to the dust sublimation radius (McClure 2019; McClure et al. 2020). Interestingly, these inner regions do not show lower-energy [C I] forbidden line emission at 0.9827 and 0.9853 μm, which is bright in d203-506 and in interstellar PDRs.
At high temperatures, Tk > 500–1000 K, the [C I] 609 μm line becomes optically thick only if N(C0) is greater than several times 1019 cm−2.
From UV absorption-line measurements toward the θ1 Ori B star in the Trapezium. The gaseous xC/xO ratio in this interstellar sight line is 0.52 ± 0.18 (Cartledge et al. 2001), very close to the solar ratio. These values imply moderate depletions, about −0.3 dex with respect to their solar abundances, consistent with their incorporation into refractory dust (e.g., Savage & Sembach 1996; Jenkins 2009). Other studies suggest xC ≃ 2 × 10⁻⁴ in Orion’s nebular gas (Simón-Díaz & Stasińska 2011) and B-type stars (Nieva & Przybilla 2012), with xC / xO ≃ 0.4–0.5.
Acknowledgments
We made used of ADS/JAO.ALMA#2021.1.01369.S data. ALMA is a partnership of ESO (representing its member states), NSF (USA) and NINS (Japan), together with NRC (Canada), NSTC and ASIAA (Taiwan), and KASI (Republic of Korea), in cooperation with the Republic of Chile. The Joint ALMA Observatory is operated by ESO, AUI/NRAO and NAOJ. The JWST data were obtained from the Mikulski Archive for Space Telescopes at the Space Telescope Science Institute, which is operated by the Association of Universities for Research in Astronomy, Inc., under NASA contract NAS 5-03127 for JWST. These observations are associated with program #1288. Support for program #1288 was provided by NASA through a grant from the Space Telescope Science Institute, which is operated by the Association of Universities for Research in Astronomy, Inc., under NASA contract NAS 5-03127. We thank our referee for a constructive report. JRG thanks the Spanish MCINN for funding support under grants PID2019-106110GB-I00 and PID2023-146667NB-I00. TJH acknowledges funding from a Royal Society Dorothy Hodgkin Fellowship and UKRI guaranteed funding for a Horizon Europe ERC consolidator grant (EP/Y024710/1). We thank the Programme National “Physique et Chimie du Milieu Interstellaire” (PCMI) of CNRS/INSU with INC/INP, co-funded by CEA and CNES. EP acknowledges support from the University of Western Ontario, the Institute for Earth and Space Exploration, the Canadian Space Agency (CSA, 22JWGO1-16), and the Natural Sciences and Engineering Research Council of Canada. TO is supported by JSPS Bilateral Program, Grant Number 120219939.
References
- Abel, N. P., Ferland, G. J., & O’Dell, C. R. 2019, ApJ, 881, 130 [Google Scholar]
- Abrahamsson, E., Krems, R. V., & Dalgarno, A. 2007, ApJ, 654, 1171 [NASA ADS] [CrossRef] [Google Scholar]
- Adams, F. C. 2010, ARA&A, 48, 47 [NASA ADS] [CrossRef] [Google Scholar]
- Agúndez, M., Cernicharo, J., & Goicoechea, J. R. 2008, A&A, 483, 831 [NASA ADS] [CrossRef] [EDP Sciences] [Google Scholar]
- Alarcón, F., Bergin, E. A., & Teague, R. 2022, ApJ, 941, L24 [CrossRef] [Google Scholar]
- ALMA Partnership, Brogan, C. L., Pérez, L. M., et al. 2015, ApJ, 808, L3 [Google Scholar]
- Asplund, M., Grevesse, N., Sauval, A. J., & Scott, P. 2009, ARA&A, 47, 481 [NASA ADS] [CrossRef] [Google Scholar]
- Badnell, N. R. 2006, ApJS, 167, 334 [Google Scholar]
- Bally, J., O’Dell, C. R., & McCaughrean, M. J. 2000, AJ, 119, 2919 [NASA ADS] [CrossRef] [Google Scholar]
- Bergin, E. A., Du, F., Cleeves, L. I., et al. 2016, ApJ, 831, 101 [Google Scholar]
- Bergin, E. A., Alexander, C., Drozdovskaya, M., Gounelle, M., & Pfalzner, S. 2023, arXiv e-prints [arXiv:2301.05212] [Google Scholar]
- Bergner, J. B., Öberg, K. I., Bergin, E. A., et al. 2020, ApJ, 898, 97 [NASA ADS] [CrossRef] [Google Scholar]
- Berné, O., Habart, É., Peeters, E., et al. 2022, PASP, 134, 054301 [CrossRef] [Google Scholar]
- Berné, O., Martin-Drumel, M.-A., Schroetter, I., et al. 2023, Nature, 621, 56 [CrossRef] [Google Scholar]
- Berné, O., Habart, E., Peeters, E., et al. 2024, Science, 383, 988 [Google Scholar]
- Birnstiel, T., Dullemond, C. P., Zhu, Z., et al. 2018, ApJ, 869, L45 [CrossRef] [Google Scholar]
- Bosman, A. D., Alarcón, F., Bergin, E. A., et al. 2021, ApJS, 257, 7 [NASA ADS] [CrossRef] [Google Scholar]
- Bowen, I. S. 1928, ApJ, 67, 1 [Google Scholar]
- Boyden, R. D., & Eisner, J. A. 2020, ApJ, 894, 74 [NASA ADS] [CrossRef] [Google Scholar]
- Boyden, R. D., & Eisner, J. A. 2023, ApJ, 947, 7 [Google Scholar]
- Cartledge, S. I. B., Meyer, D. M., Lauroesch, J. T., & Sofia, U. J. 2001, ApJ, 562, 394 [NASA ADS] [CrossRef] [Google Scholar]
- Champion, J., Berné, O., Vicente, S., et al. 2017, A&A, 604, A69 [NASA ADS] [CrossRef] [EDP Sciences] [Google Scholar]
- Changala, P. B., Chen, N. L., Le, H. L., et al. 2023, A&A, 680, A19 [NASA ADS] [CrossRef] [EDP Sciences] [Google Scholar]
- Cuadrado, S., Goicoechea, J. R., Pilleri, P., et al. 2015, A&A, 575, A82 [NASA ADS] [CrossRef] [EDP Sciences] [Google Scholar]
- Díaz-Berríos, J. K., Guzmán, V. V., Walsh, C., et al. 2024, ApJ, 969, 165 [CrossRef] [Google Scholar]
- Escalante, V., & Victor, G. A. 1990, ApJS, 73, 513 [NASA ADS] [CrossRef] [Google Scholar]
- Escalante, V., Sternberg, A., & Dalgarno, A. 1991, ApJ, 375, 630 [NASA ADS] [CrossRef] [Google Scholar]
- Fatuzzo, M., & Adams, F. C. 2008, ApJ, 675, 1361 [NASA ADS] [CrossRef] [Google Scholar]
- Goicoechea, J. R., & Le Bourlot, J. 2007, A&A, 467, 1 [NASA ADS] [CrossRef] [EDP Sciences] [Google Scholar]
- Goicoechea, J. R., Santa-Maria, M. G., Bron, E., et al. 2019, A&A, 622, A91 [NASA ADS] [CrossRef] [EDP Sciences] [Google Scholar]
- Goicoechea, J. R., Pabst, C. H. M., Kabanovic, S., et al. 2020, A&A, 639, A1 [NASA ADS] [CrossRef] [EDP Sciences] [Google Scholar]
- Goicoechea, J. R., Aguado, A., Cuadrado, S., et al. 2021, A&A, 647, A10 [EDP Sciences] [Google Scholar]
- Gordon, K. D., Clayton, G. C., Decleir, M., et al. 2023, ApJ, 950, 86 [CrossRef] [Google Scholar]
- Grant, S. L., van Dishoeck, E. F., Tabone, B., et al. 2023, ApJ, 947, L6 [NASA ADS] [CrossRef] [Google Scholar]
- Gressel, O., Ramsey, J. P., Brinch, C., et al. 2020, ApJ, 896, 126 [Google Scholar]
- Guan, L., Jiang, P., Zhang, G., et al. 2021, A&A, 647, A127 [NASA ADS] [CrossRef] [EDP Sciences] [Google Scholar]
- Habart, E., Le Gal, R., Alvarez, C., et al. 2023, A&A, 673, A149 [NASA ADS] [CrossRef] [EDP Sciences] [Google Scholar]
- Habart, E., Peeters, E., Berné, O., et al. 2024, A&A, 685, A73 [NASA ADS] [CrossRef] [EDP Sciences] [Google Scholar]
- Haris, K., & Kramida, A. 2017, ApJS, 233, 16 [Google Scholar]
- Haworth, T. J., & Owen, J. E. 2020, MNRAS, 492, 5030 [NASA ADS] [CrossRef] [Google Scholar]
- Haworth, T. J., Kim, J. S., Qiao, L., et al. 2022, MNRAS, 512, 2594 [NASA ADS] [CrossRef] [Google Scholar]
- Haworth, T. J., Reiter, M., O’Dell, C. R., et al. 2023, MNRAS, 525, 4129 [NASA ADS] [CrossRef] [Google Scholar]
- Henney, W. J. 2021, MNRAS, 502, 4597 [NASA ADS] [CrossRef] [Google Scholar]
- Hollenbach, D., Kaufman, M. J., Bergin, E. A., & Melnick, G. J. 2009, ApJ, 690, 1497 [NASA ADS] [CrossRef] [Google Scholar]
- Jenkins, E. B. 2009, ApJ, 700, 1299 [Google Scholar]
- Johnson, C. T., Burke, P. G., & Kingston, A. E. 1987, J. Phys. B At. Mol. Phys., 20, 2553 [CrossRef] [Google Scholar]
- Johnstone, D., Hollenbach, D., & Bally, J. 1998, ApJ, 499, 758 [NASA ADS] [CrossRef] [Google Scholar]
- Kama, M., Bruderer, S., Carney, M., et al. 2016, A&A, 588, A108 [NASA ADS] [CrossRef] [EDP Sciences] [Google Scholar]
- Kamp, I., Henning, T., Arabhavi, A. M., et al. 2023, Faraday Discuss., 245, 112 [NASA ADS] [CrossRef] [Google Scholar]
- Krijt, S., Bosman, A. D., Zhang, K., et al. 2020, ApJ, 899, 134 [NASA ADS] [CrossRef] [Google Scholar]
- Lada, C. J., & Lada, E. A. 2003, ARA&A, 41, 57 [Google Scholar]
- Le Petit, F., Nehmé, C., Le Bourlot, J., & Roueff, E. 2006, ApJS, 164, 506 [NASA ADS] [CrossRef] [Google Scholar]
- Lucy, L. B. 2002, MNRAS, 329, 787 [NASA ADS] [CrossRef] [Google Scholar]
- Madhusudhan, N. 2012, ApJ, 758, 36 [NASA ADS] [CrossRef] [Google Scholar]
- Mah, J., Bitsch, B., Pascucci, I., & Henning, T. 2023, A&A, 677, L7 [CrossRef] [EDP Sciences] [Google Scholar]
- Maucó, K., Manara, C. F., Ansdell, M., et al. 2023, A&A, 679, A82 [NASA ADS] [CrossRef] [EDP Sciences] [Google Scholar]
- McClure, M. K. 2019, A&A, 632, A32 [NASA ADS] [CrossRef] [EDP Sciences] [Google Scholar]
- McClure, M. K., Dominik, C., & Kama, M. 2020, A&A, 642, L15 [NASA ADS] [CrossRef] [EDP Sciences] [Google Scholar]
- Mendoza, C. 1983, in Planetary Nebulae, ed. L. H. Aller (Dordrecht: D. Reidel Publishing Co.), 103, 143 [NASA ADS] [CrossRef] [Google Scholar]
- Miotello, A., van Dishoeck, E. F., Kama, M., & Bruderer, S. 2016, A&A, 594, A85 [NASA ADS] [CrossRef] [EDP Sciences] [Google Scholar]
- Miotello, A., Facchini, S., van Dishoeck, E. F., et al. 2019, A&A, 631, A69 [NASA ADS] [CrossRef] [EDP Sciences] [Google Scholar]
- Nieva, M. F., & Przybilla, N. 2012, A&A, 539, A143 [NASA ADS] [CrossRef] [EDP Sciences] [Google Scholar]
- Öberg, K. I., Murray-Clay, R., & Bergin, E. A. 2011, ApJ, 743, L16 [Google Scholar]
- Öberg, K. I., Guzmán, V. V., Walsh, C., et al. 2021, ApJS, 257, 1 [CrossRef] [Google Scholar]
- Öberg, K. I., Facchini, S., & Anderson, D. E. 2023, ARA&A, 61, 287 [CrossRef] [Google Scholar]
- O’Dell, C. R., Wen, Z., & Hu, X. 1993, ApJ, 410, 696 [CrossRef] [Google Scholar]
- O’Dell, C. R., Abel, N. P., & Ferland, G. J. 2020, ApJ, 891, 46 [CrossRef] [Google Scholar]
- Pabst, C. H. M., Goicoechea, J. R., Teyssier, D., et al. 2020, A&A, 639, A2 [NASA ADS] [CrossRef] [EDP Sciences] [Google Scholar]
- Pascucci, I., Skinner, B. N., Deng, D., et al. 2023, ApJ, 953, 183 [CrossRef] [Google Scholar]
- Peeters, E., Habart, E., Berné, O., et al. 2024, A&A, 685, A74 [NASA ADS] [CrossRef] [EDP Sciences] [Google Scholar]
- Pequignot, D., & Aldrovandi, S. M. V. 1976, A&A, 50, 141 [NASA ADS] [Google Scholar]
- Perotti, G., Christiaens, V., Henning, T., et al. 2023, Nature, 620, 516 [NASA ADS] [CrossRef] [Google Scholar]
- Plomp, V., Wang, X. D., Kłos, J., et al. 2023, arXiv e-prints [arXiv:2312.00203] [Google Scholar]
- Putaud, T., Michaut, X., Le Petit, F., Roueff, E., & Lis, D. C. 2019, A&A, 632, A8 [NASA ADS] [CrossRef] [EDP Sciences] [Google Scholar]
- Qiao, L., Coleman, G. A. L., & Haworth, T. J. 2023, MNRAS, 522, 1939 [NASA ADS] [CrossRef] [Google Scholar]
- Ramírez-Tannus, M. C., Bik, A., Cuijpers, L., et al. 2023, ApJ, 958, L30 [CrossRef] [Google Scholar]
- Ricci, L., Robberto, M., & Soderblom, D. R. 2008, AJ, 136, 2136 [CrossRef] [Google Scholar]
- Rogers, C., de Marchi, G., & Brandl, B. 2024, A&A, 684, L8 [NASA ADS] [CrossRef] [EDP Sciences] [Google Scholar]
- Röllig, M., Abel, N. P., Bell, T., et al. 2007, A&A, 467, 187 [Google Scholar]
- Savage, B. D., & Sembach, K. R. 1996, ARA&A, 34, 279 [Google Scholar]
- Simón-Díaz, S., & Stasińska, G. 2011, A&A, 526, A48 [CrossRef] [EDP Sciences] [Google Scholar]
- Sofia, U. J., Lauroesch, J. T., Meyer, D. M., & Cartledge, S. 2004, ApJ, 605, 272 [NASA ADS] [CrossRef] [Google Scholar]
- Staemmler, V., & Flower, D. R. 1991, J. Phys. B: At. Mol. Opt. Phys., 24, 2343 [NASA ADS] [CrossRef] [Google Scholar]
- Störzer, H., & Hollenbach, D. 1998, ApJ, 502, L71 [CrossRef] [Google Scholar]
- Störzer, H., & Hollenbach, D. 1999, ApJ, 515, 669 [CrossRef] [Google Scholar]
- Sturm, J. A., McClure, M. K., Harsono, D., et al. 2022, A&A, 660, A126 [NASA ADS] [CrossRef] [EDP Sciences] [Google Scholar]
- Temmink, M., Booth, A. S., van der Marel, N., & van Dishoeck, E. F. 2023, A&A, 675, A131 [NASA ADS] [CrossRef] [EDP Sciences] [Google Scholar]
- Tsukagoshi, T., Momose, M., Saito, M., et al. 2015, ApJ, 802, L7 [NASA ADS] [CrossRef] [Google Scholar]
- van der Werf, P. P., Goss, W. M., & O’Dell, C. R. 2013, ApJ, 762, 101 [NASA ADS] [CrossRef] [Google Scholar]
- van Dishoeck, E. F., & Black, J. H. 1988, ApJ, 334, 771 [Google Scholar]
- van Dishoeck, E. F., & Dalgarno, A. 1983, J. Chem. Phys., 79, 873 [NASA ADS] [CrossRef] [Google Scholar]
- van Dishoeck, E. F., Kristensen, L. E., Mottram, J. C., et al. 2021, A&A, 648, A24 [NASA ADS] [CrossRef] [EDP Sciences] [Google Scholar]
- van Dishoeck, E. F., Grant, S., Tabone, B., et al. 2023, Faraday Discuss., 245, 52 [NASA ADS] [CrossRef] [Google Scholar]
- Walmsley, C. M., Natta, A., Oliva, E., & Testi, L. 2000, A&A, 364, 301 [NASA ADS] [Google Scholar]
- Walsh, C., Millar, T. J., & Nomura, H. 2013, ApJ, 766, L23 [NASA ADS] [CrossRef] [Google Scholar]
- Winter, A. J., & Haworth, T. J. 2022, Eur. Phys. J. Plus, 137, 1132 [NASA ADS] [CrossRef] [Google Scholar]
- Winter, A. J., Clarke, C. J., Rosotti, G. P., Hacar, A., & Alexander, R. 2019, MNRAS, 490, 5478 [NASA ADS] [CrossRef] [Google Scholar]
- Winter, A. J., Haworth, T. J., Coleman, G. A. L., & Nayakshin, S. 2022, MNRAS, 515, 4287 [NASA ADS] [CrossRef] [Google Scholar]
- Zannese, M., Tabone, B., Habart, E., et al. 2024, Nat. Astron., 8, 577 [Google Scholar]
- Zhang, K., Schwarz, K. R., & Bergin, E. A. 2020, ApJ, 891, L17 [Google Scholar]
Appendix A: On the location of d203-506
The NIR [C I] lines observed by JWST in d203-506 are 3–5 times brighter than toward the Orion Bar PDR (Peeters et al. 2024). The submm [C I] 609 μm (3P1–3P0) line integrated flux is 605 mJy km s−1, slightly above the CO 3-2 line fluxes measured by Boyden & Eisner (2020, 2023) in other disks of the ONC. The velocity centroid of the main [C I] 609 μm line emission, vLSR (C I) = 9.5 ± 0.1 km s−1 (see Fig. A.1), is in the range of LSR velocities of these disks. This velocity would be consistent with d203-506 being embedded at the rim of the Orion Bar where only FUV photons with E < 13.6 eV penetrate inside. The amount of extinction internal to the Bar PDR can be estimated using the observed line intensity ratio of H2 lines that arise from the same upper v and J state. The inferred extinction toward d203-506 is nearly zero (Fig. 11 of Peeters et al. 2024), suggesting that the disk is actually not embedded in the Bar. Indeed, d203-506 shows a silhouette appearance at the wavelengths of several visible and NIR lines (Hα, [S II] 6732 Å, Paschen-α, etc.) arising from ionized gas in the background H II region. This lead Haworth et al. (2023) to conclude that the disk lies in front of a structure of ionized gas known as the near ionization layer (NIL, Abel et al. 2019; O’Dell et al. 2020). Thus, located closer to the observer than the Bar, the Huygens H II region, and the Trapezium stars. In this picture, d203-506 is in the foreground, well separated from the Bar, at least by ∼0.4 pc. The NIL would absorb any EUV radiation emitted by the massive stars θ1 Ori C (in the Trapezium) and θ2 Ori A, thus leaving the disk illuminated only by FUV radiation. Still, the LSR velocity of the ionized gas emission in the NIL, −12 ± 2 km s−1 (O’Dell et al. 2020) is very different to that of d203-506, so this layer is likely not related with the birth place of the disk. Yet, the strong external FUV field and high gas-phase carbon abundance derived in d203-506 is very similar to that in the Orion cloud, suggesting a young disk, but separated from the main star-forming molecular core (OMC-1). Plausible scenarios are: i) the disk has recently emerged from a molecular globule, such as those detected by Goicoechea et al. (2020) in the Veil bubble of Orion, or, ii) d203-506 belongs to a recent star formation episode followed by radial migration (e.g., Störzer & Hollenbach 1999; Winter et al. 2019). Irrespective of its exact location, the important point is that d203-506 is externally illuminated by FUV radiation, but no EUV.
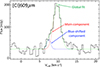 |
Fig. A.1. [C I] 609 μm line profile toward d203-506 and the two-component Gaussian fit. The velocity centroid difference of the two components is 2.3 ± 0.4 km s−1 and suggests that the blueshifted emission arises from a slow wind not seen in HCO+ 4–3 emission (see Fig. 2). |
Appendix B: Spatial distribution of the [C I] 0.9853 μm emission in d203-506
Figure B.1 compares the [C I] 0.9853 μm (orange contours) and H 1–0 S(1) (cyan contours) emission observed with NIRSpec at similar angular resolution and spatial sampling. These observations have worse resolution and sampling than the H
 1–0 S(1) image obtained by NIRCam (greenish colors). They show that both line emissions have very similar spatial distributions (at the ∼0.1″ ≃ 40 au resolution of these images). Since in a PDR the intensity of FUV-pumped H
 lines peaks slightly ahead of the H/H2 transition, the observed NIR C0 lines also trace this transition from neutral atomic to molecular gas (as confirmed by our model predictions in Fig. 4), that is, the FUV-irradiated gas layers where the H2 abundance sharply increases. We note that spatially resolving the H
 and NIR [C I] line emissivity gradients will require an order of magnitude higher angular resolution.
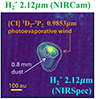 |
Fig. B.1. [C I] 0.9853 μm observed with NIRSpec (orange contours at 3×10⁻⁴ and 6×10⁻⁴ erg s−1 cm−2 sr−1) over a NIRCam image of the H |


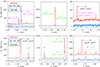 |
Fig. B.2. Selected JWST/NIRSpec spectra toward d203-506. The red spectrum corresponds to the ON source measurement, which includes emission from the background H II region and the Bar PDR. The intrinsic spectrum of d203-506 is the ON – f ⋅ OFF measurement (with f = 0.95 in blue and f = 1 in cyan). The scaling factor, f, is determined from the nebular He I recombination lines (see the main text). These spectra show NIR carbon lines (permitted and forbidden), [Fe II], and vibrationally excited H2 and OH lines (Zannese et al. 2024), among other species (see Berné et al. 2024). However, NIR O I fluorescent lines are not detected in the ON–OFF spectrum. These FUV-pumped O I fluorescent lines appear in the ON spectrum and arise from predominantly atomic gas close behind the ionization front of the Bar (the Δ feature; Haworth et al. 2023; Peeters et al. 2024). |
Appendix C: Extraction of NIR spectra, background line emission, and FUV-pumping photons
We first extracted the NIRSpec spectrum toward d203-506 (ON source measurement). As in our previous studies, we extracted the ON spectrum from an elliptical aperture centered on α(2000) = 5h35m20.357s, δ(2000) = −5°25′05.81″ with dimension length l = 0.52″, height h = 0.38″, and a PA = 33o East of North (Berné et al. 2024). This aperture includes both the inner, dense disk detectable in millimeter dust continuum emission (Berné et al. 2024) and also the extended, optically thinner, outer disk and photo-evaporative wind. Among other atomic ion lines, the ON spectrum contains a plethora of bright He I lines. These permitted NIR lines arise from very high-energy levels, up to ∼24 eV, thus they cannot be FUV-pumped lines of neutral helium. Instead, they are produced by EUV photoionization of He atoms, IP(He) = 24.6 eV, followed by radiative recombination cascades of He+. These He I recombination lines are nebular lines (Rogers et al. 2024) from the background H II region (Peeters et al. 2024). This implies that toward the ON aperture, d203-506 is not opaque to the background NIR line emission. In order to obtain the intrinsic NIR spectrum of d203-506, one needs to correct for any background H II region and Bar PDR line emission. As in our previous studies, we extracted a reference spectrum very close to the disk and providing the OFF-target correction. The OFF spectrum was obtained in a circular aperture of radius r = 0.365″ centered α(2000) = 5h35m20.37s, δ(2000) = −5°25′04.97″, that is, at (0.20″, 0.84″) from the disk (see Berné et al. 2024). The adopted intrinsic spectrum of d203-506 (Fig. 2) is the ON – f⋅ OFF spectrum, where f is the scaling factor needed to have no He I recombination line emission from d203-506 itself. We find f ≃ 0.95 − 1, similar to Rogers et al. (2024) for other disks. This range provides a ∼5 % uncertainty in the line intensities of the NIR carbon lines, which we derived after baseline subtraction and Gaussian line fitting of the ON – f⋅ OFF spectrum.
The ON source spectrum also shows several O I permitted lines: (3d) 3Do – (3p) 3P at 1.129 μm, (4s) 3So – (3p) 3P at 1.317 μm, and (4p) 3P – (3s) 3So at 2.894 μm (see Fig. B.2), that are not seen in the spectrum of d203-506 (ON–OFF). The above lines arise from the background, from the predominantly neutral gas (xH0 > xH+) that borders close behind the ionization front of the Bar PDR (Walmsley et al. 2000; Peeters et al. 2024). These NIR O I lines are not O+ recombination lines –consistent with the slightly higher IP of oxygen (13.618 eV) compared to hydrogen (13.598 eV)–, as there are no EUV photons capable of ionizing neutral oxygen atoms inside PDRs. The excitation of the NIR O I lines in the Bar PDR is attributed to FUV-pumping followed by fluorescence (Walmsley et al. 2000; Lucy 2002; Henney 2021; Peeters et al. 2024). As for neutral carbon, the ground-state of neutral oxygen is a triplet 3P state, so that FUV excitations occur for high triplet states. However, the main pumping lines of the NIR O I lines at 1.129, 1.317, and 2.894 μm lie at short FUV wavelengths: respectively at 1027 Å (12.1 eV; around Lyman-β), 1040 Å (11.9 eV), and multiple lines between 918 and 979 Å (13.5–12.7 eV). In a neutral PDR, these high-energy FUV photons (significantly more energetic than the 7.5-9.6 eV photons needed to pump C0) are only available close to the ionization front, where the gas is mostly atomic.
The lack of remarkable NIR O I emission in d203-506 (other than a faint O I 1.317 μm emission in the ON– 0.95 ⋅ OFF spectrum; Fig. B.2) is not due to a reduced gas-phase elemental abundance of oxygen. Instead, it is caused by a reduced flux of FUV photons with energies capable of pumping the O I levels that are permeating the disk. This deficiency leads to very faint NIR O I fluorescent emission, likely confined to a very thin layer on the outermost surface of the wind. Hence, we conclude that d203-506 is not pervaded by a high flux of FUV photons with energies above ∼12 eV: both FUV continuum photons and Lyman–β photons at 1026 Å (accidental resonance with the main FUV-pumping line of the NIR O I 1.317 μm emission line in a Bowen-fluorescence mechanism). These photons are absorbed close to the wind surface layers. Indeed, at high nH/G0 ratios (≳ 500 cm−3) and relatively low effective dust FUV absorption cross sections, these photons are removed by gas absorption: C0 photoionization continuum (for λ < 1101 Å; E > 11.26 eV), Lyman H I, and Lyman-Werner H2 lines (see Fig. E.2), which develop broad line-absorption wings as gas column densities sharply increase (e.g., Goicoechea & Le Bourlot 2007). In Appendix E, we explicitly model these processes for the physical conditions in d203-506. In addition, a small fraction of ≳12 eV photons might be absorbed by any dust and neutral gas component situated between d203-506 and the massive stars θ1 Ori C and θ2 Ori A (e.g., van der Werf et al. 2013; O’Dell et al. 2020; Pabst et al. 2020).
The above reasoning is also supported by the lack of fluorescent O I (3p) 3P – (3s) 3So line emission at 0.845 μm (VLT/MUSE images, see Haworth et al. 2023), where the upper energy level of the O I 0.845 μm transition is the lower-energy level of the NIR O I 1.129 μm and 1.317 μm lines targeted by NIRSpec (i.e., the O I 0.845 μm line is pumped by the same ≳12 eV FUV-photons than the O I lines targeted by NIRSpec, Bowen 1928; Walmsley et al. 2000; Henney 2021). Instead, the disk is seen in silhouette against the background O I 0.845 μm line emission from the rim of the Bar PDR (the Δ-feature,Haworth et al. 2023). Hence, most of the NIR O I fluorescent emission in the ON spectrum arises from this background feature (Fig. 8 of Peeters et al. 2024).
A reduced number of ≳ 12 eV photons also implies that CO (X1Σ+) photodissociation will mainly produce neutral carbon in the ground 3P state (dissociation energy of 11.1 eV, e.g., van Dishoeck & Black 1988). Indeed, experiments show that FUV photons with energies ≥12.4 eV are needed to produce neutral carbon atoms directly in the first electronically excited 1D state (Guan et al. 2021). Thus, this mechanism will be less dominant in d203-506.
Appendix D: Recombination theory applied to the observed NIR carbon lines
Figure D.1 is analogous to Fig. 14 of Walmsley et al. (2000). It shows the I(0.984 μm)/I(1.069 μm) (bottom) and I(1.069 μm)/I(1.176 μm) (top) line intensity ratios predicted by the recombination theory (C+ + e− → C* + line cascade; Escalante & Victor 1990; Escalante et al. 1991) in two limiting cases: Case A (optically thin gas in all transitions) and the more realistic Case B (optically thick gas to photons produced by permitted transitions, and direct radiative recombinations to the ground state). Here, the I(0.984 μm) refers to the intensities of the observed 0.9827 + 0.9853 μm forbidden lines, and I(1.069 μm) and I(1.176 μm) are the sum of all permitted line intensities in these multiplets (see Table I.1).
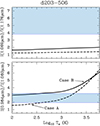 |
Fig. D.1. NIR carbon line intensity ratios predicted by the recombination theory of Escalante & Victor (1990). Curves represent the expected ratios under Case B (continuous) and Case A (dashed) conditions, taken from Walmsley et al. (2000). The blue-shaded area shows the line ratios in d203-506 that are compatible with the observations. See the main text. |
In the recombination theory, the I(1.069 μm)/I(1.176 μm) ratio depends mainly on the opacity of the FUV-resonant transitions. However, the observed I(1.069 μm)/I(1.176 μm) ratio in d203-506 (9.8 ± 6.0; blue-shaded areas) is significantly above the ratio predicted by this theory. Furthermore, the I(0.984 μm)/I(1.069 μm) line intensity ratio depends on the electron temperature. Without any extinction correction, the observed ratio only fits the predictions of Case A, which is less realistic. The upper observational value of the I(0.984 μm)/I(1.069 μm) ratio in Fig. D.1 includes a foreground extinction correction of 1.5 mag (Peeters et al. 2024) adopting the RV = 5.5 extinction law of Gordon et al. (2023). In any case, the absolute intensities of the NIR C0 lines observed in d203-506 are stronger (see the next section and Table I.1) than those predicted by C+ recombination theory (e.g., Escalante et al. 1991). This comparison implies that the involved C0 levels should be predominantly populated by means other than recombination.
Appendix E: Inclusion of FUV-pumping for C0 levels and C+ + e− recombination followed by radiative cascades in the Meudon PDR code
Prompted by the impossibility of explaining the observed NIR carbon lines within the recombination theory, and drawing an analogy with the FUV-pumping mechanism of NIR O I lines at 1.129, 1.317, and 2.894 μm seen toward the ionization fronts of interstellar PDRs (e.g., Bowen 1928; Walmsley et al. 2000; Lucy 2002; Henney 2021), we incorporated the FUV radiative excitation of C0 in the Meudon PDR code (Le Petit et al. 2006). We specifically included 401 levels of C0 (electronic states and their fine-structure levels), with electronic configurations up to 29d (at ∼11.25 eV) and involving a total of 1572 radiative transitions. Figure E.1 shows a reduced Gotrian diagram of C0, showing up to the electronic levels associated with the NIR lines detected with NIRSpec. We took the main spectroscopic parameters from the NIST data base5. The external FUV field (λ > 912 Å) penetrating d203-506 is self-consistently computed as in Goicoechea & Le Bourlot (2007). The attenuation of FUV continuum and line photons impinging in d203-506 includes absorption and anisotropic scattering by dust grains as well as gas FUV-line absorption and photoionization continuum. The disk-position and λ-dependent FUV-field couples to C0 by the resonant absorption of FUV photons from the 3P ground-state to high-energy electronic triplet states through several pumping transitions: 1656 Å, 1277 Å, 1279 Å, 1280 Å, etc. (see Fig. E.2). Subsequent visible and NIR fluorescent line emission cascades populate the lower-energy C0 levels. The brightest NIR carbon lines predicted by the model are precisely the ones detected by JWST/NIRSpec and VLT/MUSE: the forbidden lines at ∼0.984 and 0.8729 μm, as well as the higher-energy permitted lines at ∼1.069, ∼1.176 , and ∼1.355 μm, in decreasing order of intensity. The model also predicts that other NIR C I permitted line multiplets should be detectable (e.g., at ∼0.910, ∼0.966, and ∼1.455 μm). However, the NIRSpec observation of d203-506 does not cover these specific wavelength ranges.
 |
Fig. E.1. Reduced Gotrian diagram of C0 showing up to the electronic levels associated with the NIR lines discussed in this study. The figure also includes the main FUV-pumping lines (in blue) of the detected NIR C0 lines, as well as the submm fine-structure lines within the ground state detectable with ALMA (in green; energy level splitting is exaggerated). |
In addition, we included a reduced description of C+ + e− radiative recombination, including cascades toward the lowest 254 levels of C0 (with core electrons in one of the ground-state 2P3/2 or 2P1/2 fine-structure levels of C+). We adopted the recombination rates from Badnell (2006). However, for the physical conditions of the NIR-emitting gas layers of d203-506 (G0 of few 104 and nH ≃ 107 cm−3), we find that C+ + e− recombinations only increase the intensity of the observed NIR carbon lines by ≲ 5 %. Therefore, in d203-506, this is not the dominant excitation process of these NIR lines.
Our excitation model also incorporates inelastic collisions of C0 with e−, from the ground-state 3P to the first and second excited C0 electronic levels, 1D2 and 1S0 (rate coefficients from Pequignot & Aldrovandi 1976; Mendoza 1983). Nevertheless, we find that collisional excitation to these high-energy levels plays a negligible role compared to FUV-pumping. Within the ground-state 3PJ fine-structure levels, the model also includes inelastic collisions with e− (Johnson et al. 1987), with H (Abrahamsson et al. 2007), with He (Staemmler & Flower 1991), and with o-/p-H2 (Plomp et al. 2023, and extrapolated to high temperatures as in Goicoechea et al. in prep.). However, at the high densities in disks (nH ≫ ncr, [CI]609 ≃ 103 cm−3), the [C I]609 μm fine-structure line is thermalized (Tex = Tk), and its excitation is independent on the collisional rate coefficients. [C I] 370 and 609 μm line intensities are not affected by FUV-pumping either.
Our PDR models including FUV-pumping and fluorescent de-excitation match the intensity level of the observed NIR carbon lines. Without this radiative excitation mechanism, the predicted NIR line intensities would be up to two orders of magnitude lower than observed (Table I.1). FUV-pumping also produces higher values of the I(1.069 μm)/I(1.176 μm) ratio than those predicted by recombination theory. The reference model predicts that the observed NIR and [C I] 609 μm lines are optically thin, with τ ≃ 10−6 and τ ≃ 10−1, respectively. In contrast, the main C I FUV-pumping lines at 1656 Å, 1277 Å, 1279 Å, and 1280 Å have very high opacities, ranging from τ ≃ 200 to ≃ 5000. The FUV continuum is optically thick, τ ≃ 30-40 (see Fig. E.2).
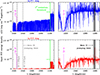 |
Fig. E.2. External FUV radiation field (in energy density) propagating inside the photoevaporating wind and outer disk surface (reference model of d203-506 with G0 = 2 × 10⁴ and nH = 107 cm−3). The upper panels (blue spectra) are for a slab position at AV = 0.1 mag (close to the PDR surface), whereas the lower panels (red spectra) are for a position deeper inside the PDR, at AV = 0.5 mag. The disk-depth-dependent FUV field results from a FUV radiative transfer calculation that includes gas absorption, H2 fluorescent emission, and grain absorption and scattering. The resulting FUV continuum and line emission are modulated by strong H I absorption lines (Ly-α and Ly-β lines are indicated in this figure) and by a forest of H2 absorption and fluorescent emission lines. The black vertical lines show the wavelength position of the main C0 pumping transitions at 1277, 1279, and 1280 Å (∼9.6 eV). The vertical dashed gray lines show the wavelength position of the main O0 pumping transitions at 1027 and 1040 Å (∼12 eV). These photons are quickly absorbed by small column densities of gas, mainly via C0 photoionization below 1101 Å for AV < 1 mag (Fig. F.1). Lower-energy FUV photons propagate deeper inside the disk and are attenuated by dust grains. |
In the Orion Bar PDR, Peeters et al. (2024) found high I(0.984 μm)/I(1.069 μm) line ratios and I(1.069 μm)/I(1.176 μm) line ratios that are inconsistent with recombination theory too (their Fig. G.1). This suggests that recombination alone may not drive the excitation of NIR carbon lines in strongly irradiated interstellar PDRs either. Adding the role of FUV-pumping will likely relax the hot temperatures (several thousand K) and densities (∼ 108 cm−3) determined by Peeters et al. (2024). That is, there will be no need to invoke the presence of very high-pressure small clumps, which are otherwise not seen in the JWST images.
Appendix F: FUV attenuation by gas lines and dust
In this section we provide evidence that in irradiated protoplanetary disks, FUV photons at the pumping transitions of the O I fluorescent lines (photons with E≳ 12 eV) can be more quickly removed than photons pumping neutral carbon (E≲ 9.6 eV). Compared to interstellar PDRs, where small dust grains dominate the absorption of FUV photons, gas absorption becomes very important in the upper layers of irradiated protoplanetary disks. This is due to the reduced effective FUV dust absorption cross section, caused by larger grain sizes and possibly higher gas-to-dust mass ratios than in the ISM. We determine that, close to the PDR surface of d203-506 (from AV ≃ 0.05 to ≃ 0.8 mag), C0 photoionization dominates the absorption of FUV photons with λ < 1101 Å (> 11.26 eV). For longer photon wavelengths and for PDR depths higher than AV ≃ 0.8 mag, dust absorption dominates. To be more quantitative, Fig. F.1 shows the evolution of the ratio of the FUV gas absorption coefficient over the dust extinction coefficient as a function of AV for two representative continuum wavelengths: 1100.73 Å (below the C0 ionization threshold; in black) and 1102.50 Å (above this threshold, i.e., not producing C0 ionization; in red). The black curve shows that this ratio reaches nearly a factor of 3 (that is, C0 photoionization dominates over FUV dust absorption), thus producing enhanced absorption of < 1101 Å photons compared to photons at longer wavelengths. This is exemplified by the sharp step, delineated by the green vertical line, in the FUV spectrum of Fig. E.2. This plot shows that FUV photons at the pumping transitions of neutral oxygen atoms (∼1000 Å) are scarcer than those at the pumping transitions of neutral carbon (∼1300 Å).
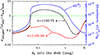 |
Fig. F.1. Evolution of the ratio between the wavelength-dependent FUV gas absorption coefficient and the dust extinction coefficient (absorption plus scattering) as a function of AV for two representative continuum wavelengths: one below the C0 photoionization threshold (black curve) and one above (red curve). For positions where the black curve is greater than 1, C0 photoionization dominates the absorption of FUV photons with λ < 1101 Å. This process reduces the amount of FUV photons that pump the NIR oxygen lines close to the PDR surface. |
Appendix G: Variations in I([C I] 609 μm) and NIR carbon lines with FUV flux and gas density
In this study, we assume that at the physical scales probed by our observations, the density distribution is smooth across the outer disk and inner wind. Therefore, as a first approximation, we adopt constant density models. In PDR environments, the C0 column density, and thus the intensity of the [C I] 609 μm line, are not strong functions of the external FUV flux or gas density. In general, N(C0) somewhat decreases with increasing nH and slightly increases with increasing G0. For the irradiation conditions in the outer layers of d203-506, G0 of a few 104, and gas densities varying between nH = 106 cm−3 and 108 cm−3, the predicted line intensity I([C I] 609 μm) only changes by a factor of 3. Adopting nH = 107 cm−3 in the outer disk and inner wind, I([C I] 609 μm) only increases by a factor of ≲ 2 when the external FUV flux changes from G0 = 103 and 105 (see Fig. G.1). Therefore, with a reasonable knowledge of G0 and nH, the I([C I] 609 μm) line intensity can be used to accurately determine the column density of C0 and, through modeling, the (total) gas-phase carbon abundance, xC = xC+ + xC0 + xCO + ... , in the [C I] 609 μm-emitting layers.
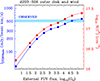 |
Fig. G.1. Grid of constant-density PDR models for varying external FUV radiation fields but fixed nH = 107 cm−3 and xC = 1.4 × 10⁻⁴ values. The red markers show the predicted column density of C0. The blue markers show the predicted [C I] 609 μm line intensity, integrating from AV = 0 to 10 mag into the wind and disk system. The horizontal lines mark the observed line intensity (± σ) in d203-506. |
In our models, however, the NIR carbon lines follow a different emission trend as they are mostly sensitive to the flux of FUV-pumping photons (i.e., to G0; see Fig. G.2). This is a consequence of the negligible collisional (de)excitation of the NIR C0 lines (nH ≪ ncr) and the attenuation of the FUV-pumping photons at high gas densities. At high G0, this makes the column density of C0 that is sensitive to FUV-pumping, N(C ), roughly proportional to G0/nH, and the intensity of the NIR C0 fluorescent lines approximately proportional to nHN(C
 ) ≃ G0. This conclusion applies to both the high-energy C I permitted lines and also the [C I] forbidden lines at 0.8729 μm and ∼0.984 μm (we recall that the later are not observed in the innermost regions, < 1 au, of isolated protoplanetary disks; McClure 2019, but are bright in externally irradiated disks). Therefore, the NIR C0 line intensities depend less on the gas density; they only change by ∼ 30 % if the gas density changes by an order of magnitude compared to the reference model. For the same reason, a reduction of an order of magnitude in the total gas-phase carbon abundance, xC, only changes the intensity of the NIR carbon lines by a factor of ≲ 2. Thus, we conclude that the extended emission from these NIR lines is a powerful probe of external FUV radiation fields impinging on protoplanetary disks in cluster environments.
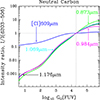 |
Fig. G.2. Grid of constant-density PDR models for varying external FUV radiation fields but fixed nH = 107 cm−3 and xC = 1.4 × 10⁻⁴. Colored curves show the predicted line intensities of the neutral carbon lines discussed in the text relative to the line intensity reference model (G0 = 2 × 10⁴). While the NIR carbon line intensities increase with G0, the [C I] 609 μm line intensity is much less dependent on G0. |
Appendix H: Little H2O freeze-out in the outer disk and wind layers traced by [C I] 609 μm
Water ice is the first ice mantle to condense when dust temperatures cool below Td ≲ 130 K (depending on the assumed gas density, e.g., van Dishoeck et al. 2021). However, water ice photo-desorption and thermal desorption replenishes the gas-phase oxygen abundance and reduces the gas-phase xC/xO ratio. Figure H.1 shows a simple analytical model of the predicted shift of the water freeze out depth (AV, f) at which most undepleted (i.e., not in refractory material) gas-phase oxygen is incorporated into water ice mantles. This plot shows AV, f, in mag of visual extinction from the edge of the wind and disk system. We plot AV, f as a function of the external FUV photon flux, in G0 units, for a typical gas density in the outer disk and inner wind, nH = 107 cm−3, and Tk = Td. This analytical determination of the H2O freeze out depth implies equating the rate at which undepleted gas-phase O atoms stick on grains, Rgr, O (first step in the grain surface formation of water ice) and the photo-desorption rate of water molecules from icy grain surfaces, Rphotodes, H2O. These rates go as  and
and  , respectively, where xO is the undepleted gas-phase abundance of O atoms, Y is the number of desorbed molecules per incident FUV photon, and b is a dust-related FUV field absorption factor (for the basic formalism and standard parameters see e.g., Hollenbach et al. 2009). The water freeze out takes place very close to the irradiated disk surface for high values of the gas density over the FUV flux ratio, nH/G0 ≳ 105 cm−3. However, for strong external FUV radiation fields (G0 > 102 in our representative example), the nH/G0 ratio decreases, and water ice only becomes an abundant oxygen-reservoir deeper inside the disk. In this toy model of the outer disk layers of d203-506, the water freeze out depth shifts by ≃ 4.5 mag (tens of au) compared to isolated disks, that is, beyond the [C I] 609 μm emitting layers (Fig. 4). The blue curve in Fig. H.1 also shows the analytical estimation of the CO freeze-out depth using the rate at which gas-phase CO molecules stick on grains. Nearly all volatile oxygen and carbon in the disk zone traced by [C I] 609 μm and NIR C0 line observations is in the gas-phase, and the gaseous elemental xC/xO abundance ratio is low, close to the solar value in the case of Orion.
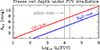 |
Fig. H.1. Shift in the H2O and CO freeze-out depth (simulating the outer disk) with increasing external FUV radiation field. This analytical model assumes nH = 107 cm−3, as in d203-506. The vertical lines show the G0 values compatible with the observed NIR carbon line intensities. |
Our more detailed thermo-photochemical PDR models in Fig. 4 include gas-phase and simple gas-grain exchanges for O, OH, H2O, O2, and CO. These species adsorb on dust grains as temperatures drop, are photo-desorbed by FUV photons, desorb via cosmic-ray impacts, and thermally sublimate (see Putaud et al. 2019, for the inclusion of these processes in the Meudon PDR code). Only for water ice formation we included the grain surface reactions s-H + s-O → s-OH and s-H + s-OH → s-H2O, where s- refers to the species in the solid (see Goicoechea et al. 2021). Thus, while the water ice abundance and H2O freeze-out depths are self-consistently calculated, more detailed grain surface reactions and models will be needed to accurately describe the growth and (photo)processing of carbon-bearing ices under strong external FUV irradiation.
Appendix I: Spectroscopic parameters of neutral atomic carbon lines
Figure H.2 shows a reduced energy-level diagram of neutral carbon including fine-structure splittings. Table I.1 summarizes the spectroscopic parameters and line intensities of the carbon lines discussed in the text (including PDR model predictions).
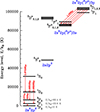 |
Fig. H.2. Lowest-energy states (in K units) of neutral carbon, including the fine-structure levels and brightest NIR and submillimeter lines discussed in the text. Fine-structure splittings are exaggerated for clarity. |
Spectroscopic parameters (from NIST5 and Haris & Kramida 2017) of the neutral carbon lines discussed in the text, intensities of the lines detected by JWST and ALMA in d203-506, and model predictions.
All Tables
Spectroscopic parameters (from NIST5 and Haris & Kramida 2017) of the neutral carbon lines discussed in the text, intensities of the lines detected by JWST and ALMA in d203-506, and model predictions.
All Figures
|
Fig. 1. Images of d203-506 (same field of view). (a): C18O J = 3–2 and [C I] 609 μm integrated line emission (spatially unresolved). Contours show 10σ and 20σ intensity levels for C18O, and 5σ and 10σ for [C I] 609 μm. Synthesized beam sizes are shown at the bottom corner. The apparent larger extent of the C18O emission is due to the larger beam and faint background emission. (b): [C I] 0.9853 μm emission from the photo-evaporative wind observed with NIRSpec (colored image). Orange contours show he 0.8 mm dust continuum observed by ALMA (from Berné et al. 2024). |
| In the text | |
|
Fig. 2. Neutral carbon toward d203-506. Upper: [C I] 609 μm and C18O J = 3–2 line profiles. The gray-shaded spectrum shows HCO+J = 4–3 (Berné et al. 2024) scaled and convolved to the angular resolution of the [C I] 609 μm observations. Lower: NIR detection of [C I] forbidden lines at 0.9827 and 0.9853 μm (top) and C I permitted line multiplets at ∼1.069, ∼1.176, and ∼1.355 μm (bottom). Magenta lines represent the position and relative local thermodynamic equilibrium (LTE) intensity of each component. |
| In the text | |
|
Fig. 3. Models with G0 = 2 × 10⁴ and different values of nH and xC . Red and blue markers show the predicted C0 column density and [C I] 609 μm intensity, respectively, from AV = 0 to 10 mag into the wind and disk system. The gas density derived from H2 observations is ≈107 cm−3 (Berné et al. 2024). The horizontal line marks the observed intensity (±1σ). Circles and triangles represent models with small depletion factors of two and three, respectively. |
| In the text | |
|
Fig. 4. Model of the outer disk and inner wind (nH = 107 cm−3 and G0 = 2 × 10⁴). Upper panel: H2 and H densities and gas and dust temperatures as a function of depth into the disk. Middle: Normalized line emissivity profiles, including NIR C0 lines. Lower: Abundance profiles. |
| In the text | |
|
Fig. A.1. [C I] 609 μm line profile toward d203-506 and the two-component Gaussian fit. The velocity centroid difference of the two components is 2.3 ± 0.4 km s−1 and suggests that the blueshifted emission arises from a slow wind not seen in HCO+ 4–3 emission (see Fig. 2). |
| In the text | |
|
Fig. B.1. [C I] 0.9853 μm observed with NIRSpec (orange contours at 3×10⁻⁴ and 6×10⁻⁴ erg s−1 cm−2 sr−1) over a NIRCam image of the H |
| In the text | |
|
Fig. B.2. Selected JWST/NIRSpec spectra toward d203-506. The red spectrum corresponds to the ON source measurement, which includes emission from the background H II region and the Bar PDR. The intrinsic spectrum of d203-506 is the ON – f ⋅ OFF measurement (with f = 0.95 in blue and f = 1 in cyan). The scaling factor, f, is determined from the nebular He I recombination lines (see the main text). These spectra show NIR carbon lines (permitted and forbidden), [Fe II], and vibrationally excited H2 and OH lines (Zannese et al. 2024), among other species (see Berné et al. 2024). However, NIR O I fluorescent lines are not detected in the ON–OFF spectrum. These FUV-pumped O I fluorescent lines appear in the ON spectrum and arise from predominantly atomic gas close behind the ionization front of the Bar (the Δ feature; Haworth et al. 2023; Peeters et al. 2024). |
| In the text | |
|
Fig. D.1. NIR carbon line intensity ratios predicted by the recombination theory of Escalante & Victor (1990). Curves represent the expected ratios under Case B (continuous) and Case A (dashed) conditions, taken from Walmsley et al. (2000). The blue-shaded area shows the line ratios in d203-506 that are compatible with the observations. See the main text. |
| In the text | |
|
Fig. E.1. Reduced Gotrian diagram of C0 showing up to the electronic levels associated with the NIR lines discussed in this study. The figure also includes the main FUV-pumping lines (in blue) of the detected NIR C0 lines, as well as the submm fine-structure lines within the ground state detectable with ALMA (in green; energy level splitting is exaggerated). |
| In the text | |
|
Fig. E.2. External FUV radiation field (in energy density) propagating inside the photoevaporating wind and outer disk surface (reference model of d203-506 with G0 = 2 × 10⁴ and nH = 107 cm−3). The upper panels (blue spectra) are for a slab position at AV = 0.1 mag (close to the PDR surface), whereas the lower panels (red spectra) are for a position deeper inside the PDR, at AV = 0.5 mag. The disk-depth-dependent FUV field results from a FUV radiative transfer calculation that includes gas absorption, H2 fluorescent emission, and grain absorption and scattering. The resulting FUV continuum and line emission are modulated by strong H I absorption lines (Ly-α and Ly-β lines are indicated in this figure) and by a forest of H2 absorption and fluorescent emission lines. The black vertical lines show the wavelength position of the main C0 pumping transitions at 1277, 1279, and 1280 Å (∼9.6 eV). The vertical dashed gray lines show the wavelength position of the main O0 pumping transitions at 1027 and 1040 Å (∼12 eV). These photons are quickly absorbed by small column densities of gas, mainly via C0 photoionization below 1101 Å for AV < 1 mag (Fig. F.1). Lower-energy FUV photons propagate deeper inside the disk and are attenuated by dust grains. |
| In the text | |
|
Fig. F.1. Evolution of the ratio between the wavelength-dependent FUV gas absorption coefficient and the dust extinction coefficient (absorption plus scattering) as a function of AV for two representative continuum wavelengths: one below the C0 photoionization threshold (black curve) and one above (red curve). For positions where the black curve is greater than 1, C0 photoionization dominates the absorption of FUV photons with λ < 1101 Å. This process reduces the amount of FUV photons that pump the NIR oxygen lines close to the PDR surface. |
| In the text | |
|
Fig. G.1. Grid of constant-density PDR models for varying external FUV radiation fields but fixed nH = 107 cm−3 and xC = 1.4 × 10⁻⁴ values. The red markers show the predicted column density of C0. The blue markers show the predicted [C I] 609 μm line intensity, integrating from AV = 0 to 10 mag into the wind and disk system. The horizontal lines mark the observed line intensity (± σ) in d203-506. |
| In the text | |
|
Fig. G.2. Grid of constant-density PDR models for varying external FUV radiation fields but fixed nH = 107 cm−3 and xC = 1.4 × 10⁻⁴. Colored curves show the predicted line intensities of the neutral carbon lines discussed in the text relative to the line intensity reference model (G0 = 2 × 10⁴). While the NIR carbon line intensities increase with G0, the [C I] 609 μm line intensity is much less dependent on G0. |
| In the text | |
|
Fig. H.1. Shift in the H2O and CO freeze-out depth (simulating the outer disk) with increasing external FUV radiation field. This analytical model assumes nH = 107 cm−3, as in d203-506. The vertical lines show the G0 values compatible with the observed NIR carbon line intensities. |
| In the text | |
|
Fig. H.2. Lowest-energy states (in K units) of neutral carbon, including the fine-structure levels and brightest NIR and submillimeter lines discussed in the text. Fine-structure splittings are exaggerated for clarity. |
| In the text | |
Current usage metrics show cumulative count of Article Views (full-text article views including HTML views, PDF and ePub downloads, according to the available data) and Abstracts Views on Vision4Press platform.
Data correspond to usage on the plateform after 2015. The current usage metrics is available 48-96 hours after online publication and is updated daily on week days.
Initial download of the metrics may take a while.