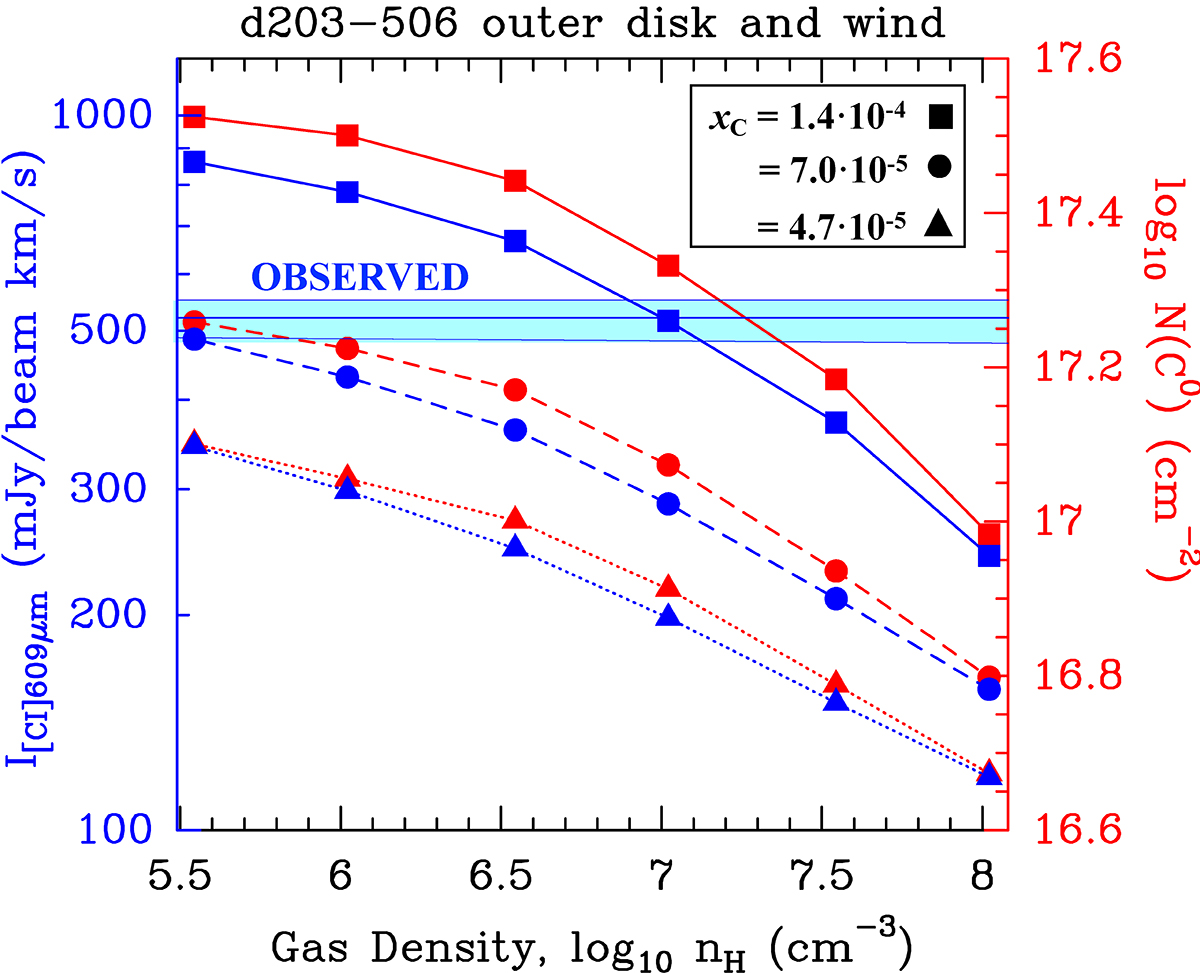
Fig. 3.
Download original image
Models with G0 = 2 × 10⁴ and different values of nH and xC . Red and blue markers show the predicted C0 column density and [C I] 609 μm intensity, respectively, from AV = 0 to 10 mag into the wind and disk system. The gas density derived from H2 observations is ≈107 cm−3 (Berné et al. 2024). The horizontal line marks the observed intensity (±1σ). Circles and triangles represent models with small depletion factors of two and three, respectively.
Current usage metrics show cumulative count of Article Views (full-text article views including HTML views, PDF and ePub downloads, according to the available data) and Abstracts Views on Vision4Press platform.
Data correspond to usage on the plateform after 2015. The current usage metrics is available 48-96 hours after online publication and is updated daily on week days.
Initial download of the metrics may take a while.