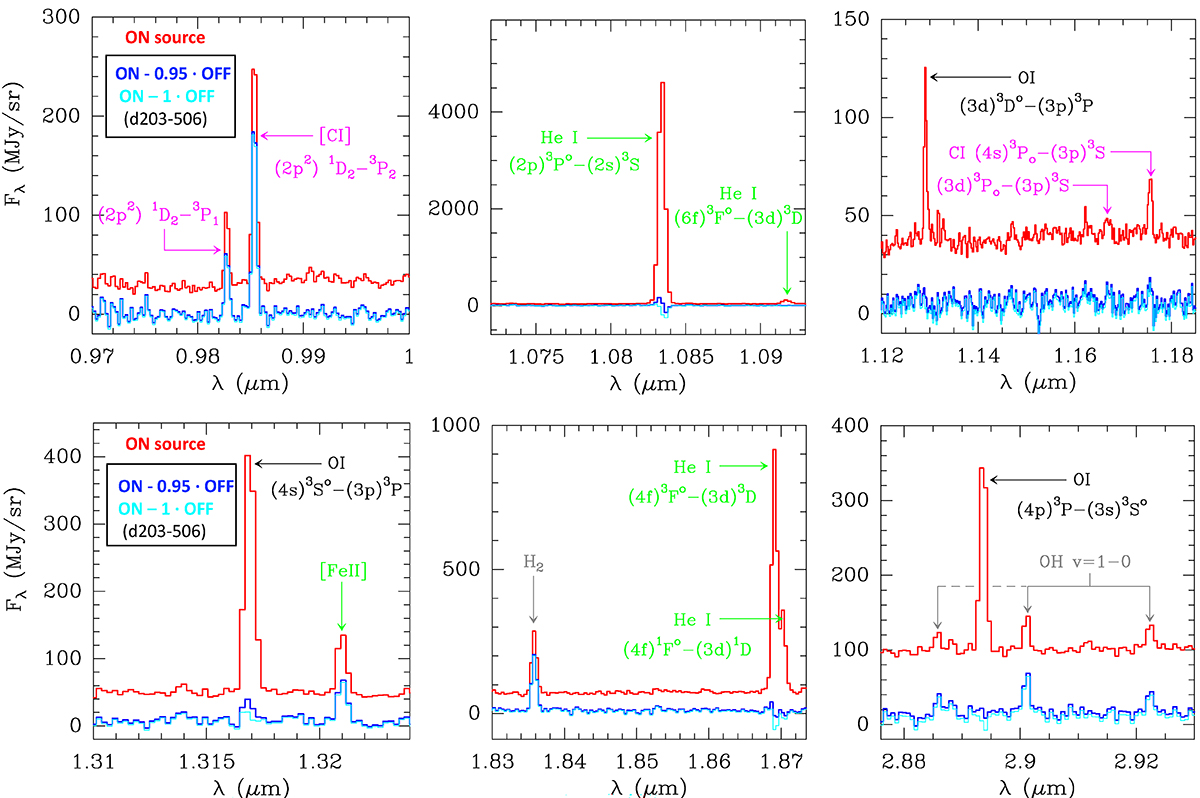
Fig. B.2.
Download original image
Selected JWST/NIRSpec spectra toward d203-506. The red spectrum corresponds to the ON source measurement, which includes emission from the background H II region and the Bar PDR. The intrinsic spectrum of d203-506 is the ON – f ⋅ OFF measurement (with f = 0.95 in blue and f = 1 in cyan). The scaling factor, f, is determined from the nebular He I recombination lines (see the main text). These spectra show NIR carbon lines (permitted and forbidden), [Fe II], and vibrationally excited H2 and OH lines (Zannese et al. 2024), among other species (see Berné et al. 2024). However, NIR O I fluorescent lines are not detected in the ON–OFF spectrum. These FUV-pumped O I fluorescent lines appear in the ON spectrum and arise from predominantly atomic gas close behind the ionization front of the Bar (the Δ feature; Haworth et al. 2023; Peeters et al. 2024).
Current usage metrics show cumulative count of Article Views (full-text article views including HTML views, PDF and ePub downloads, according to the available data) and Abstracts Views on Vision4Press platform.
Data correspond to usage on the plateform after 2015. The current usage metrics is available 48-96 hours after online publication and is updated daily on week days.
Initial download of the metrics may take a while.