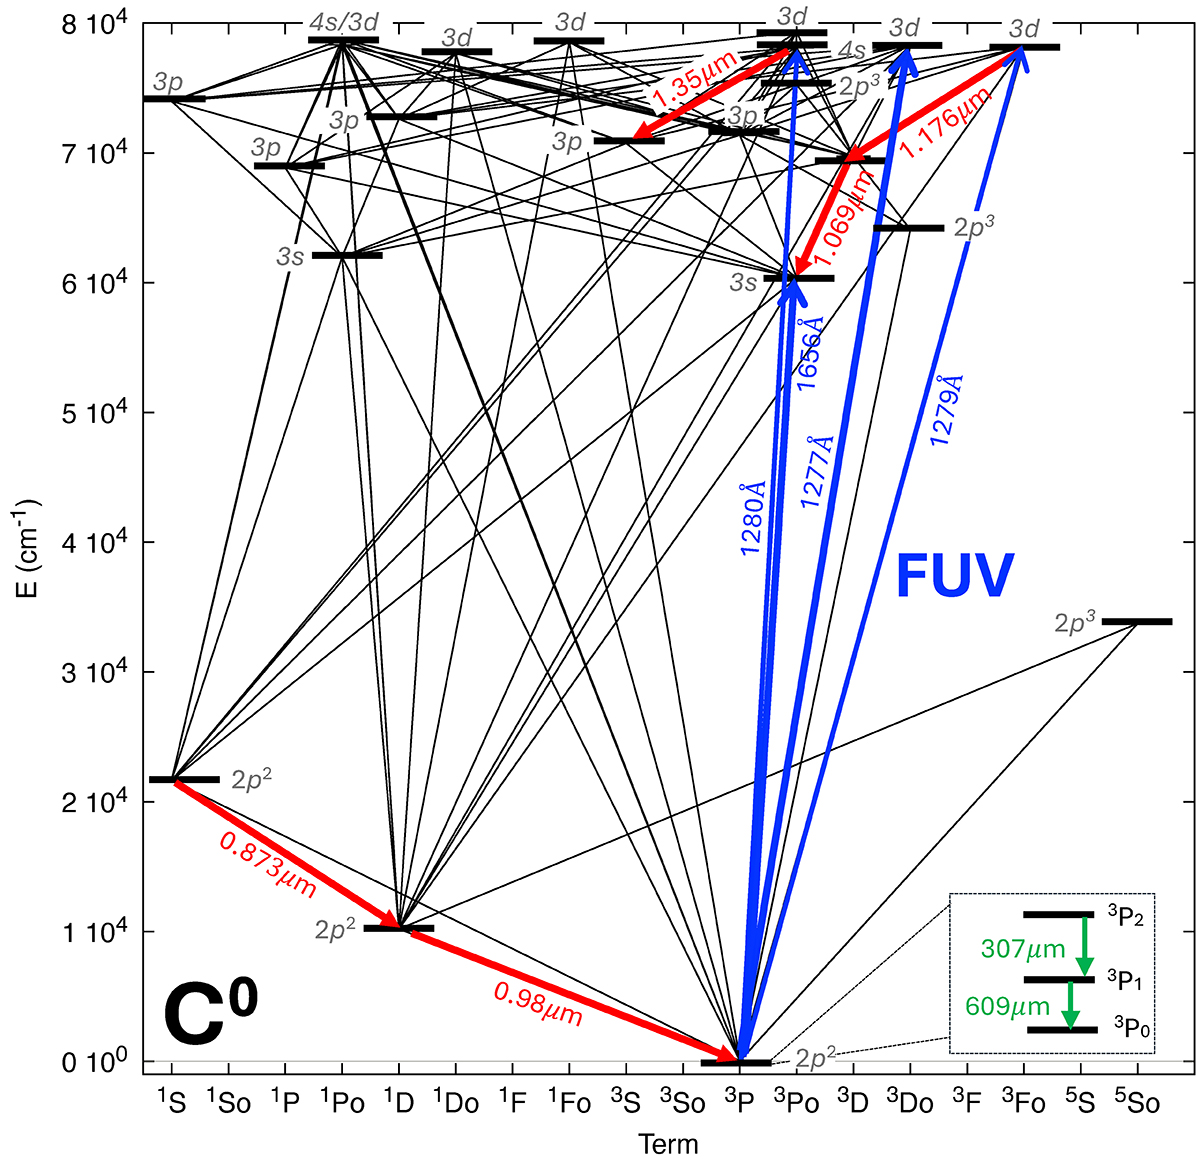
Fig. E.1.
Download original image
Reduced Gotrian diagram of C0 showing up to the electronic levels associated with the NIR lines discussed in this study. The figure also includes the main FUV-pumping lines (in blue) of the detected NIR C0 lines, as well as the submm fine-structure lines within the ground state detectable with ALMA (in green; energy level splitting is exaggerated).
Current usage metrics show cumulative count of Article Views (full-text article views including HTML views, PDF and ePub downloads, according to the available data) and Abstracts Views on Vision4Press platform.
Data correspond to usage on the plateform after 2015. The current usage metrics is available 48-96 hours after online publication and is updated daily on week days.
Initial download of the metrics may take a while.