Open Access
Fig. A.1.
Download original image
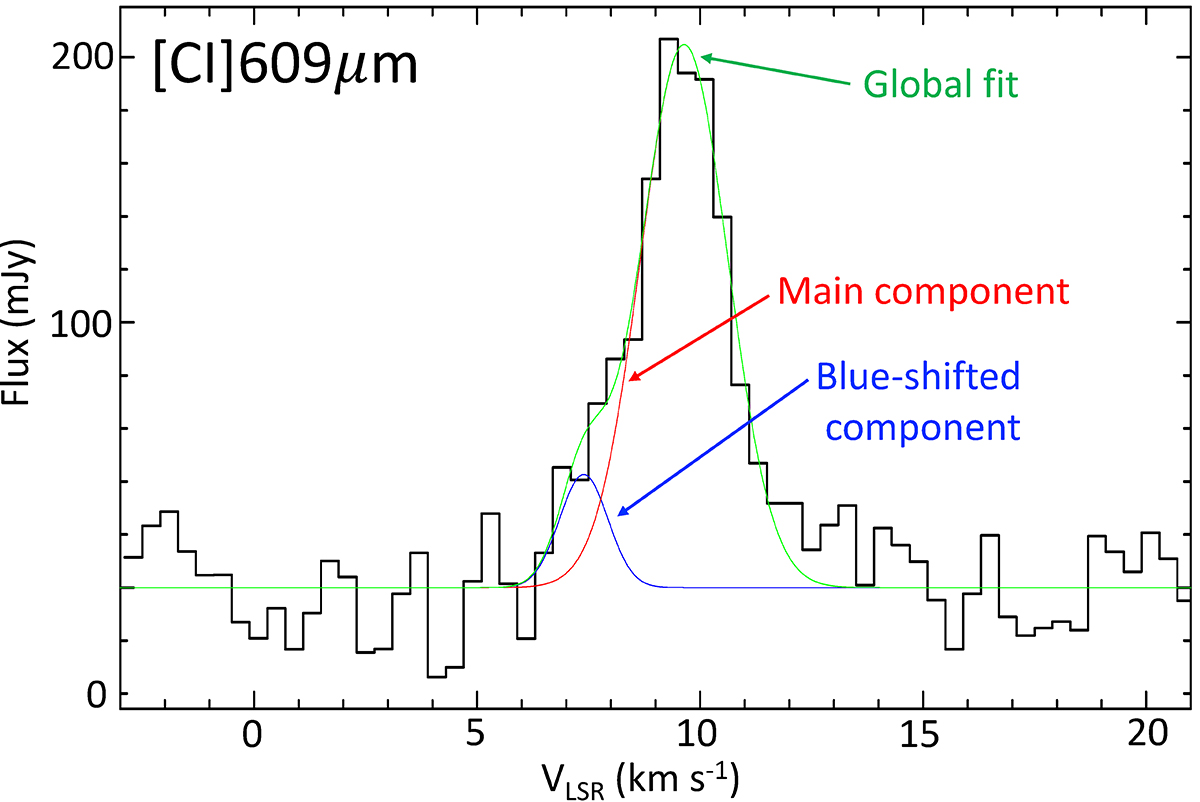
[C I] 609 μm line profile toward d203-506 and the two-component Gaussian fit. The velocity centroid difference of the two components is 2.3 ± 0.4 km s−1 and suggests that the blueshifted emission arises from a slow wind not seen in HCO+ 4–3 emission (see Fig. 2).
Current usage metrics show cumulative count of Article Views (full-text article views including HTML views, PDF and ePub downloads, according to the available data) and Abstracts Views on Vision4Press platform.
Data correspond to usage on the plateform after 2015. The current usage metrics is available 48-96 hours after online publication and is updated daily on week days.
Initial download of the metrics may take a while.