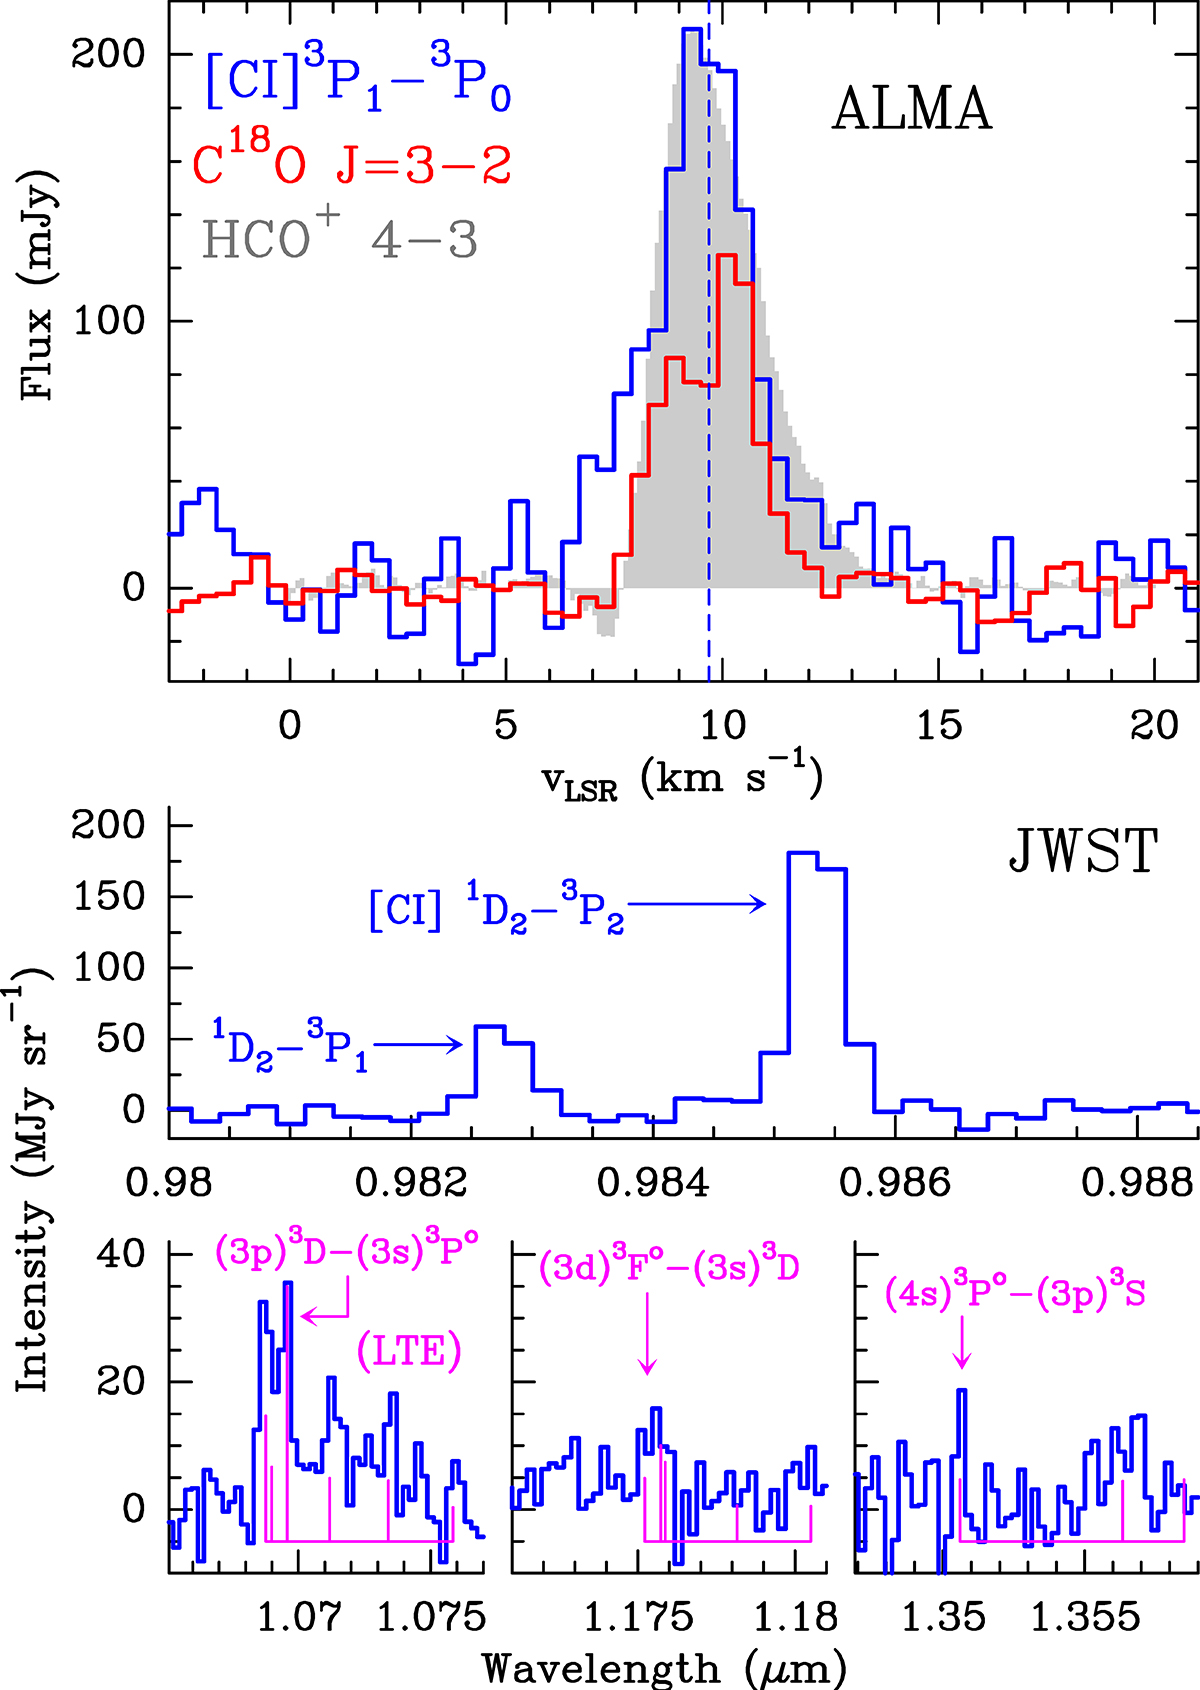
Fig. 2.
Download original image
Neutral carbon toward d203-506. Upper: [C I] 609 μm and C18O J = 3–2 line profiles. The gray-shaded spectrum shows HCO+J = 4–3 (Berné et al. 2024) scaled and convolved to the angular resolution of the [C I] 609 μm observations. Lower: NIR detection of [C I] forbidden lines at 0.9827 and 0.9853 μm (top) and C I permitted line multiplets at ∼1.069, ∼1.176, and ∼1.355 μm (bottom). Magenta lines represent the position and relative local thermodynamic equilibrium (LTE) intensity of each component.
Current usage metrics show cumulative count of Article Views (full-text article views including HTML views, PDF and ePub downloads, according to the available data) and Abstracts Views on Vision4Press platform.
Data correspond to usage on the plateform after 2015. The current usage metrics is available 48-96 hours after online publication and is updated daily on week days.
Initial download of the metrics may take a while.