| Issue |
A&A
Volume 683, March 2024
|
|
|---|---|---|
| Article Number | A15 | |
| Number of page(s) | 17 | |
| Section | The Sun and the Heliosphere | |
| DOI | https://doi.org/10.1051/0004-6361/202347927 | |
| Published online | 29 February 2024 | |
Coronal dimmings as indicators of the direction of early coronal mass ejection propagation
1
Skolkovo Institute of Science and Technology, Bolshoy Boulevard 30, bld. 1, 121205 Moscow, Russia
e-mail: shantanu.jain@skoltech.ru
2
NorthWest Research Associates, 3380 Mitchell Lane, Boulder, CO 80301, USA
3
University of Graz, Institute of Physics, Universitätsplatz 5, 8010 Graz, Austria
4
University of Graz, Kanzelhöhe Observatory for Solar and Environmental Research, Kanzelhöhe 19, 9521 Treffen, Austria
Received:
9
September
2023
Accepted:
17
November
2023
Context. Coronal mass ejections (CMEs) are large-scale eruptions of plasma and magnetic field from the Sun that can cause severe disturbances in space weather. Earth-directed CMEs are responsible for the disruption of technological systems and damaging power grids. However, the early evolution of CMEs, especially Earth-directed ones, is poorly tracked using traditional coronagraphs along the Sun-Earth line.
Aims. The most distinct phenomena associated with CMEs in the low corona are coronal dimmings, which are localized regions of reduced emission in the extreme-ultraviolet (EUV) and soft X-rays formed due to mass loss and expansion during a CME. We present a new approach to estimating the early CME propagation direction based on the expansion of coronal dimmings.
Methods. We developed the Dimming InfeRred Estimate of CME Direction (DIRECD) method. First, we performed simulations of CMEs in 3D using a geometric CME cone model and varying parameters such as width, height, source location, and deflection from the radial direction to study their influence on the CME projection onto the solar sphere. Second, we estimated the dominant direction of the dimming extent based on the evolution of the dimming area. Third, using the derived dominant direction of the dimming evolution on the solar sphere, we solved an inverse problem to reconstruct an ensemble of CME cones at different heights, widths, and deflections from the radial propagation. Finally, we searched for which CME parameter combinations the CME orthogonal projections onto the solar sphere would match the geometry of the dimming at the end of its impulsive phase best; we did so to derive the CME direction in 3D. We tested our approach on two case studies on 1 October, 2011 and 6 September, 2011. We also validated our results with 3D tie-pointing of the CME bubble in an EUV low corona and with 3D reconstructions by graduated cylindrical shell modeling (GCS) of white-light CMEs higher up in the corona.
Results. Using DIRECD, we found that the CME on 1 October, 2011 expanded dominantly toward the south-east, while the CME on 6 September, 2011 was inclined toward the north-west. This is in agreement with the CME direction estimates from previous studies using multi-viewpoint coronagraphic observations.
Conclusions. Our study demonstrates that coronal dimming information can be used to estimate the CME’s direction early in its evolution. This allows us to provide information on the CME direction before it is observed in the coronograph’s field of view, which is of practical importance for space weather forecasting and the mitigation of potential adverse impacts on Earth.
Key words: Sun: activity / Sun: corona / Sun: coronal mass ejections (CMEs)
© The Authors 2024
 Open Access article, published by EDP Sciences, under the terms of the Creative Commons Attribution License (https://creativecommons.org/licenses/by/4.0), which permits unrestricted use, distribution, and reproduction in any medium, provided the original work is properly cited.
This article is published in open access under the Subscribe to Open model. Subscribe to A&A to support open access publication.
1. Introduction
Coronal mass ejections (CMEs) are the most powerful events in the Solar System that cause severe disturbances of our space weather. They are clouds of magnetized plasma that are expelled from the Sun with speeds of more than 3000 km s−1 (Rodríguez Gómez et al. 2020; Michalek et al. 2009; Tsurutani & Lakhina 2014; Gopalswamy et al. 2009b; Veronig et al. 2018). CMEs can be harmful to technological systems as they can, for example, affect radio transmission, induce currents in power grid systems, and lower the orbits of satellites orbiting the Earth (Sandford 1999; Doherty et al. 2004; Baker et al. 2013). Thus, to have proper lead times, it is important to detect and study the early evolution of CMEs, in particular Earth-directed ones. Since early CME evolution is not observed well with coronagraphs and since Earth-directed CMEs are prone to strong projection effects (Schwenn et al. 2005), it is important to explore whether CME-associated phenomena may provide additional information on the CME properties.
The most distinct phenomena associated with CMEs are coronal dimmings, which are manifested as regions of reduced extreme ultraviolet (EUV) and X-ray emissions in the low corona (Hudson et al. 1996; Sterling & Hudson 1997; Thompson et al. 1998). This sudden reduction in the coronal emission is attributed to the expansion of the CME structure resulting in density and mass depletion. This interpretation is supported by differential emission measure (DEM) studies showing substantial density drops in dimming regions (e.g., Cheng et al. 2012; Vanninathan et al. 2018; Veronig et al. 2019) and spectroscopic observations of strong outflows (e.g., Harra & Sterling 2001; Jin et al. 2009; Tian et al. 2012). The close relationship between the early evolution of CMEs and coronal dimmings in the low corona has been investigated in a number of studies. There have been several case studies analyzing the relation between coronal dimmings and CME mass (e.g., Harrison & Lyons 2000; Harrison et al. 2003; Zhukov & Auchère 2004; López et al. 2017; Wang et al. 2023) showing strong positive correlation, the morphology and early evolution of the CME (Attrill et al. 2006; Qiu & Cheng 2017), and their timing (Miklenic et al. 2011). In addition, studies have also investigated the statistical relationship between CMEs and coronal dimmings (Bewsher et al. 2008; Reinard & Biesecker 2009; Mason et al. 2016; Krista & Reinard 2017; Aschwanden 2017; Dissauer et al. 2018a, 2019). It was found that the CME mass shows a high correlation with dimming area, dimming brightness, and the magnetic flux covered by the dimming region, while the maximum speed of the CME is strongly correlated with the corresponding time derivatives (i.e., area growth rate, brightness change rate, and magnetic flux rate) and the mean intensity of the dimmings (Dissauer et al. 2018b, 2019; Chikunova et al. 2020).
Since CMEs influence the space weather around Earth and other planets, an understanding of the CME trajectory is of the utmost importance. There have been several attempts to determine the propagation direction of CMEs and their deflections (Hildner 1977; MacQueen et al. 1986) using coronagraph measurements. With the launch of the STEREO mission and the possibility to simultaneously observe CMEs from multiple viewpoints in the heliosphere, a variety of methods have been developed and applied to reconstruct the 3D direction and geometry of CMEs (Thernisien et al. 2006; Mierla et al. 2010; Isavnin et al. 2013; Liewer et al. 2015; Kay et al. 2017). Several studies have tried to model the CME propagation and deflection using a graduated cylindrical shell (GCS) model (Thernisien et al. 2006; Thernisien 2011) by varying certain CME parameters such as width, height, tilt, latitude, longitude etc. (Gui et al. 2011; Kay et al. 2017; Temmer et al. 2017). Byrne et al. (2010) used an elliptical tie-pointing method to create a 3D model of CMEs and found that the deflections obtained for the events concerned by the study were consistent with the in situ observations. Liu et al. (2010) reconstructed 3D models of several events using a geometric triangulation method and showed that this method can link solar observations with corresponding in situ signatures at 1 AU and predict CME arrival at Earth. Lugaz et al. (2011, 2012) studied CME deflection using magneto-hydrodynamic models (MHD) and found no strong rotation of 22 August, 2005 CME as it propagated. However, 23–24 May, 2010 CMEs showed a strong deflection after collision.
Zuccarello et al. (2012), Kilpua et al. (2009) showed that during solar minima, CMEs originating from high latitude can be easily deflected toward the heliospheric current sheet (HCS) as a result of the influence of the magnetic field within a coronal hole (CH), eventually resulting in geoeffective events. This phenomenon primarily occurs during periods of solar minimum and applies specifically to CMEs with very slow velocities. These slower CMEs encounter challenges in overcoming the restraining influence of the magnetic field above them. Consequently, they tend to be steered by the polar coronal magnetic fields, leading to in situ effects occurring in close proximity to the ecliptic plane. Gopalswamy et al. (2009a) showed that the coronal holes may have deflected the associated coronal mass ejections away from the Sun-Earth line during the declining phase of solar cycle 23. Sahade et al. (2020) established a relation between CH properties, the location of the minimum magnetic field region and CME deflection to show that the minimum magnetic energy region, responsible for the deflection, is associated with the presence of the CH near the CME. In addition, CMEs can also be channeled by the active region coronal magnetic field itself (Möstl et al. 2015; Wang et al. 2015). Shen et al. (2011) showed evidence that the trajectory of the CME was influenced by the background magnetic field, and the CME tends to propagate toward the region with lower magnetic energy density. Gui et al. (2011) extended the work with additional observations and showed that the CME deflection is consistent with the direction of the background gradients. ForeCAT, developed by (Kay et al. 2013), serves to forecast CME deflections using magnetic forces and CME rotations (Kay et al. 2015). Using ForeCAT, Kay et al. (2016) found that CME deflections for 8 April, 2010 and 12 July, 2012 events. Mierla et al. (2010) compared different CME reconstruction techniques to find CME properties such as the speed, mass, and direction of propagation. The different reconstruction techniques estimated the most probable CME propagation direction at the outer boundary of the corona (observed in coronagraph images) to be within 10° of each other. The relationship between coronal dimmings, CME propagation, and deflection has not been directly investigated in the literature yet, although there exist several studies that highlight its importance. Thompson et al. (2000) analyzed seven CMEs that occurred between 23 April and 9 May, 1998, and found that the extended dimming areas in these events generally mapped out the apparent “footprint” of the CME as observed by white-light coronagraphs. Some studies have also tracked the CME and high-speed solar-wind (HSS) interaction (Heinemann et al. 2019) and CME-shock interactions (Möstl et al. 2015). Both studies show the dimming evolution and study the direction. In a recent study, Chikunova et al. (2023) demonstrated that the overall dimming morphology closely reflects the inner part of the 3D GCS reconstruction of a CME, linking the 2D dimming to the 3D CME bubble and suggesting the use of dimming observations to obtain insight into the CME direction. The SunCET mission (Mason et al. 2021), dedicated to the study of CME acceleration processes, suggests using coronal dimmings as a source of information on the Earth-directed CMEs.
In this paper, we present a new method called Dimming InfeRred Estimate of CME Direction (DIRECD), which uses the extent and morphology of coronal dimmings to estimate the early 3D direction of the corresponding CME. We tested our approach on case studies of two well-observed dimmings and CMEs on 1 October, 2011 and 6 September, 2011. We note that in this study we focus on dimmings due to the expansion and evacuation of mass by the erupting CME, but not on shallower dimmings interpreted as the rarefaction regions propagating behind EUV waves (Muhr et al. 2011; Vršnak et al. 2016; Veronig et al. 2018; Podladchikova et al. 2019).
2. Methods and analysis
Our method is based on certain assumptions regarding the relationship between dimmings and CMEs, as well as their key parameters influencing this connection. Several important parameters influence the correlation between dimmings and CMEs, including the height at which the CME remains connected to the dimming, the CME width, the inclination from the radial propagation, and the source location. In our analysis, we considered the dimming at the end of the impulsive phase, that is, the time range within which the majority of the dimming region develops (see Dissauer et al. 2018a) and when the connections between expanding CMEs (leaving imprints in the solar corona and dimming) are fully formed.
Our approach to identify the early propagation of CMEs from the expansion of dimmings involves the following main steps. First, we simulated CMEs in 3D using a geometric cone model to establish the relation between the 3D CME and the 2D projection on the solar disk in the form of the dimming. We investigate how the orthogonal projections of the cone onto the solar sphere (which can be considered as dimming signatures) depend on various sets of CME parameters such as width, height, source location, and inclination from the radial propagation (Sect. 2.1). Second, we determined the dominant direction of dimming development by observing how the dimming area evolves (Sect. 2.2). Third, using the identified dominant direction of dimming evolution on the solar sphere, we addressed an inverse problem to reconstruct a set of CME cones at various heights, widths, and deviations from radial propagation. Then, we searched for the CME parameters, for which the CME orthogonal projections onto the solar sphere would match the geometry of the dimming at the end of its impulsive phase. Finally, we determined the resulting 3D direction of the CME, including the direction with respect to the inclination from the radial direction in both the east-west and north-south planes (Sect. 2.3). We utilized the DIRECD method in our analysis, focusing on the event that occurred on October 1, 2011 (Sects. 2.2 and 2.3) and compared them with the 3D reconstructions obtained from STEREO/EUVI images (Sect. 4). Additionally, we applied this approach to examine the fast event that occurred on September 6, 2011 (Sect. 3).
2.1. Simulations with a CME cone model
Coronal mass ejections occur in many different shapes, and thus constructing CME models that can fit the observations is the first important step in any CME direction study. In order to relate the 2D on-disk dimming signature to the 3D CME structure, we modeled the CME as a cone (Zhao et al. 2002; Xie et al. 2004; Mays et al. 2015) with certain direction, height, and width, and derived the orthogonal projections onto the solar sphere, which we took as an estimate of how the plasma evacuation would be manifested as a coronal dimming when projected onto the solar sphere.
Figure 1 shows examples of CME cones in 3D, where panel a shows the case where the CME cone propagates in the radial direction along the OC’ line and has an angular width of ϕ = 28°. Here, point O indicates the center of the Sun, and points C (source region on the solar sphere) and P (top point of the cone central axis) belong to the OC’ line. Panel b shows the cone along CP, which is inclined with respect to the radial direction OC’ by an angle of β = 25°. Throughout the text, we call the angle β the inclination angle.
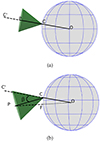 |
Fig. 1. CME cone model. Panel a shows the cone in the radial direction with an angular width of ϕ = 28°, while panel b represents the same cone inclined from the radial direction by an angle of β = 25.52°. Point C is the source region on the solar sphere, P is the top point of the cone central axis, O is the center of the Sun, and F is the orthogonal projection of the point P onto the solar sphere. |
We modeled a CME cone for various combinations of CME parameters such as CME source location, width, and inclination angle, and derived their orthogonal projections onto the solar sphere as an estimate of how the coronal dimming shape might look. We show simulations at nine different source region locations, where one is in the disk center, and the other eight are in four quadrants (2 points per quadrant: one near the disk center and the other one near the limb). Throughout the text, quadrant 1 refers to the top right (NW) part of the solar sphere, quadrant 2 refers to the top left (NE), quadrant 3 refers to the bottom left (SE), and quadrant 4 refers to the bottom right (SW).
Figure 2 shows a CME simulation in quadrant 3 (near center) as an example. The sphere and cone are constructed in such a way that the vertical direction corresponds to the Z-axis (solar north or south), the horizontal one corresponds to the Y-axis(solar east or west), and the X-axis is perpendicular to both these axes. The CME is modeled using two cones of different angular widths (15° and 30°) and maximum height of 1 Rsun above the solar surface. The first two columns from the left show the CME and the orthogonal projections onto the sphere for 30° in width, whereas the two columns from the right show the CME and the orthogonal projections onto the sphere for 15°.
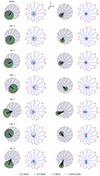 |
Fig. 2. Simulation of CME cone and its orthogonal projection in quadrant 3 (near center). From left to right: CME cone with 30° of angular width (Col. 1) and its orthogonal projection (Col. 2) on the solar sphere; the CME cone with 15° of angular width (Col. 3) and its orthogonal projection (Col. 4). From top to bottom: first row shows the radial direction; second and third rows show the case of ±30° from inclination from the X-axis direction in the YZ plane; fourth and fifth rows show ±30° inclination from the Y-axis direction; sixth and seventh rows show ±30° inclination from the Z-axis direction. The orthogonal projections at 0.2Rsun, 0.5Rsun, and 1Rsun are shown by cyan, green, and red markers. The gray markers show the projections of intermediate heights from 0.1–1Rsun. |
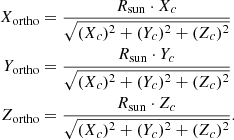
The orthogonal projections of the all cone points are derived using the following relations (and are plotted in Fig. 2 on the sphere, with gray dots representing the CME-related dimming expansion):
Here, Xortho, Yortho, and Zortho are the coordinates of orthogonal projections, Xc, Yc, and Zc are the coordinates of the cone in 3D (in HEEQ), and Rsun is the radius of the Sun in kilometers. Additionally, we show the orthogonal projections at 0.2 Rsun (cyan markers), 0.5 Rsun (green markers), and 1 Rsun (red markers). The solar sphere is divided into 12 angular sectors of 30° in width each (see more details in Sect. 2.2). Black lines indicate the cone central axis (Cols. 1 and 3) and its orthogonal projection (Cols. 2 and 4).
As can be seen from the first row (top panel) in Fig. 2, for the radial cone, the CME projections form concentric circles around the source location of the cone. The area of the CME projection increases with the growth of the CME height and width. The second and third rows in Fig. 2 represent the CME cone inclined at an angle of ±30° from the X-axis direction in the YZ plane. As can be seen, the projections are no longer concentric circles but ellipses with the largest extension at sector 4 for a +30° and sector 9 for −30° inclination. For the inclinations in the Y-axis direction (fourth and fifth rows), the CME projections show the largest extent on the border between sectors 10 and 11 for +30° and sectors 4 and 5 for −30°. Inclinations in the Z-axis direction (sixth and seventh rows) produce the CME projections mainly located in sectors 1, 2, and 12 for +30° and in sectors 7, 8, and 9 for −30°. Thus, as can be seen from Fig. 2, the CME height, width, and inclination from the radial direction affect the geometry of the CME orthogonal projections. To illustrate the geometry of CME projections in more detail, Figs. A.1–A.8 in show simulations of CME cones originating from other source locations.
2.2. Determination of dominant dimming expansion
We demonstrate the method for estimating the dominant dimming expansion on a case study of the 1 October, 2011 CME event that originated close to the center of the Sun. Temmer et al. (2017) analyzed this event to better understand the dynamic evolution of the CME and its embedded magnetic field and tracked the temporal and spatial evolution of the CME in the interplanetary space by reconstructing the CME using the GCS model. The source location of the flare was N10 W06. The authors estimated that the interplanetary CME (ICME) arrived at Earth after four days with an impact speed of 426 ± 30 km s−1. Furthermore, the ICME caused a weak geomagnetic storm peak Dst of −43 nT.
To estimate the dominant direction of dimming expansion, we followed the approach introduced in Chikunova et al. (2023). We first segmented the dimming region with an automated detection technique based on thresholding and region growing (Dissauer et al. 2018b; Chikunova et al. 2020). The detection algorithm uses a sequence of logarithmic base ratio images from the 211 Å filter of the Atmospheric Imaging Assembly (AIA; Lemen et al. 2012) onboard the Solar Dynamics Observatory (SDO; Pesnell et al. 2012), from which we derived both instantaneous (for a particular time step) and cumulative (for all time steps within the particular time range) dimming maps. From the dimming area evolution A(t) derived from these maps (Fig. 3a), we obtain the end time of the impulsive dimming growth. According to Dissauer et al. (2018b), this is defined as the time when the cumulative dimming area growth rate dA/dt has decreased to 15% of its maximum (Fig. 3b).
 |
Fig. 3. Expansion of dimming area At (top panel) and its time derivative dA/dt (bottom panel) over 3 h for the 1 October, 2011 event. The end of the impulsive phase is defined as the time when the derivative of the dimming area curve, dA/dt, has declined back to 15% of its maximum value. |
Figure 4 shows the evolution of the detected cumulative dimming mask within the first 2.5 h after the start of the CME on 1 October, 2011 at 09:44 UTC as observed from coronagraphs. We analyzed the dimming extent at the end (c) of the dimming impulsive phase, when the connections between the dimming and CME were fully formed. Each individual pixel of the presented cumulative dimming pixel mask is colored according to when it was first detected from the start time of the flare or CME event. Blue regions were identified at the beginning of the event, whereas the red regions were detected later.
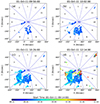 |
Fig. 4. Dimming evolution for 1 October, 2011 CME at (a) the maximum of the impulsive phase (reached 12 min after its start); (b) 18 min after the start of event; (c) at the end of the impulsive phase (30 min after the maximum of the impulsive phase); and (d) 2.5 h after the start. The blue lines indicate 12 angular sectors and the color bar shows when each dimming pixel was detected for the first time. |
Using the same coordinate system as in Fig. 2 centered at the source region, we split the solar sphere into 12 angular sectors of 30° in width and derived the dimming area profiles A(t) in each sector. The sectors are numbered in a counterclockwise direction with sector 1 pointing toward the north. Figure 5 shows the resulting dimming area profile as a function on the sector number (a) and the detected cumulative dimming mask (b) for 1 October, 2011 at the end of the impulsive phase (10:26 UT). To achieve a more accurate estimate of the dimming area on the sphere, and in particular close to the solar limb, we used an approach presented in Chikunova et al. (2023) that allows us to estimate the surface area of a sphere for every pixel1. As can be seen in Fig. 5, the dominant dimming direction is defined by the sector of largest cumulative dimming area extent, which in this case is sector 6.
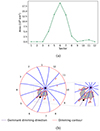 |
Fig. 5. Dominant direction of dimming expansion at the end of impulsive phase for 1 October, 2011. Top: Dimming area in different sectors (shown in the bottom panels), showing its maximum at sector 6. Bottom: Cumulative dimming pixel mask outlined by gray with red contours. The blue lines indicate the 12 sectors. The dashed purple line indicates the sector of dominant dimming development. The black dots show the dimming edges (one of them being the source) in the sector of dominant dimming which are used to generate the CME cones at different heights, associated widths and inclination angles. |
2.3. Connecting the dimming and CME propagation direction
Once the dominant dimming direction was determined, we created an ensemble of CME cones that originated at the source location and extended into 3D space such that the edges of the cone’s orthogonal projections remain confined within the dimming edges (see Fig. 5b). We first constructed two 3D lines, where one line connects the center of the Sun and the source location, and the second line goes through the center of the Sun and the edge of the dimming along the dominant dimming direction (Fig. 6, black lines). In case the dimming is developing around the source region, the edge of the dimming that is opposite to the dominant dimming direction could be chosen instead of the source location. We then generated an ensemble of cones in 3D, where the edges are confined by these 3D lines (Fig. 6, colored cones). This enables the CME cone projections to fit the dimming geometry along the direction of dominant dimming evolution. Moreover, each CME cone in this ensemble will have a unique height (measured perpendicularly to the solar sphere) at which the CME remains connected to the dimming and which is uniquely associated with a certain width and inclination angle.
 |
Fig. 6. Ensemble of cones of different heights, widths, and inclination angles bounded by the dimming edges C and E. The dotted lines outline the dimming edges extended into space connected through the Sun’s center. |
Figure 7 shows 20 generated CME cones at heights over a range of 0.27–2.23 Rsun, widths from 37.4–91.5°, and inclination angles from 18.7–45.7° (Cols. 1 and 3) and their orthogonal projections onto the solar sphere (Cols. 2 and 4), which are confined within the dimming edges in the sector of dominant dimming direction at the end of its impulsive phase for 1 October, 2011. Columns 1 and 3 are rotated by 90° for better visibility of the cone evolution such that the Y-axis points to the observer and the X- and Z-axes are along the horizontal and vertical directions. Columns 2 and 4 show the face-on view such that X-axis points to the observer, Y and Z-axes are along the horizontal and vertical directions respectively. As can be seen from Fig. 7, the cone projections cover the dimming; however, with an increase of height, the cone projections become narrower. The cone projections take the shape of an ellipse with the minor axis (connecting the source location and the dimming edge along the direction of dominant dimming evolution) being the same for all the cones. At the same time, the major axis of the ellipse is shrinking with increase of cone height, which makes the projection to approach a circular shape due to a smaller inclination angle (less deformation). Figure 8 illustrates the difference in projection geometry over the lowest height (0.27 Rsun, light green) to the largest height (2.82 Rsun, dark green). While the projections do not change along the direction of dominant dimming evolution (marked by magenta dots) by definition, the sides of projections are the narrowest for the largest height of 2.82 Rsun.
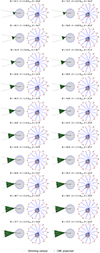 |
Fig. 7. CME cones at heights of 0.27–2.23 Rsun for 1 October, 2011 (Cols. 1 and 3) with associated widths and inclination angles and their orthogonal projections onto the solar sphere (Cols. 2 and 4) bounded by the dimming edges. Columns 1 and 3 depict the side view to better show the reconstructed cones, and Cols. 2 and 4 show the face-on view. |
 |
Fig. 8. Projections of cone at smallest height (0.27 Rsun, light green) and largest height (2.82 Rsun, dark green) together with the dimming mask (gray). The smaller the cone height, the wider the projection. Magenta dots indicate the source location and dimming edge along the direction of dominant dimming evolution. |
At the same time, as can be seen from Fig. 7, the intense shrinking of the cone projections happens at lower heights from around 0.27–1 Rsun, while at larger heights the changes are already insignificant. The dynamics of these changes can be quantified by subtracting the projection area of a cone with a smaller height (wider projection) from a projection area of a corresponding cone with a larger height (narrower projection), and the results are shown in Fig. 9 (red line, left Y-axis). We chose the cone with best fit to the dimming at the end of the most intense shrinking of projection areas, where the cone projections are still sensitive to the changes in cone parameters, which we estimate at 95% (vertical dashed line) of the red line peak. In the current case, this corresponds to the cone with a height of 1.04 Rsun, width of 48.7°, and inclination angle of 24.3°. Additionally, we required the majority of the dimming area to be inside the cone projection and derived the percentage of dimming area inside the cone projection (blue line, right Y-axis). We accepted the solution if it lay within 95% of the blue line peak. The chosen empirical thresholds will be validated in future statistical studies. We note that if we know just one of the CME parameters from other sources (height, width, or inclination angle), we will be able to immediately estimate the whole set of parameters and define the CME direction, as each cone in the given ensemble of cones confined by the dimming edges has a height that is uniquely associated with a certain width and inclination angle.
 |
Fig. 9. Consecutive differences in projection area of generated cone ensemble (red, left Y-axis) and ratio of dimming area in projection to the total area of projection (blue, right Y-axis) in percentage at the end of the impulsive phase of the 1 October, 2011 event. Vertical dashed line indicates the step (associated cone height of 1.04 Rsun, width of 48.7° and inclination angle of 24.3°) where consecutive differences reach 5% of the maximum of the cone projection area, which also lies within 95% of the maximum percentage of the dimming area in projection. |
Additionally, we projected the resulting CME direction onto the meridional and equatorial planes and derived the 2D angles between the projections in each plane. Figure 10 shows the central CME cone axis CP with a height of 1.04 Rsun, which provides the best fit to the dimming at the end of the impulsive phase for the 1 October, 2011 event. The red meridional plane passes through the Sun’s center O, the event source region C on the solar surface, and the North Pole. The green plane goes through the point C and is parallel to the Sun’s equatorial plane. The radial direction along line C’ lies by definition in the red meridional plane, and its projection in the equatorial plane is shown by the dashed orange line. The dashed blue line shows the projection of the cone central axis CP (i.e., the CME direction in 3D) to the meridional plane, and the magenta dashed line shows the corresponding projection to the equatorial plane. As can be seen from Fig. 10, the CME cone is deflected in the south-east direction.
 |
Fig. 10. Projection of CME direction onto the meridional (red) and equatorial (green) planes. The radial direction along the CC line lies in the red meridional plane by definition, and the dashed orange line shows its projection onto the equatorial plane. The dashed blue line gives the projection of the cone central axis CP (the CME direction in 3D) to the meridional plane, and the dashed magenta line to the equatorial plane. |
By convention, we take the angles in the north-south direction and in the west-east direction as positive-negative in the respective planes. We find that the 1 October, 2011 CME is inclined from the radial direction by 21° to the south (i.e., in the meridional plane) and 12° to the east (in the equatorial plane). This example demonstrates how the CME direction and its inclination from the radial propagation can be estimated early in its evolution using the information from coronal dimmings.
3. Results for the 6 September, 2011 event
In this section, we discuss how we applied our DIRECD approach presented in Sect. 2 to estimate the direction of the early CME propagation from the coronal dimming evolution to the 6 September, 2011 event. The authors of Prasad et al. (2020) analyzed this event in detail and reported that the X2.1 class flare occurred close to the disk center at N14° W18°, and this was associated with a fast halo CME speed of 990 km s−1. The impulsive phase of the flare started at 22:12 UT and reached its peak around 22:21 UT.
Figure 11 shows different phases of the dimming evolution within the first three hours after the start of the flare at 22:12 UTC. As can be seen, the dimming is mainly expanding toward the north-west in sectors 1 and 12. As for the 1 October, 2011 event, we focused our analysis on the dimming extent at the end of the impulsive phase (shown in panel c). The estimates of the dominant direction of dimming development are presented in Fig. 12. Panel a shows the resulting dimming area in each sector with the largest area in sector 12. Panel b gives the cumulative dimming pixel mask at the end of impulsive phase together with the source location and dimming edge in the sector of the dominant dimming direction (black dots).
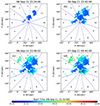 |
Fig. 11. Dimming evolution for 6 September, 2011 event (a) at the maximum of the impulsive phase (12 min from the start of the event), (b) 30 min from the start of the event, (c) at the end of the impulsive phase (44 min after the maximum of the impulsive phase), and (d) 2.5 h from the start. The blue lines show 12 angular sectors, and the color bar indicates when each dimming pixel was first detected. |
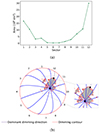 |
Fig. 12. Dominant direction of dimming development for the end of impulsive phase for the 6 September, 2011 event. The format is the same as for Fig. 5. The largest dimming area appears in sector 12, i.e., toward the north-west. |
Figure 13 shows twenty generated CME cones ranging over heights of 0.32–2.27 Rsun, widths of 43.2–91.7°, and inclination angles of 21.6–45.8° (Cols. 1 and 3) and their orthogonal projections onto the solar sphere (Cols. 2 and 4), which are confined within the dimming edges in the sector of dominant dimming direction. To find the best-fit cone, we evaluated Fig. 14, which shows the consecutive differences in projection area of generated cones (red, left Y-axis) and ratio of dimming area in projection to the total area of projection (blue, right Y-axis) in percentage for end of dimming impulsive phase. This is analogous to Fig. 7 for the 1 October, 2011 event. For this case, we find the best-fit parameters for the cone to be a height of 1.39 Rsun, width of 50.2°, and inclination angle of 25.1°.
 |
Fig. 14. Same as Fig. 9, but for 6 September, 2011. The best fit is obtained for the cone with a height of 1.39 Rsun, width of 50.2°, and inclination angle of 25.1°. |
In Fig. 15, we project the resulting CME direction onto meridional and equatorial planes. We find that the 6 September, 2011 CME is inclined 22° north (the meridional plane) and 15° west (the equatorial plane) of the radial direction.
4. Validation of DIRECD with 3D CME reconstructions
In this section, we describe how we validated the DIRECD method with the CME propagation direction derived from 3D reconstructions of the extended CME bubble for the 1 October, 2011 event using STEREO-A(head) and STEREO-B(ehind) EUV images low in the corona, where we assume that the CME is still connected to the dimming (Sect. 4.1). Additionally, we analyzed and compared the resulting 3D cone from the DIRECD method for the 6 September, 2011 event with GCS modeling using STEREO-A/STEREO-B COR 2 white-light images higher up in the corona (Sect. 4.2).
4.1. 3D reconstructions of extended CME loops in the EUV low corona
The Solar Terrestrial Relations Observatory (STEREO; Kaiser et al. 2008) allows us to perform stereoscopic imaging of the Sun and to compare the obtained stereoscopic CME data with the direction estimates that resulted from DIRECD based on the dimming observations. By taking advantage of the different viewpoint of the STEREO-A and STEREO-B spacecraft, we derived the 3D reconstructions of the extended CME bubble for the 1 October, 2011 event using the tie-pointing and triangulation techniques (Inhester 2006; Thompson 2009; Liewer et al. 2009). We identified identical features in images from the Extreme Ultraviolet Imagers (EUVI; Howard et al. 2008) onboard STEREO-A and STEREO-B and employed an algorithm of 3D reconstructions based on epipolar geometry, as described in detail in Podladchikova et al. (2019).
Figure 16 shows the expanding CME bubble at 10:05 UT as viewed with base-difference 195 Å EUVI images of STEREO-B (a) and STEREO-A (b). As we presume the CME is connected to the dimming at a certain height, we made stereoscopic estimates for the inner part of the CME bubble on the border between the end of the visible off-limb dimming and the bright CME outer edge and show the matching features on EUVI-B and EUVI-A with red dots. Additionally, we derived the stereoscopic reconstructions of the outer edge of the CME bubble, indicating its main propagation direction with the blue dot in both EUVI-B and EUVI-A images.
 |
Fig. 16. Three-dimensional reconstruction of extended CME bubbles. Red and blue dots show the inner and outer parts of the CME bubble matching the same features on both base-difference 195 Å EUVI-B (a) and EUVI-A (b) images. |
Figure 17a shows the resulting 3D reconstructions, where red and blue dots show the inner and outer parts of the CME bubble, with the height reaching 550 Mm. Cyan boundaries show the segmented dimming, and magenta dots indicate the source location and dimming edge along the direction of the dominant dimming evolution, through which we construct the edge black lines extended into 3D. As can be seen from Fig. 17a, the reconstructed inner part of the CME bubble (red points) and the outer edge (blue point) is located right above the dimming. Figure 17b shows the orthogonal projections of the reconstructed points of the CME bubble (red and blue dots) together with the segmented dimming (cyan) on top of a logarithmic base-ratio SDO/AIA 211 Å image. As can be seen from Fig. 17b, the projections are mainly concentrated in the center of the dimming, which justifies our inital assumption to link the 2D dimming with the 3D CME bubble. Projection points between the dimming edge and source region are probably related to the part of non-detected dimming areas covered by the solar flare at certain time steps during the evolution. As can also be seen from Fig. 17b, the projection points of the CME bubbles are mainly located not in the center of the dimming, but in its left (eastern) part, which is presumably explained by the reconstructing of the noncentral slice of the CME bubble.
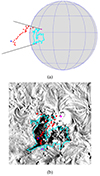 |
Fig. 17. Reconstructed CME bubble in 3D (panel a, red/blue dots) and its orthogonal projections onto the solar sphere (panel b, red/blue dots) together with the boundary of the identified dimming region (panels a and b, cyan). Red and blue dots show the inner and outer parts of the CME bubble, and magenta dots indicate the source location and dimming edge along the direction of dominant dimming evolution (panels a and b). Black lines in panel a have the same meaning as in Figs. 6 and 7. Panel b shows the logarithmic base-ratio SDO/AIA 211 Å image at 10:26 UT. |
The 3D reconstruction of the CME bubble allows us to perform forward modeling and a reconstruction of the CME cone and its orthogonal projections, assuming we know the main direction of CME propagation, which goes along the line connecting the source region and outer edge of the CME bubble (Fig. 18a). The half width of the cone (45°) in this case is determined by the angle between the line connecting the Sun’s center and the source location and the line connecting the Sun’s center to the assumed main direction of the CME propagation (which is represented by the reconstructed outer edge of the CME bubble indicated by the blue dot). The width is thus 90°. For comparison, in Fig. 18b, we show the CME best-fit cone resulting from our DIRECD method (see Sect. 2.3) and the 3D reconstructions of the CME bubble. As can be seen from Fig. 18c, the central axis of the cone reconstructed with DIRECD and the outer edge of CME bubble (blue point) are located close to each other, though there is some shift of the CME outer edge representing the non-central slice of the CME bubble. This is also seen in Fig. 18c, which shows the orthogonal projections of the CME cone from the forward modeling (blue dots) and that derived using DIRECD (green dots) together with the segmented dimming (cyan) plotted onto a logarithmic base-ratio SDO 211 Å image. We note that for the forward-modeled cone, the projections become wider with an increase in height in contrast to the cone reconstructed by DIRECD that becomes narrower with increase in height. While blue dots (orthogonal projections from the forward modeling) are shifted, green dots (orthogonal projections from the best-fit cone) are centered around the dimming. This is an additional argument of the reconstructed outer edge of the CME bubble to represent a part of non-central slice of CME bubble, which is in general going in the same direction as estimated with our approach.
 |
Fig. 18. Comparison of CME cones reconstructed from forward modeling and DIRECD. (a) Forward-modeled CME cone assuming we know the main direction of the CME propagation from the 3D reconstructions of the CME bubble. (b) Best-fit CME cone resulting from DIRECD method for 1 October, 2011. Red and blue dots in panels a and b show the reconstructed inner and outer parts of the CME bubble, and cyan boundaries indicate the segmented dimming together with the source location and dimming edge along the direction of dominant dimming evolution (magenta dots). Panel c shows the logarithmic base-ratio SDO/AIA 211 Å image together with the orthogonal projections of the CME cone from the forward modeling (blue dots) and that from our DIRECD method (green dots) together with the segmented dimming (cyan). |
4.2. 3D reconstructions of the white-light CME in the higher corona with GCS
To derive the 3D structure and direction of the CME bubble for the 6 September, 2011 event, we used GCS reconstructions available from the HELCAT Kincat catalog2 using STEREO-A/STEREO-B COR 2 white-light data. The parameters for the GCS reconstruction are as follows: heliocentric Longitude = 40°, heliocentric Latitude = 34°, tilt = 27°, aspect ratio r = 0.42, half-angle measured between the apex and the central axis of a leg of the croissant α/2 = 35.5°, and height of the croissant at the end of the dimming impulsive phase at 23:08 UT = 6 Rsun.
With the Python code provided in von Forstner (2021), we plotted the resulting GCS croissant (red mesh) together with the 3D cone (green) obtained with the DIRECD method shown in Fig. 19. The blue line indicates the central axis of the GCS reconstruction, while the black line is the central axis of the 3D cone from DIRECD. Points C and G mark the flare and GCS source, respectively. Since GCS assumes radial propagation of the CME from the GCS source and may also include uncertainties of the reconstruction, the GCS source G is shifted from the flare source C. We find that the angle between the vector from the Sun center to point G and that from the Sun center to point C is 28°, which allows us to roughly estimate the inclination from the radial direction (if the CME was propagating radially then point G should be close or coincide with point C). This result is close to the inclination angle obtained from the DIRECD method (25°) at the end of the dimming impulsive phase. Moreover, the angle between the GCS central axis (blue line) and the DIRECD cone central axis (black line) is 5.8°, indicating propagation in roughly the same direction.
 |
Fig. 19. Comparison of GCS and DIRECD method for 6 September, 2011 at the end of the dimming impulsive phase (23:08 UT). The red mesh shows the reconstructed GCS croissant, and the blue line is the central axis of GCS. The black line is the central axis of the cone obtained from DIRECD. Points C and G are the flare and GCS source, respectively. |
In addition, we note that Chikunova et al. (2023) studied the 28 October, 2021 event and reported a good alignment of the dimming contours with the inner part of the GCS croissant located between the two footpoints. This is because both flare and GCS sources were located nearby, indicating a radial (or close to radial) CME propagation direction. In our case, we find that the height of the DIRECD CME cone (1.39 Rsun) is close to the height of the inner part of GCS croissant (1.45 Rsun). As both the DIRECD CME cone and the GCS croissant are reconstructed at the same time at the end of the dimming impulsive phase (the CME bubble is already seen in coronagraphs at this time), this supports the argument that the CME propagation is connected to the dimming and only leaves footprints in the low corona up to a limited height. These resemblances imply that the best-fit cone from the DIRECD method can be used not only to link the 2D dimming with the 3D CME bubble to provide an estimate of the early CME direction, but also to provide further information for improving estimations of GCS parameters.
5. Discussion and conclusions
In this study, we developed a novel method called DIRECD to characterize the early CME propagation direction from the expansion of coronal dimmings. The method assumes a relationship between CMEs and dimmings in the low corona, and the proposed approach consists of the following main steps. First, to understand the overall 3D projection of CME cones, we simulated CMEs in 3D using a geometric cone model and demonstrated that the larger the CME height and width, the larger the area of CME orthogonal projection onto the solar surface, and its shape varies from circles to ellipses depending on the inclination angle from the radial direction and the source location. Second, we estimated the dominant direction of the dimming extent from the evolution of the dimming area. Third, using the derived dominant sector of the dimming evolution on the solar sphere, we solved an inverse problem to reconstruct an ensemble of CME cones at different heights, widths, and inclinations from the radial propagation. Finally, we chose the CME parameters for which the CME orthogonal projections onto the solar sphere best match the dimming geometry and main direction at the end of its impulsive phase and derived the CME geometry in 3D. We applied the proposed approach for two well-observed CME/dimming events of 1 October, 2011 and 6 September, 2011.
We find that for the 1 October, 2011 event the best fit of the CME projections to the dimming extent is a CME cone with height of 1.04 Rsun (a height at which the CME still remains connected to the dimming), CME width of 48.7°, and inclination angle of 24.3°. By projecting the obtained 3D direction onto the meridional and equatorial planes, we found that the CME was directed toward the south-east (21° south and 12° east), away from the radial direction. This outcome is in agreement with the study by Temmer et al. (2017), where the authors used GCS reconstruction from multi-viewpoint coronagraph observations of the CME and concluded that the associated two-step filament eruption and the CME propagated toward the south-east. They report a near-Earth ICME associated with the event that was detected on 5 October, 2011.
For the 6 September, 2011 event, we derived that the best fit of CME projections to the dimming extent results in a CME cone with height of 1.39 Rsun, width of 50.2°, and inclination angle of 25.1°. We find that the CME was inclined toward the north-west of the radial direction (22° north and 15° west). This outcome is in agreement with Kay & Gopalswamy (2017), who studied this event using 3D reconstructions from STEREO images and found a northward latitudinal deflection and a small westward longitudinal deflection. This event was also associated with an ICME that occured on 9 September, 2011.
We showed that the CME direction from the DIRECD method is in line with that derived from the 3D tie-pointing of the CME bubble observed in EUV low in the corona and from the GCS 3D modeling of the white-light CME higher up in the corona. Thus, our study presents a proof of concept that coronal dimmings can be used as a proxy of the early CME propagation direction. The main advantages of the DIRECD method are (a) that it can be used to give an early estimate of CME directions before they may even appear in the coronagraph field of view, (b) that it does not need multi-viewpoint observations or coronagraphs, and (c) that it is particularly useful for Earth-directed events that are difficult to assess from coronagraphs based on the Sun-Earth line, as they mostly observe the CME expansion but not its propagation. Moreover, this method may compensate for the lack of STEREO/COR1 observations, which would be helpful for the tracking of small CMEs in the early propagation in the lower corona.
On the other hand, the method has its own limitations. We note that this method is only suitable for CMEs that are initiated below 0.4 Rsun and for their propagation up to 3 Rsun above the surface, since no dimming footprint is detected higher up. These limitations come from the findings from Robbrecht et al. (2009), which found stealth CMEs to occur above 0.4 Rsun, and Dissauer et al. (2019), which found the initiation height of dimming-associated CMEs to be 0.16 ± 0.13 Rsun and the majority of the dimming evolution within 3 solar radii of the associated CME evolution. Thus, the method cannot account for any effects that may influence the CME direction further out and in interplanetary space, which is in contrast to the results of GCS reconstructions that can be applied up to distances of 15–20 Rsun. Further steps in estimating the CME direction from coronal dimmings need to include a larger statistical sample of CME events, which would allow us to investigate the accuracy and limitations of the method in detail and study how often the early CME direction/deflection estimates using the presented method reflect the CME’s behavior further out in the heliosphere.
Acknowledgments
S.J., T.P., and G.C. acknowledge support by the Russian Science Foundation under the project 23-22-00242, https://rscf.ru/en/project/23-22-00242/. The authors thank the International Space Science Institute (ISSI) Team on “Coronal Dimmings and Their Relevance to the Physics of Solar and Stellar Coronal Mass Ejections” for productive discussions, which helped to advance this study. SDO data are courtesy of NASA/SDO and the AIA, and HMI science teams. The STEREO/SECCHI data are produced by an international consortium of the Naval Research Laboratory (USA), Lockheed Martin Solar and Astrophysics Lab (USA), NASA Goddard Space Flight Center (USA), Rutherford Appleton Laboratory (UK), University of Birmingham (UK), Max-Planck- Institut für Sonnenforschung (Germany), Centre Spatiale de Liège (Belgium), Institut d’Optique Théorique et Appliquée (France), and Institut d’Astrophysique Spatiale (France). We thank the referee for valuable comments on this study.
References
- Aschwanden, M. J. 2017, ApJ, 847, 27 [NASA ADS] [CrossRef] [Google Scholar]
- Attrill, G., Nakwacki, M. S., Harra, L. K., et al. 2006, Sol. Phys., 238, 117 [Google Scholar]
- Baker, D. N., Li, X., Pulkkinen, A., et al. 2013, Space Weather, 11, 585 [NASA ADS] [CrossRef] [Google Scholar]
- Bewsher, D., Harrison, R. A., & Brown, D. S. 2008, A&A, 478, 897 [NASA ADS] [CrossRef] [EDP Sciences] [Google Scholar]
- Byrne, J. P., Maloney, S. A., McAteer, R. T. J., Refojo, J. M., & Gallagher, P. T. 2010, Nat. Commun., 1, 74 [NASA ADS] [CrossRef] [Google Scholar]
- Cheng, X., Zhang, J., Saar, S. H., & Ding, M. D. 2012, ApJ, 761, 62 [NASA ADS] [CrossRef] [Google Scholar]
- Chikunova, G., Dissauer, K., Podladchikova, T., & Veronig, A. M. 2020, ApJ, 896, 17 [NASA ADS] [CrossRef] [Google Scholar]
- Chikunova, G., Podladchikova, T., Dissauer, K., et al. 2023, A&A, 678, A166 [NASA ADS] [CrossRef] [EDP Sciences] [Google Scholar]
- Dissauer, K., Veronig, A. M., Temmer, M., Podladchikova, T., & Vanninathan, K. 2018a, ApJ, 855, 137 [NASA ADS] [CrossRef] [Google Scholar]
- Dissauer, K., Veronig, A. M., Temmer, M., Podladchikova, T., & Vanninathan, K. 2018b, ApJ, 863, 169 [NASA ADS] [CrossRef] [Google Scholar]
- Dissauer, K., Veronig, A. M., Temmer, M., & Podladchikova, T. 2019, ApJ, 874, 123 [NASA ADS] [CrossRef] [Google Scholar]
- Doherty, P., Coster, A. J., & Murtagh, W. 2004, GPS Solutions, 8, 267 [NASA ADS] [CrossRef] [Google Scholar]
- Gopalswamy, N., Mäkelä, P., Xie, H., Akiyama, S., & Yashiro, S. 2009a, J. Geophys. Res. Space Phys., 114, A3 [NASA ADS] [Google Scholar]
- Gopalswamy, N., Yashiro, S., Michalek, G., et al. 2009b, Earth Moon Planets, 104, 295 [NASA ADS] [CrossRef] [Google Scholar]
- Gui, B., Shen, C., Wang, Y., et al. 2011, Sol. Phys., 271, 111 [NASA ADS] [CrossRef] [Google Scholar]
- Harra, L. K., & Sterling, A. C. 2001, ApJ, 561, L215 [CrossRef] [Google Scholar]
- Harrison, R. A., & Lyons, M. 2000, A&A, 358, 1097 [NASA ADS] [Google Scholar]
- Harrison, R. A., Bryans, P., Simnett, G. M., & Lyons, M. 2003, A&A, 400, 1071 [NASA ADS] [CrossRef] [EDP Sciences] [Google Scholar]
- Heinemann, S. G., Temmer, M., Farrugia, C. J., et al. 2019, Sol. Phys., 294, 121 [NASA ADS] [CrossRef] [Google Scholar]
- Hildner, E. 1977, in COSPAR, 20th Plenary Meeting, 20, 19 [Google Scholar]
- Howard, R. A., Moses, J., Vourlidas, A., et al. 2008, Space Sci. Rev., 136, 67 [NASA ADS] [CrossRef] [Google Scholar]
- Hudson, H. S., Acton, L. W., & Freeland, S. L. 1996, ApJ, 470, 629 [CrossRef] [Google Scholar]
- Inhester, B. 2006, arXiv e-prints [arXiv:astro-ph/0612649] [Google Scholar]
- Isavnin, A., Vourlidas, A., & Kilpua, E. K. J. 2013, Sol. Phys., 284, 203 [NASA ADS] [CrossRef] [Google Scholar]
- Jin, M., Ding, M., Chen, P., Fang, C., & Imada, S. 2009, ApJ, 702, 27 [Google Scholar]
- Kaiser, M. L., Kucera, T. A., Davila, J. M., et al. 2008, Space. Sci. Rev., 136, 5 [Google Scholar]
- Kay, C., & Gopalswamy, N. 2017, J. Geophys. Res. Space Phys., 122, 11.810 [NASA ADS] [CrossRef] [Google Scholar]
- Kay, C., Opher, M., & Evans, R. M. 2013, ApJ, 775, 5 [NASA ADS] [CrossRef] [Google Scholar]
- Kay, C., Opher, M., & Evans, R. M. 2015, ApJ, 805, 168 [NASA ADS] [CrossRef] [Google Scholar]
- Kay, C., Opher, M., Colaninno, R. C., & Vourlidas, A. 2016, ApJ, 827, 70 [NASA ADS] [CrossRef] [Google Scholar]
- Kay, C., Gopalswamy, N., Xie, H., & Yashiro, S. 2017, Sol. Phys., 292, 78 [NASA ADS] [CrossRef] [Google Scholar]
- Kilpua, E. K. J., Pomoell, J., Vourlidas, A., et al. 2009, Ann. Geophys., 27, 4491 [NASA ADS] [CrossRef] [Google Scholar]
- Krista, L. D., & Reinard, A. A. 2017, ApJ, 839, 50 [NASA ADS] [CrossRef] [Google Scholar]
- Lemen, J. R., Title, A. M., Akin, D. J., et al. 2012, Sol. Phys., 275, 17 [Google Scholar]
- Liewer, P. C., de Jong, E. M., Hall, J. R., et al. 2009, Sol. Phys., 256, 57 [Google Scholar]
- Liewer, P., Panasenco, O., Vourlidas, A., & Colaninno, R. 2015, Sol. Phys., 290, 3343 [Google Scholar]
- Liu, Y., Thernisien, A., Luhmann, J. G., et al. 2010, ApJ, 722, 1762 [Google Scholar]
- López, F. M., Hebe Cremades, M., Nuevo, F. A., Balmaceda, L. A., & Vásquez, A. M. 2017, Sol. Phys., 292, 6 [CrossRef] [Google Scholar]
- Lugaz, N., Downs, C., Shibata, K., et al. 2011, ApJ, 738, 127 [NASA ADS] [CrossRef] [Google Scholar]
- Lugaz, N., Farrugia, C. J., Davies, J. A., et al. 2012, ApJ, 759, 68 [NASA ADS] [CrossRef] [Google Scholar]
- MacQueen, R. M., Hundhausen, A. J., & Conover, C. W. 1986, J. Geophys. Res., 91, 31 [NASA ADS] [CrossRef] [Google Scholar]
- Mason, J. P., Woods, T. N., Webb, D. F., et al. 2016, ApJ, 830, 20 [NASA ADS] [CrossRef] [Google Scholar]
- Mason, J. P., Chamberlin, P. C., Seaton, D., et al. 2021, J. Space Weather Space Clim., 11, 20 [NASA ADS] [CrossRef] [EDP Sciences] [Google Scholar]
- Mays, M. L., Taktakishvili, A., Pulkkinen, A., et al. 2015, Sol. Phys., 290, 1775 [CrossRef] [Google Scholar]
- Michalek, G., Gopalswamy, N., & Yashiro, S. 2009, Sol. Phys., 260, 401 [NASA ADS] [CrossRef] [Google Scholar]
- Mierla, M., Inhester, B., Antunes, A., et al. 2010, Ann. Geophys., 28, 203 [NASA ADS] [CrossRef] [Google Scholar]
- Miklenic, C., Veronig, A. M., Temmer, M., Möstl, C., & Biernat, H. K. 2011, Sol. Phys., 273, 125 [NASA ADS] [CrossRef] [Google Scholar]
- Möstl, C., Rollett, T., Frahm, R. A., et al. 2015, Nat. Commun., 6, 7135 [CrossRef] [Google Scholar]
- Muhr, N., Veronig, A. M., Kienreich, I. W., Temmer, M., & Vršnak, B. 2011, ApJ, 739, 89 [Google Scholar]
- Pesnell, W. D., Thompson, B. J., & Chamberlin, P. C. 2012, Sol. Phys., 275, 3 [Google Scholar]
- Podladchikova, T., Veronig, A. M., Dissauer, K., Temmer, M., & Podladchikova, O. 2019, ApJ, 877, 68 [NASA ADS] [CrossRef] [Google Scholar]
- Prasad, A., Dissauer, K., Hu, Q., et al. 2020, ApJ, 903, 129 [Google Scholar]
- Qiu, J., & Cheng, J. 2017, ApJ, 838, L6 [NASA ADS] [CrossRef] [Google Scholar]
- Reinard, A. A., & Biesecker, D. A. 2009, ApJ, 705, 914 [Google Scholar]
- Robbrecht, E., Patsourakos, S., & Vourlidas, A. 2009, ApJ, 701, 283 [Google Scholar]
- Rodríguez Gómez, J. M., Podladchikova, T., Veronig, A., et al. 2020, ApJ, 899, 47 [CrossRef] [Google Scholar]
- Sahade, A., Cécere, M., & Krause, G. 2020, ApJ, 896, 53 [NASA ADS] [CrossRef] [Google Scholar]
- Sandford, W. H. 1999, J. Navigation, 52, 42 [NASA ADS] [CrossRef] [Google Scholar]
- Schwenn, R., dal Lago, A., Huttunen, E., & Gonzalez, W. D. 2005, Ann. Geophys., 23, 1033 [Google Scholar]
- Shen, C., Wang, Y., Gui, B., Ye, P., & Wang, S. 2011, Sol. Phys., 269, 389 [NASA ADS] [CrossRef] [Google Scholar]
- Sterling, A. C., & Hudson, H. S. 1997, ApJ, 491, L55 [Google Scholar]
- Temmer, M., Thalmann, J. K., Dissauer, K., et al. 2017, Sol. Phys., 292, 93 [NASA ADS] [CrossRef] [Google Scholar]
- Thernisien, A. 2011, ApJS, 194, 33 [Google Scholar]
- Thernisien, A. F. R., Howard, R. A., & Vourlidas, A. 2006, ApJ, 652, 763 [Google Scholar]
- Thompson, W. T. 2009, Icarus, 200, 351 [Google Scholar]
- Thompson, B. J., Plunkett, S. P., Gurman, J. B., et al. 1998, Geophys. Res. Lett., 25, 2465 [Google Scholar]
- Thompson, B. J., Cliver, E. W., Nitta, N., Delannée, C., & Delaboudinière, J. P. 2000, Geophys. Res. Lett., 27, 1431 [Google Scholar]
- Tian, H., McIntosh, S. W., Xia, L., He, J., & Wang, X. 2012, ApJ, 748, 106 [NASA ADS] [CrossRef] [Google Scholar]
- Tsurutani, B. T., & Lakhina, G. S. 2014, Geophys. Res. Lett., 41, 287 [NASA ADS] [CrossRef] [Google Scholar]
- Vanninathan, K., Veronig, A. M., Dissauer, K., & Temmer, M. 2018, ApJ, 857, 62 [NASA ADS] [CrossRef] [Google Scholar]
- Veronig, A. M., Podladchikova, T., Dissauer, K., et al. 2018, ApJ, 868, 107 [NASA ADS] [CrossRef] [Google Scholar]
- Veronig, A. M., Gömöry, P., Dissauer, K., Temmer, M., & Vanninathan, K. 2019, ApJ, 879, 85 [NASA ADS] [CrossRef] [Google Scholar]
- von Forstner, J. L. F. 2021, https://doi.org/10.5281/zenodo.5084818 [Google Scholar]
- Vršnak, B., Žic, T., Lulić, S., Temmer, M., & Veronig, A. M. 2016, Sol. Phys., 291, 89 [Google Scholar]
- Wang, R., Liu, Y. D., Dai, X., et al. 2015, ApJ, 814, 80 [NASA ADS] [CrossRef] [Google Scholar]
- Wang, R., Liu, Y. D., Zhao, X., & Hu, H. 2023, ApJ, 952, L29 [NASA ADS] [CrossRef] [Google Scholar]
- Xie, H., Ofman, L., & Lawrence, G. 2004, J. Geophys. Res. Space Phys., 109, A03109 [NASA ADS] [Google Scholar]
- Zhao, X. P., Plunkett, S. P., & Liu, W. 2002, J. Geophys. Res. Space Phys., 107, 1223 [NASA ADS] [CrossRef] [Google Scholar]
- Zhukov, A. N., & Auchère, F. 2004, A&A, 427, 705 [NASA ADS] [CrossRef] [EDP Sciences] [Google Scholar]
- Zuccarello, F. P., Bemporad, A., Jacobs, C., et al. 2012, ApJ, 744, 66 [NASA ADS] [CrossRef] [Google Scholar]
Appendix A: Simulations with a CME cone model for different source region locations
All Figures
 |
Fig. 1. CME cone model. Panel a shows the cone in the radial direction with an angular width of ϕ = 28°, while panel b represents the same cone inclined from the radial direction by an angle of β = 25.52°. Point C is the source region on the solar sphere, P is the top point of the cone central axis, O is the center of the Sun, and F is the orthogonal projection of the point P onto the solar sphere. |
| In the text | |
 |
Fig. 2. Simulation of CME cone and its orthogonal projection in quadrant 3 (near center). From left to right: CME cone with 30° of angular width (Col. 1) and its orthogonal projection (Col. 2) on the solar sphere; the CME cone with 15° of angular width (Col. 3) and its orthogonal projection (Col. 4). From top to bottom: first row shows the radial direction; second and third rows show the case of ±30° from inclination from the X-axis direction in the YZ plane; fourth and fifth rows show ±30° inclination from the Y-axis direction; sixth and seventh rows show ±30° inclination from the Z-axis direction. The orthogonal projections at 0.2Rsun, 0.5Rsun, and 1Rsun are shown by cyan, green, and red markers. The gray markers show the projections of intermediate heights from 0.1–1Rsun. |
| In the text | |
 |
Fig. 3. Expansion of dimming area At (top panel) and its time derivative dA/dt (bottom panel) over 3 h for the 1 October, 2011 event. The end of the impulsive phase is defined as the time when the derivative of the dimming area curve, dA/dt, has declined back to 15% of its maximum value. |
| In the text | |
 |
Fig. 4. Dimming evolution for 1 October, 2011 CME at (a) the maximum of the impulsive phase (reached 12 min after its start); (b) 18 min after the start of event; (c) at the end of the impulsive phase (30 min after the maximum of the impulsive phase); and (d) 2.5 h after the start. The blue lines indicate 12 angular sectors and the color bar shows when each dimming pixel was detected for the first time. |
| In the text | |
 |
Fig. 5. Dominant direction of dimming expansion at the end of impulsive phase for 1 October, 2011. Top: Dimming area in different sectors (shown in the bottom panels), showing its maximum at sector 6. Bottom: Cumulative dimming pixel mask outlined by gray with red contours. The blue lines indicate the 12 sectors. The dashed purple line indicates the sector of dominant dimming development. The black dots show the dimming edges (one of them being the source) in the sector of dominant dimming which are used to generate the CME cones at different heights, associated widths and inclination angles. |
| In the text | |
 |
Fig. 6. Ensemble of cones of different heights, widths, and inclination angles bounded by the dimming edges C and E. The dotted lines outline the dimming edges extended into space connected through the Sun’s center. |
| In the text | |
 |
Fig. 7. CME cones at heights of 0.27–2.23 Rsun for 1 October, 2011 (Cols. 1 and 3) with associated widths and inclination angles and their orthogonal projections onto the solar sphere (Cols. 2 and 4) bounded by the dimming edges. Columns 1 and 3 depict the side view to better show the reconstructed cones, and Cols. 2 and 4 show the face-on view. |
| In the text | |
 |
Fig. 8. Projections of cone at smallest height (0.27 Rsun, light green) and largest height (2.82 Rsun, dark green) together with the dimming mask (gray). The smaller the cone height, the wider the projection. Magenta dots indicate the source location and dimming edge along the direction of dominant dimming evolution. |
| In the text | |
 |
Fig. 9. Consecutive differences in projection area of generated cone ensemble (red, left Y-axis) and ratio of dimming area in projection to the total area of projection (blue, right Y-axis) in percentage at the end of the impulsive phase of the 1 October, 2011 event. Vertical dashed line indicates the step (associated cone height of 1.04 Rsun, width of 48.7° and inclination angle of 24.3°) where consecutive differences reach 5% of the maximum of the cone projection area, which also lies within 95% of the maximum percentage of the dimming area in projection. |
| In the text | |
 |
Fig. 10. Projection of CME direction onto the meridional (red) and equatorial (green) planes. The radial direction along the CC line lies in the red meridional plane by definition, and the dashed orange line shows its projection onto the equatorial plane. The dashed blue line gives the projection of the cone central axis CP (the CME direction in 3D) to the meridional plane, and the dashed magenta line to the equatorial plane. |
| In the text | |
 |
Fig. 11. Dimming evolution for 6 September, 2011 event (a) at the maximum of the impulsive phase (12 min from the start of the event), (b) 30 min from the start of the event, (c) at the end of the impulsive phase (44 min after the maximum of the impulsive phase), and (d) 2.5 h from the start. The blue lines show 12 angular sectors, and the color bar indicates when each dimming pixel was first detected. |
| In the text | |
 |
Fig. 12. Dominant direction of dimming development for the end of impulsive phase for the 6 September, 2011 event. The format is the same as for Fig. 5. The largest dimming area appears in sector 12, i.e., toward the north-west. |
| In the text | |
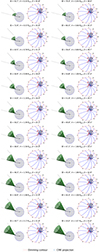 |
Fig. 13. Same as Fig. 7, but for 6 September, 2011 at the end of the impulsive phase of the dimming. |
| In the text | |
 |
Fig. 14. Same as Fig. 9, but for 6 September, 2011. The best fit is obtained for the cone with a height of 1.39 Rsun, width of 50.2°, and inclination angle of 25.1°. |
| In the text | |
 |
Fig. 15. Same as Fig. 10, but for the 6 September, 2011 event. |
| In the text | |
 |
Fig. 16. Three-dimensional reconstruction of extended CME bubbles. Red and blue dots show the inner and outer parts of the CME bubble matching the same features on both base-difference 195 Å EUVI-B (a) and EUVI-A (b) images. |
| In the text | |
 |
Fig. 17. Reconstructed CME bubble in 3D (panel a, red/blue dots) and its orthogonal projections onto the solar sphere (panel b, red/blue dots) together with the boundary of the identified dimming region (panels a and b, cyan). Red and blue dots show the inner and outer parts of the CME bubble, and magenta dots indicate the source location and dimming edge along the direction of dominant dimming evolution (panels a and b). Black lines in panel a have the same meaning as in Figs. 6 and 7. Panel b shows the logarithmic base-ratio SDO/AIA 211 Å image at 10:26 UT. |
| In the text | |
 |
Fig. 18. Comparison of CME cones reconstructed from forward modeling and DIRECD. (a) Forward-modeled CME cone assuming we know the main direction of the CME propagation from the 3D reconstructions of the CME bubble. (b) Best-fit CME cone resulting from DIRECD method for 1 October, 2011. Red and blue dots in panels a and b show the reconstructed inner and outer parts of the CME bubble, and cyan boundaries indicate the segmented dimming together with the source location and dimming edge along the direction of dominant dimming evolution (magenta dots). Panel c shows the logarithmic base-ratio SDO/AIA 211 Å image together with the orthogonal projections of the CME cone from the forward modeling (blue dots) and that from our DIRECD method (green dots) together with the segmented dimming (cyan). |
| In the text | |
 |
Fig. 19. Comparison of GCS and DIRECD method for 6 September, 2011 at the end of the dimming impulsive phase (23:08 UT). The red mesh shows the reconstructed GCS croissant, and the blue line is the central axis of GCS. The black line is the central axis of the cone obtained from DIRECD. Points C and G are the flare and GCS source, respectively. |
| In the text | |
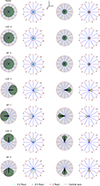 |
Fig. A.1. Same as Figure A.3, but for the source region in the Sun center. |
| In the text | |
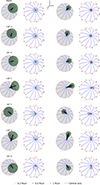 |
Fig. A.2. Same as Figure 2, but for quadrant 1 (near center). |
| In the text | |
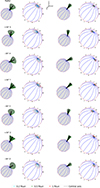 |
Fig. A.3. Same as Figure 2, but for quadrant 1 (near limb). |
| In the text | |
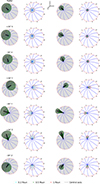 |
Fig. A.4. Same as Figure 2, but for quadrant 2 (near center). |
| In the text | |
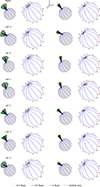 |
Fig. A.5. Same as Figure 2, but for quadrant 2 (near limb). |
| In the text | |
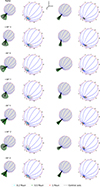 |
Fig. A.6. Same as Figure 2, but for quadrant 3 (near limb). |
| In the text | |
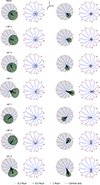 |
Fig. A.7. Same as Figure 2, but for quadrant 4 (near center). |
| In the text | |
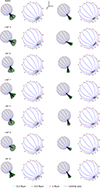 |
Fig. A.8. Same as Figure 2, but for quadrant 4 (near limb). |
| In the text | |
Current usage metrics show cumulative count of Article Views (full-text article views including HTML views, PDF and ePub downloads, according to the available data) and Abstracts Views on Vision4Press platform.
Data correspond to usage on the plateform after 2015. The current usage metrics is available 48-96 hours after online publication and is updated daily on week days.
Initial download of the metrics may take a while.


