Fig. 18.
Download original image
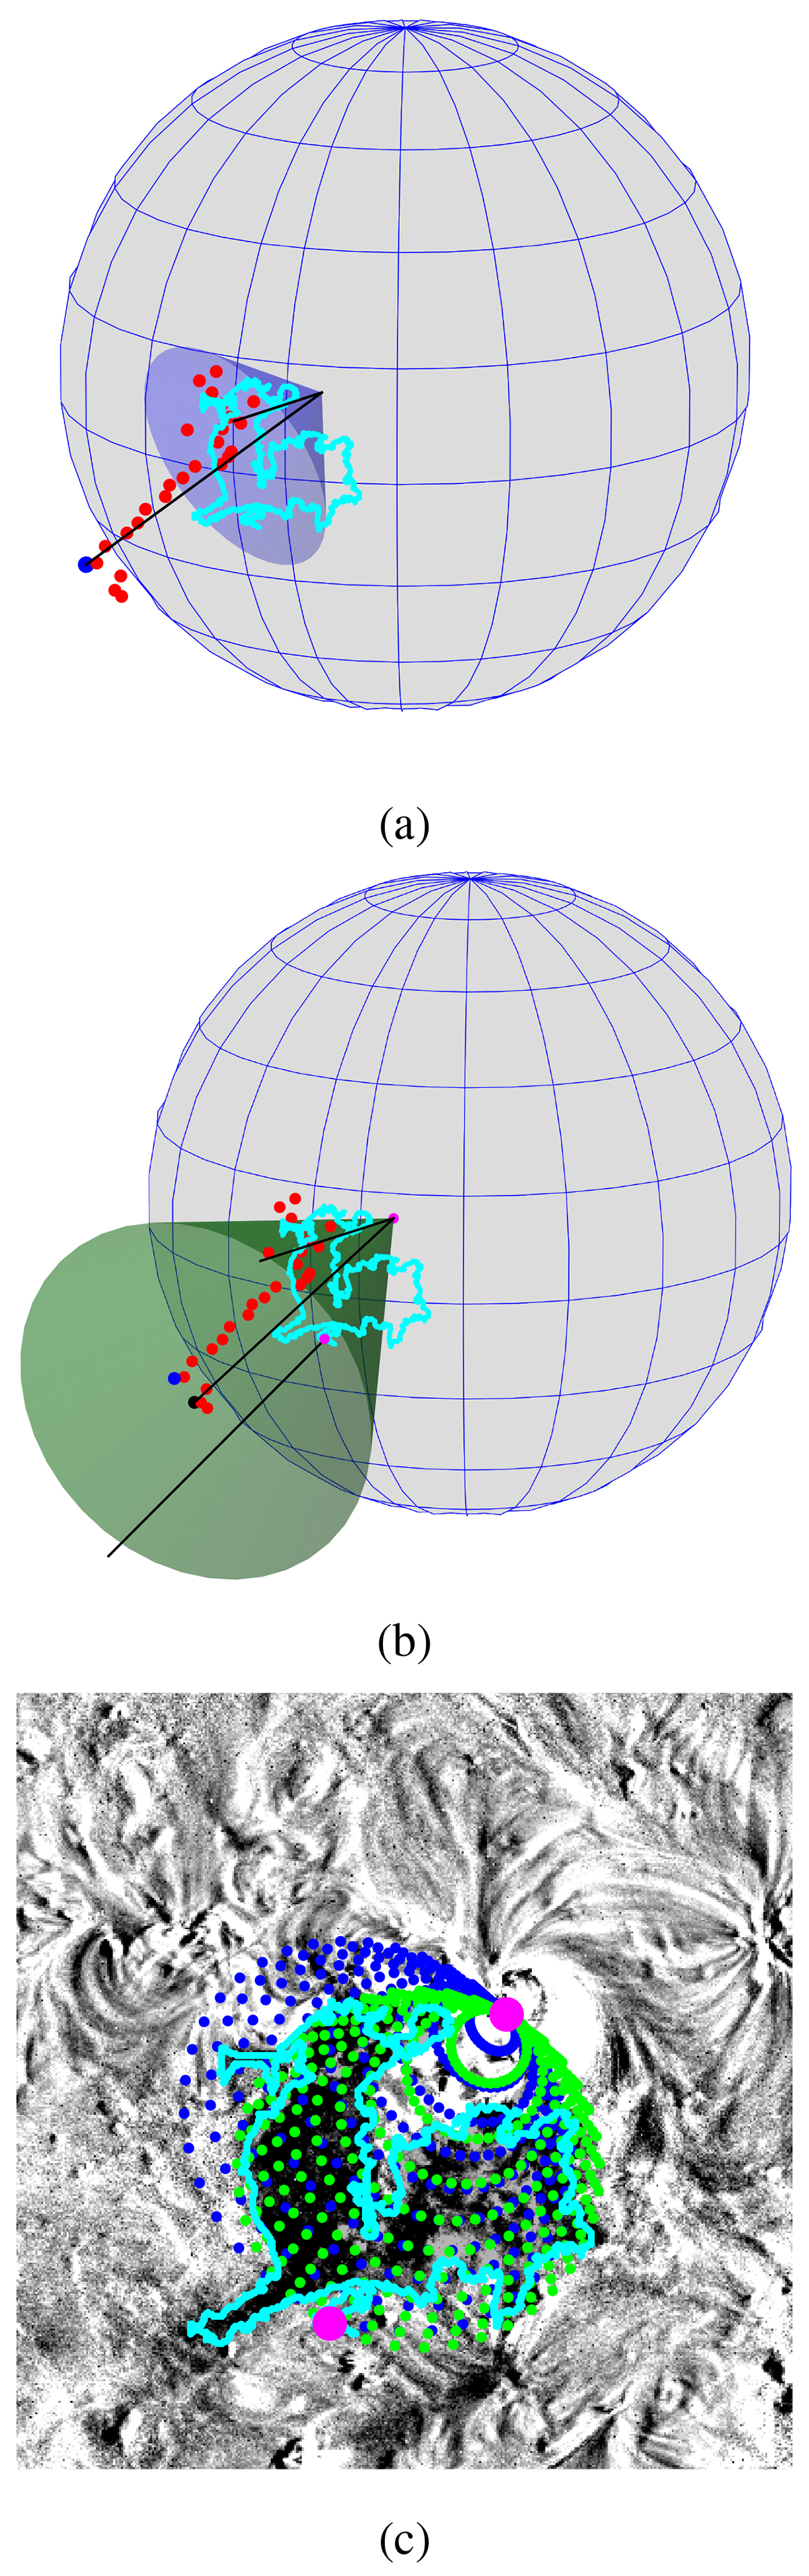
Comparison of CME cones reconstructed from forward modeling and DIRECD. (a) Forward-modeled CME cone assuming we know the main direction of the CME propagation from the 3D reconstructions of the CME bubble. (b) Best-fit CME cone resulting from DIRECD method for 1 October, 2011. Red and blue dots in panels a and b show the reconstructed inner and outer parts of the CME bubble, and cyan boundaries indicate the segmented dimming together with the source location and dimming edge along the direction of dominant dimming evolution (magenta dots). Panel c shows the logarithmic base-ratio SDO/AIA 211 Å image together with the orthogonal projections of the CME cone from the forward modeling (blue dots) and that from our DIRECD method (green dots) together with the segmented dimming (cyan).
Current usage metrics show cumulative count of Article Views (full-text article views including HTML views, PDF and ePub downloads, according to the available data) and Abstracts Views on Vision4Press platform.
Data correspond to usage on the plateform after 2015. The current usage metrics is available 48-96 hours after online publication and is updated daily on week days.
Initial download of the metrics may take a while.