Fig. 19.
Download original image
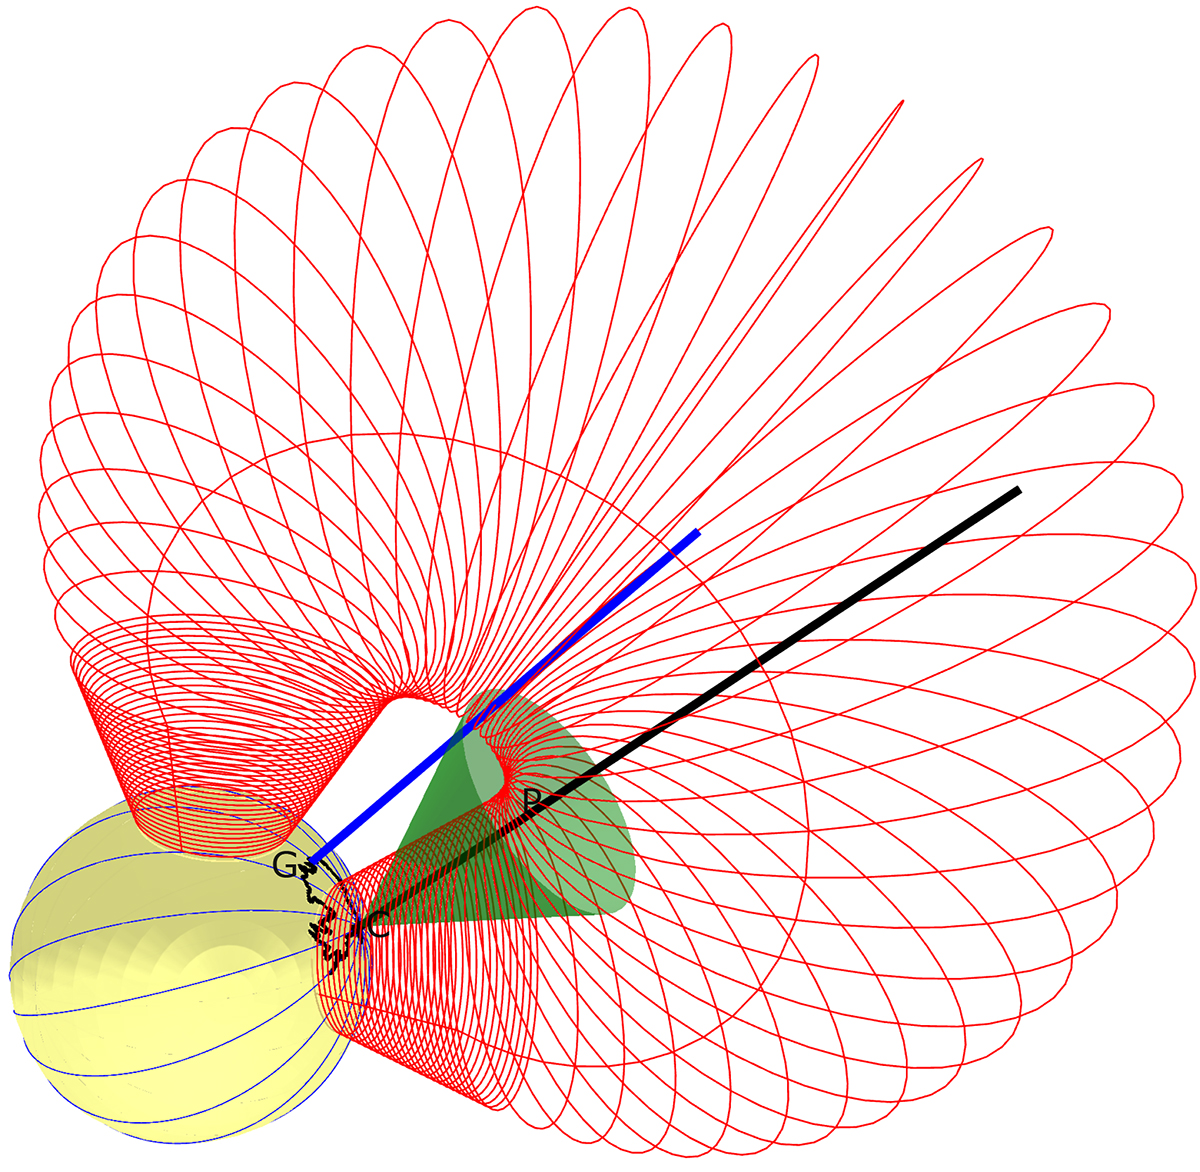
Comparison of GCS and DIRECD method for 6 September, 2011 at the end of the dimming impulsive phase (23:08 UT). The red mesh shows the reconstructed GCS croissant, and the blue line is the central axis of GCS. The black line is the central axis of the cone obtained from DIRECD. Points C and G are the flare and GCS source, respectively.
Current usage metrics show cumulative count of Article Views (full-text article views including HTML views, PDF and ePub downloads, according to the available data) and Abstracts Views on Vision4Press platform.
Data correspond to usage on the plateform after 2015. The current usage metrics is available 48-96 hours after online publication and is updated daily on week days.
Initial download of the metrics may take a while.