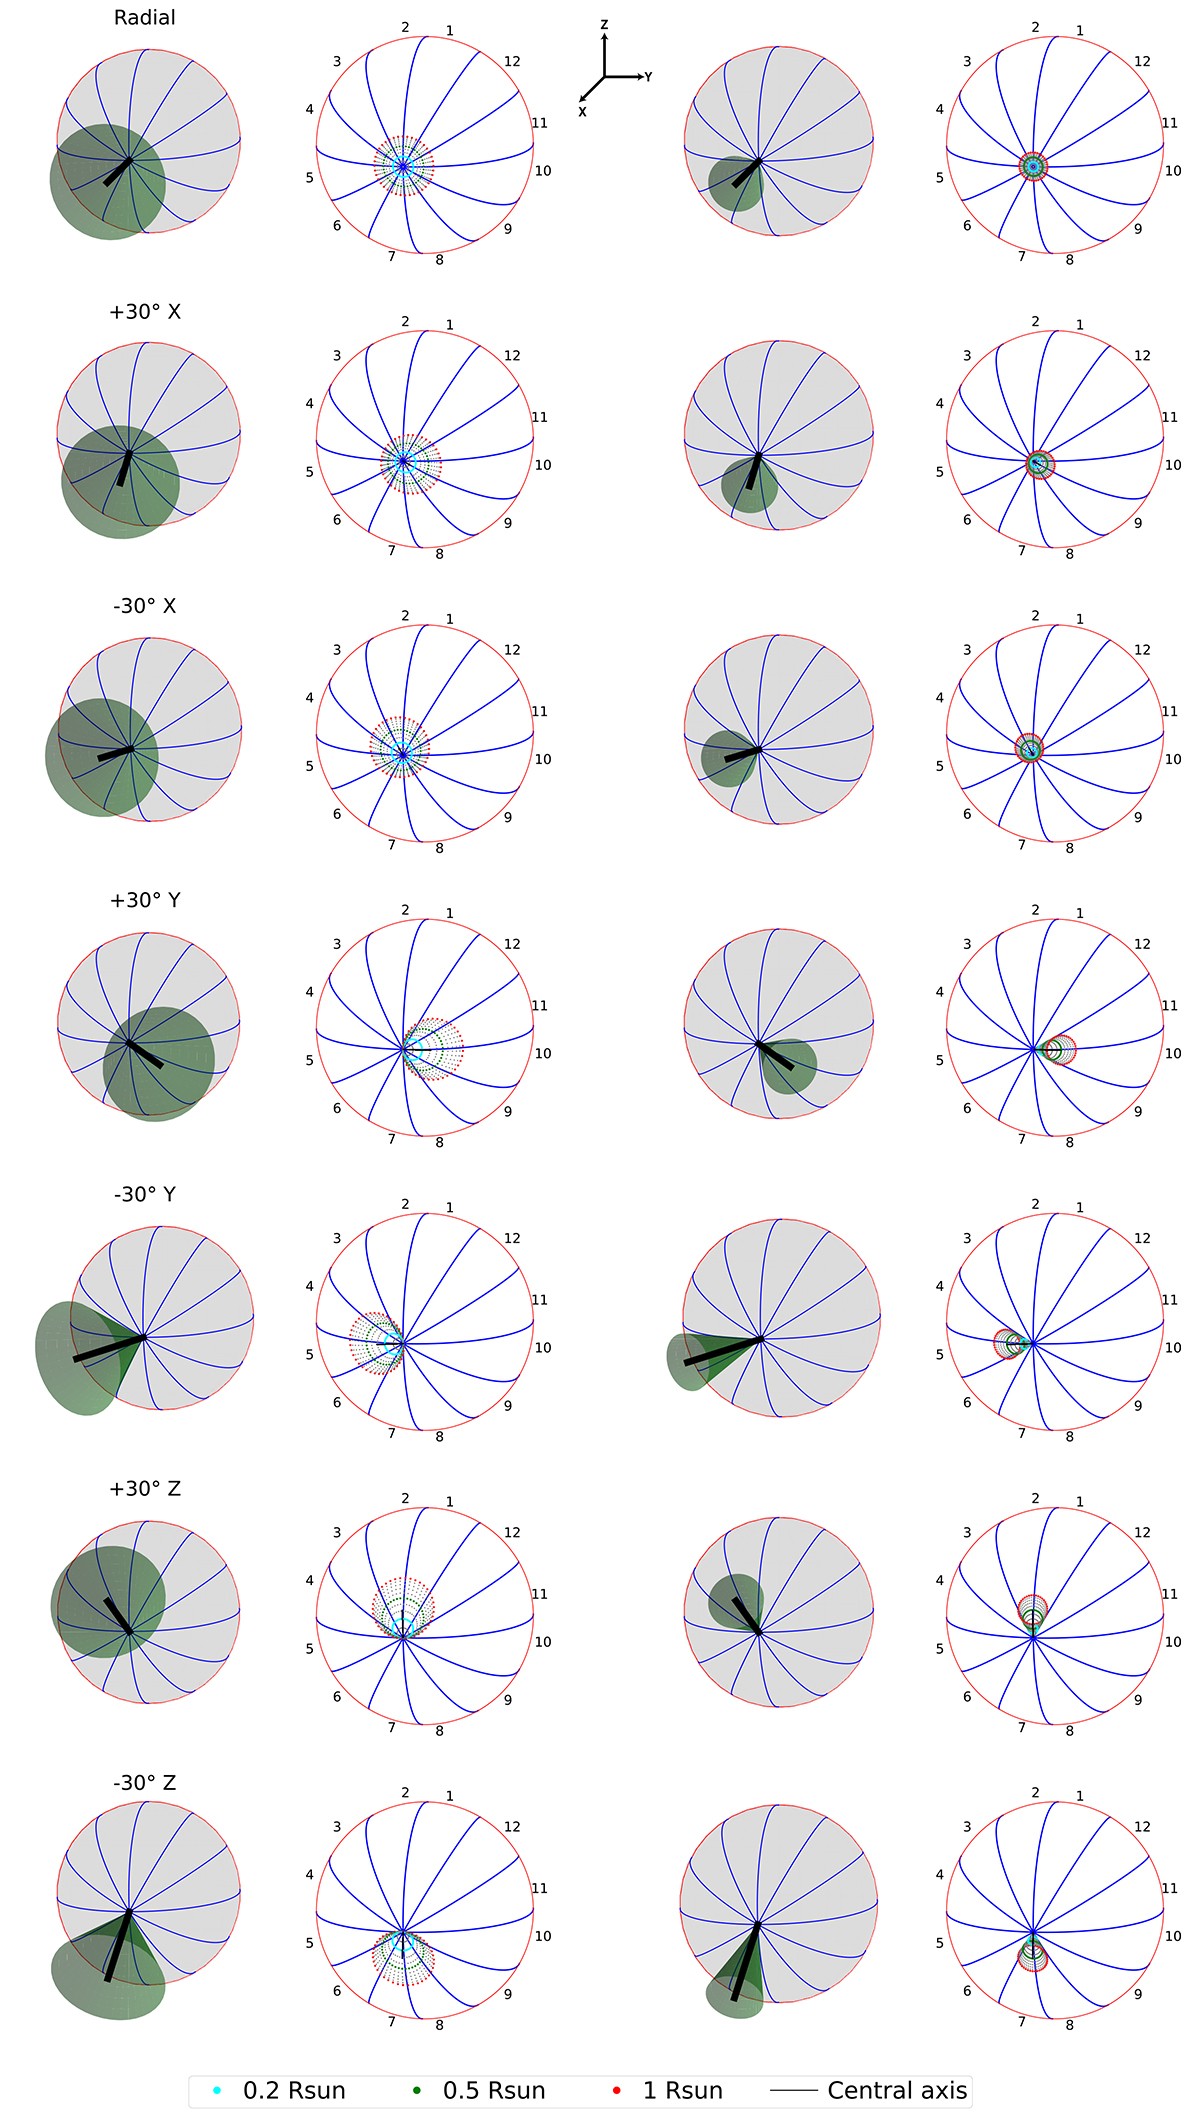
Fig. 2.
Download original image
Simulation of CME cone and its orthogonal projection in quadrant 3 (near center). From left to right: CME cone with 30° of angular width (Col. 1) and its orthogonal projection (Col. 2) on the solar sphere; the CME cone with 15° of angular width (Col. 3) and its orthogonal projection (Col. 4). From top to bottom: first row shows the radial direction; second and third rows show the case of ±30° from inclination from the X-axis direction in the YZ plane; fourth and fifth rows show ±30° inclination from the Y-axis direction; sixth and seventh rows show ±30° inclination from the Z-axis direction. The orthogonal projections at 0.2Rsun, 0.5Rsun, and 1Rsun are shown by cyan, green, and red markers. The gray markers show the projections of intermediate heights from 0.1–1Rsun.
Current usage metrics show cumulative count of Article Views (full-text article views including HTML views, PDF and ePub downloads, according to the available data) and Abstracts Views on Vision4Press platform.
Data correspond to usage on the plateform after 2015. The current usage metrics is available 48-96 hours after online publication and is updated daily on week days.
Initial download of the metrics may take a while.