Fig. 17.
Download original image
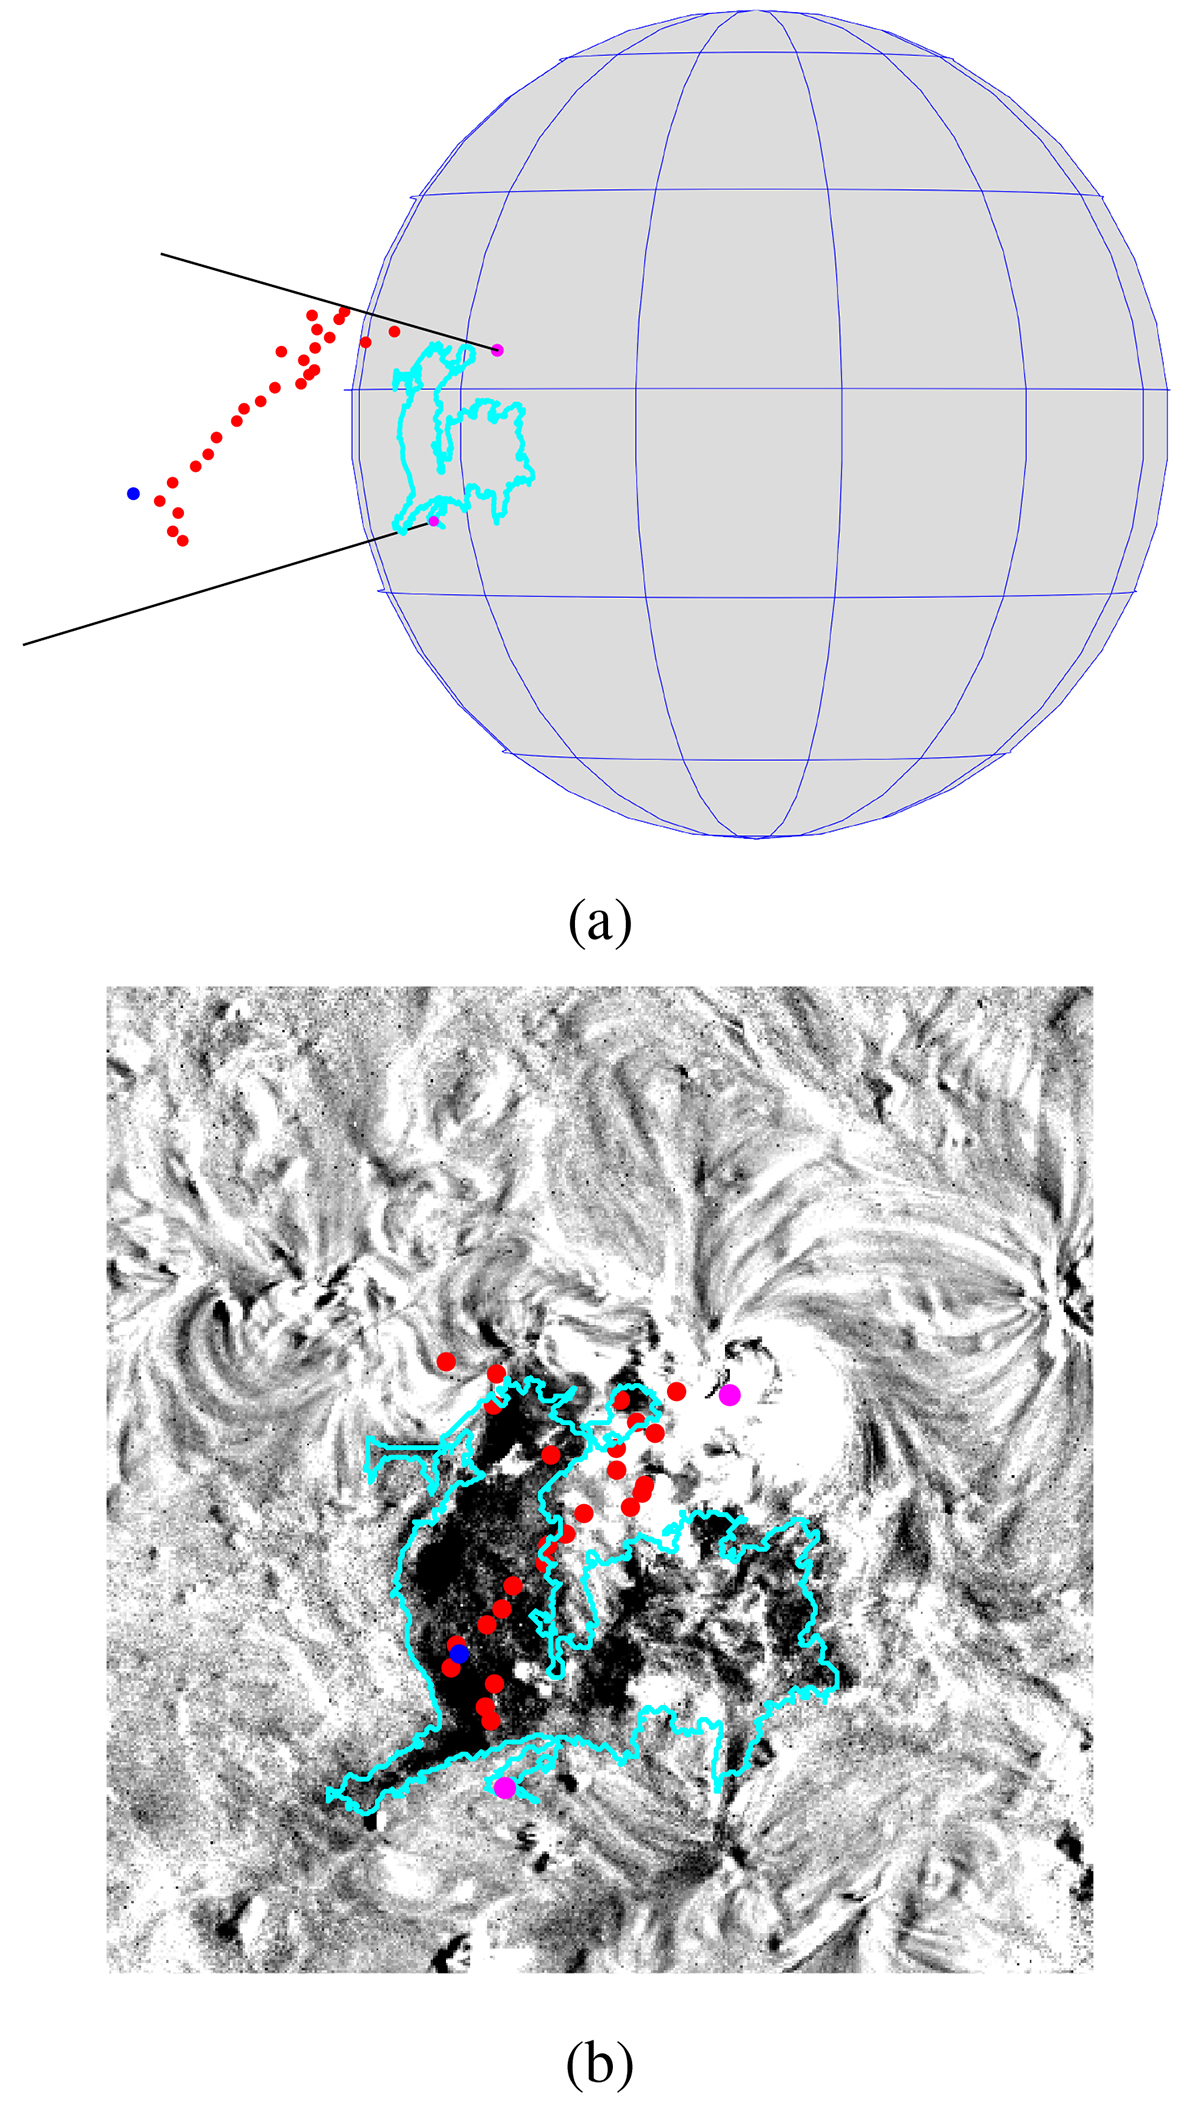
Reconstructed CME bubble in 3D (panel a, red/blue dots) and its orthogonal projections onto the solar sphere (panel b, red/blue dots) together with the boundary of the identified dimming region (panels a and b, cyan). Red and blue dots show the inner and outer parts of the CME bubble, and magenta dots indicate the source location and dimming edge along the direction of dominant dimming evolution (panels a and b). Black lines in panel a have the same meaning as in Figs. 6 and 7. Panel b shows the logarithmic base-ratio SDO/AIA 211 Å image at 10:26 UT.
Current usage metrics show cumulative count of Article Views (full-text article views including HTML views, PDF and ePub downloads, according to the available data) and Abstracts Views on Vision4Press platform.
Data correspond to usage on the plateform after 2015. The current usage metrics is available 48-96 hours after online publication and is updated daily on week days.
Initial download of the metrics may take a while.