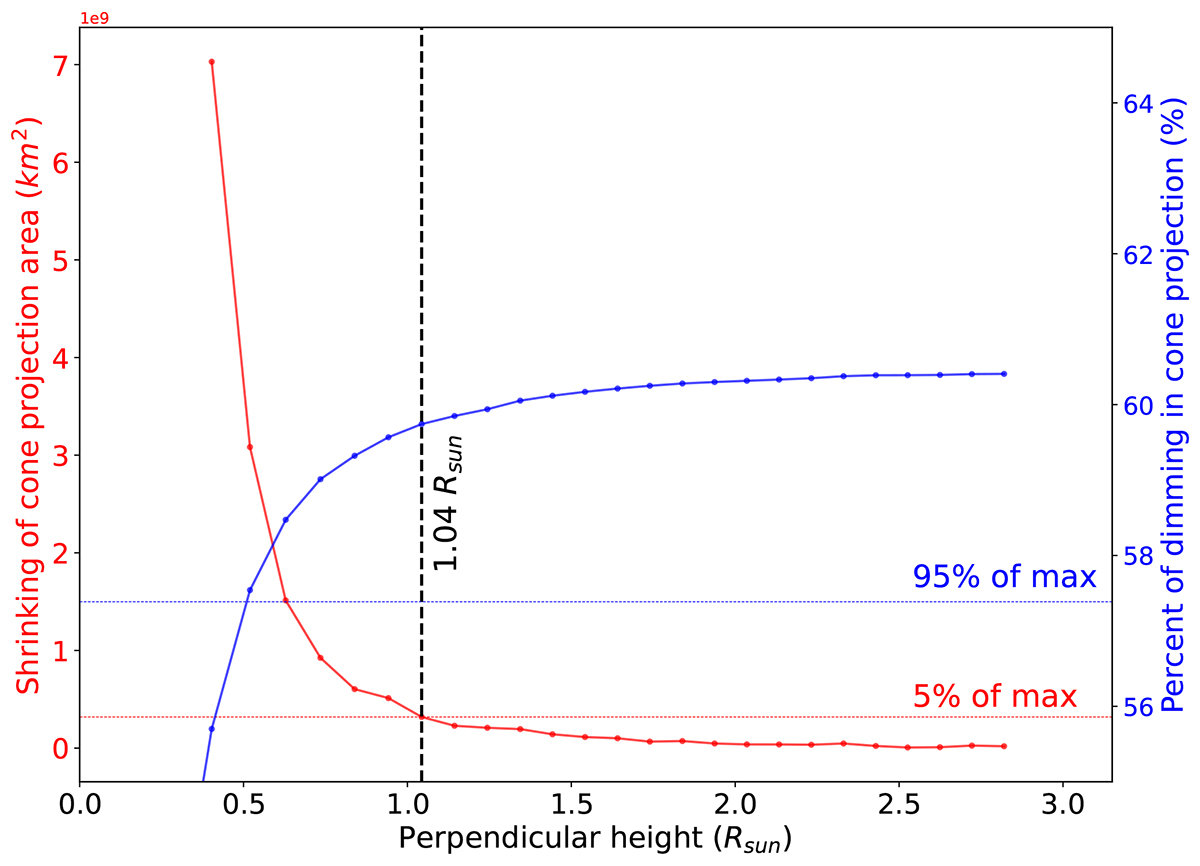
Fig. 9.
Download original image
Consecutive differences in projection area of generated cone ensemble (red, left Y-axis) and ratio of dimming area in projection to the total area of projection (blue, right Y-axis) in percentage at the end of the impulsive phase of the 1 October, 2011 event. Vertical dashed line indicates the step (associated cone height of 1.04 Rsun, width of 48.7° and inclination angle of 24.3°) where consecutive differences reach 5% of the maximum of the cone projection area, which also lies within 95% of the maximum percentage of the dimming area in projection.
Current usage metrics show cumulative count of Article Views (full-text article views including HTML views, PDF and ePub downloads, according to the available data) and Abstracts Views on Vision4Press platform.
Data correspond to usage on the plateform after 2015. The current usage metrics is available 48-96 hours after online publication and is updated daily on week days.
Initial download of the metrics may take a while.