Fig. 4.
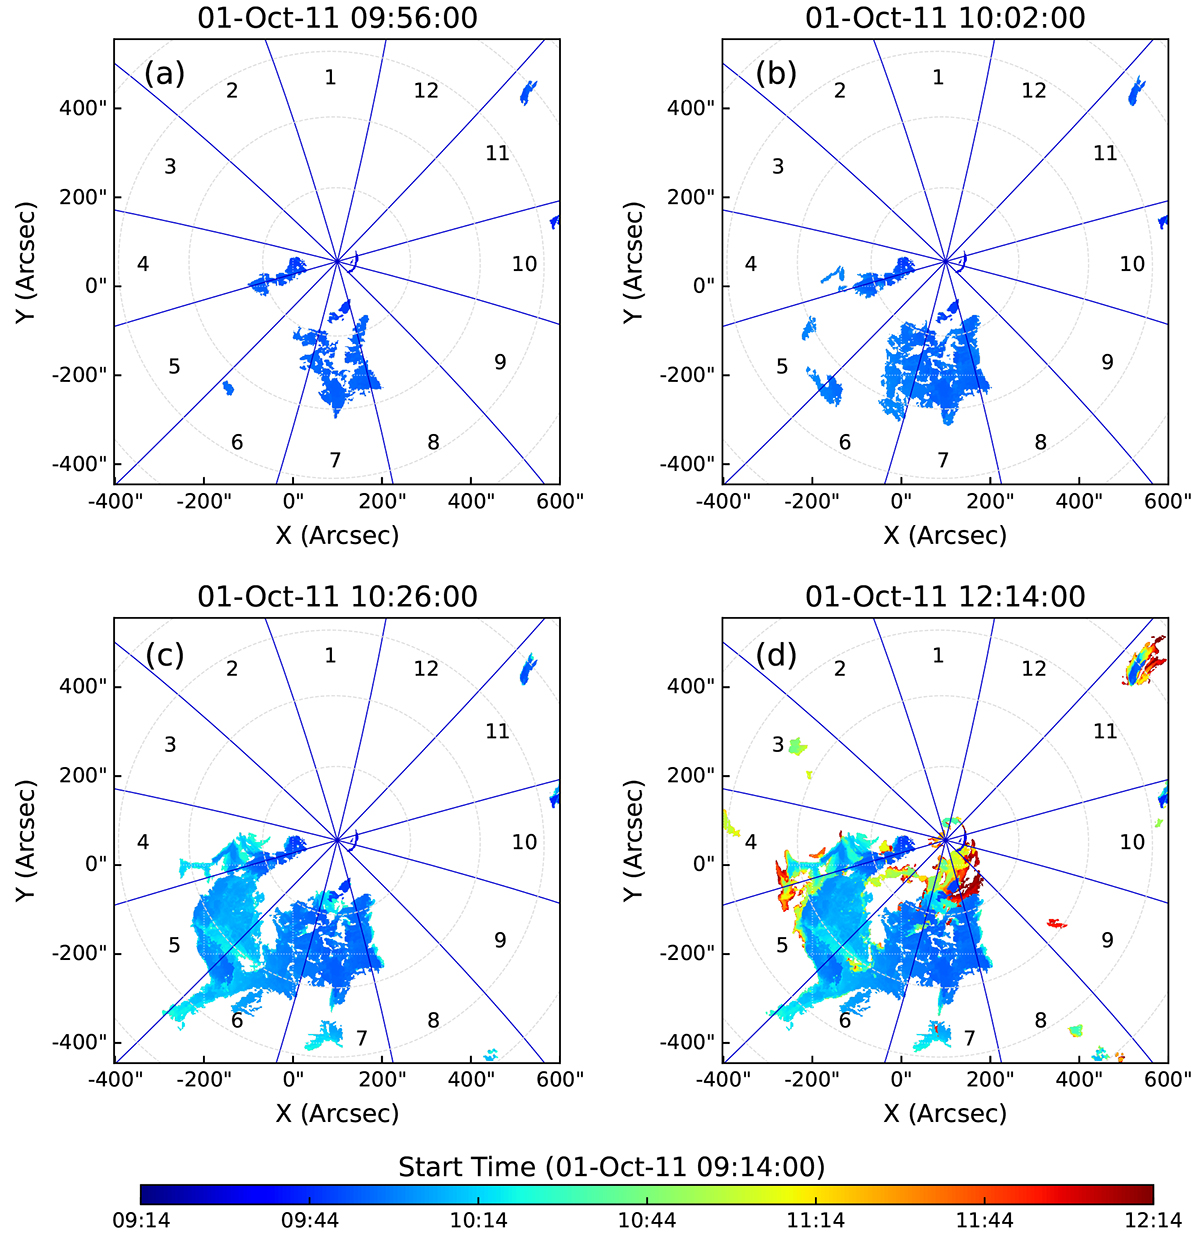
Download original image
Dimming evolution for 1 October, 2011 CME at (a) the maximum of the impulsive phase (reached 12 min after its start); (b) 18 min after the start of event; (c) at the end of the impulsive phase (30 min after the maximum of the impulsive phase); and (d) 2.5 h after the start. The blue lines indicate 12 angular sectors and the color bar shows when each dimming pixel was detected for the first time.
Current usage metrics show cumulative count of Article Views (full-text article views including HTML views, PDF and ePub downloads, according to the available data) and Abstracts Views on Vision4Press platform.
Data correspond to usage on the plateform after 2015. The current usage metrics is available 48-96 hours after online publication and is updated daily on week days.
Initial download of the metrics may take a while.