| Issue |
A&A
Volume 683, March 2024
|
|
|---|---|---|
| Article Number | A29 | |
| Number of page(s) | 20 | |
| Section | Astronomical instrumentation | |
| DOI | https://doi.org/10.1051/0004-6361/202346012 | |
| Published online | 05 March 2024 | |
J-PLUS: Toward a homogeneous photometric calibration using Gaia BP/RP low-resolution spectra
1
Centro de Estudios de Física del Cosmos de Aragón (CEFCA), Unidad Asociada al CSIC,
Plaza San Juan 1,
44001
Teruel,
Spain
e-mail: This email address is being protected from spambots. You need JavaScript enabled to view it.
2
Department of Astronomy, Beijing Normal University,
Beijing
100875,
PR China
3
Institut de Ciències del Cosmos (ICCUB), Universitat de Barcelona (UB),
Martí i Franquès 1,
08028
Barcelona,
Spain
4
Departament de Física Quàntica i Astrofísica (FQA), Universitat de Barcelona (UB),
Martí i Franquès 1,
08028
Barcelona,
Spain
5
Institut d’Estudis Espacials de Catalunya (IEEC),
c. Gran Capità, 2-4,
08034
Barcelona,
Spain
6
Centro de Estudios de Física del Cosmos de Aragón (CEFCA),
Plaza San Juan 1,
44001
Teruel,
Spain
7
Department of Physics, University of Warwick,
Coventry,
CV4 7AL,
UK
8
Universidade de São Paulo, Instituto de Astronomia,
Geofísica e Ciências Atmosféricas,
05508-090
São Paulo,
Brazil
9
Observatório Nacional – MCTI (ON),
Rua Gal José Cristino, 77,
São Cristóvão,
20921-400
Rio de Janeiro,
Brazil
10
Centro de Astrobiología (CAB), CSIC-INTA,
Camino Bajo del Castillo s/n, Campus ESAC,
28692
Villanueva de la Cañada,
Madrid,
Spain
11
Donostia International Physics Centre (DIPC),
Paseo Manuel de Lardizabal 4,
20018
Donostia-San Sebastián,
Spain
12
IKERBASQUE, Basque Foundation for Science,
48013
Bilbao,
Spain
13
University of Michigan, Department of Astronomy,
1085 South University Ave.,
Ann Arbor,
MI
48109,
USA
14
University of Alabama, Department of Physics and Astronomy,
Gallalee Hall,
Tuscaloosa,
AL
35401,
USA
15
Instituto de Astrofísica de Canarias (IAC),
38205
La Laguna,
Spain
16
Departamento de Astrofísica, Universidad de La Laguna (ULL),
38200
La Laguna,
Spain
Received:
28
January
2023
Accepted:
22
August
2023
Abstract
Aims. We present the photometric calibration of the 12 optical passbands for the Javalambre Photometric Local Universe Survey (J-PLUS) third data release (DR3) comprising 1642 pointings of two square degrees each.
Methods. We selected nearly 1.5 million main sequence stars with a signal-to-noise ratio larger than ten in the 12 J-PLUS passbands and available low-resolution (R = 20–80) spectrum from the blue and red photometers (BP/RP) in Gaia DR3. We compared the synthetic photometry from BP/RP spectra with the J-PLUS instrumental magnitudes after correcting for the magnitude and color terms between both systems in order to obtain a homogeneous photometric solution for J-PLUS. To circumvent the current limitations in the absolute calibration of the BP/RP spectra, the absolute color scale was derived using the locus of 109 white dwarfs closer than 100 pc with a negligible interstellar extinction. Finally, the absolute flux scale was anchored to the Panoramic Survey Telescope and Rapid Response System (Pan-STARRS) photometry in the r band.
Results. The precision of the J-PLUS photometric calibration estimated from duplicated objects observed in adjacent pointings and by comparison with the spectro-photometric standard star GD 153 is ~12 mmag in u, J0378, and J0395, and it is ~7 mmag in J0410, J0430, ɡ, J0515, r, J0660, i, J0861, and z. The estimated accuracy in the calibration along the surveyed area is better than 1% for all the passbands.
Conclusions. The Gaia BP/RP spectra provide a high-quality, homogeneous photometric reference in the optical range across the full sky in spite of their current limitations as an absolute reference. The calibration method for J-PLUS DR3 reaches an absolute precision and accuracy of 1% in the 12 optical filters within an area of 3284 square degrees.
Key words: methods: statistical / techniques: photometric / surveys
© The Authors 2024
 Open Access article, published by EDP Sciences, under the terms of the Creative Commons Attribution License (https://creativecommons.org/licenses/by/4.0), which permits unrestricted use, distribution, and reproduction in any medium, provided the original work is properly cited.
This article is published in open access under the Subscribe to Open model. This email address is being protected from spambots. You need JavaScript enabled to view it. to support open access publication.
1 Introduction
A fundamental step in the data processing of any imaging survey is its photometric calibration, which translates the observed counts in the reduced images to a physical flux scale referred to the top of the atmosphere. Accurate colors are needed to derive atmospheric parameters for Milky Way stars, photometric redshifts for galaxies and quasars, and surface composition for minor bodies in the Solar System; while reliable absolute fluxes directly affect the estimation of the luminosity and the mass of galaxies and stars. Within this framework, photometric surveys target a calibration uncertainty at the 1% level and below.
The calibration process can be split into two main steps: obtaining a homogeneous photometric solution along the surveyed area and estimating the absolute flux scale for each passband. Both steps are challenging for large-area (thousands of square degrees) multifilter (dozens of passbands) surveys, such as the Javalambre Photometric Local Universe Survey (J-PLUS; 12 optical filters; Cenarro et al. 2019), its southern counterpart S-PLUS (Mendes de Oliveira et al. 2019), and the Javalambre Physics of the Accelerating Universe Astrophysi-cal Survey (J-PAS; 56 optical filters of 14.5 nm width; Benítez et al. 2014; Bonoli et al. 2021). Because of the large number of filters required, observing spectro-photometric standard stars and performing nightly calibrations is unfeasible.
Regarding the homogenization of the photometry, several techniques have been proposed in the literature. We highlight the übercalibration (Padmanabhan et al. 2008; Wittman et al. 2012), the hypercalibration (Finkbeiner et al. 2016; Zhou et al. 2018), the forward global modeling (Burke et al. 2018), the stellar locus regression (Covey et al. 2007; High et al. 2009; Kelly et al. 2014; López-Sanjuan et al. 2019, 2021), and the stellar color regression (SCR; Yuan et al. 2015; Huang et al. 2021; Niu et al. 2021a; Xiao & Yuan 2022; Huang & Yuan 2022). The Gaia third data release (DR3; Gaia Collaboration 2023b) provides, for the first time, 220 million low-resolution (R = 20–80) spectra (Carrasco et al. 2021; De Angeli et al. 2023; Montegriffo et al. 2023), thanks to the observations performed with the blue photometer (BP; 330–680 nm) and the red photometer (RP; 630-1050 nm) on board the Gaia satellite (Gaia Collaboration 2016). Synthetic photometry from the BP/RP spectra may provide a homogeneous, all-sky, space-based reference for ground-based photometric surveys (Gaia Collaboration 2023a, hereafter GC23) despite the current limitations in the absolute scale of the BP/RP spectra, as reflected by the existence magnitude and color terms when compared with well-established photometric systems (see GC23 for a detailed discussion). This offers a great opportunity to homogenize the photometry of large-area multifilter optical surveys, avoiding dedicated observations for calibration and maximizing the survey speed.
In this paper, we used the externally calibrated BP/RP spectra released in Gaia DR3 (Montegriffo et al. 2023) to homogenize the photometric solution of the J-PLUS DR3 that covers 3284 deg2 with 12 optical filters (Table 1). The absolute color scale was derived using the white dwarf locus technique presented in López-Sanjuan et al. (2019). Finally, the absolute flux scale was anchored to the Panoramic Survey Telescope and Rapid Response System (Pan-STARRS) photometry in the r band.
This paper is organized as follows. The J-PLUS DR3 and the ancillary data used are presented in Sect. 2. The calibration methodology is summarized in Sect. 3, with special emphasis on the use of Gaia BP/RP spectra. The precision and accuracy in the J-PLUS DR3 calibration are discussed in Sect. 4. Finally, we present our conclusions in Sect. 5. Magnitudes are given in the AB system (Oke & Gunn 1983) unless noted otherwise.
2 Data
2.1 J-PLUS photometric data
Currently being conducted at the Observatorio Astrofísico de Javalambre (OAJ; Cenarro et al. 2014), J-PLUS1 uses the 83 cm Javalambre Auxiliary Survey Telescope (JAST80) and T80Cam, a panoramic camera with a single charge-coupled device (CCD) of 9.2k × 9.2k pixels that provides a 2 deg2 field of view (FoV) with a pixel scale of 0.55″ pix−1 (Marín-Franch et al. 2015). Details of the 12 bands of the J-PLUS filter system are summarized in Table 1 and are accessible at the filter profile service of the Spanish Virtual Observatory2. The J-PLUS observational strategy, image reduction, and scientific goals are presented in Cenarro et al. (2019).
The J-PLUS DR3 comprises 1642 pointings (3284 deg2) observed and reduced in all survey bands. The final images in each pointing and passband were obtained by the combination of three consecutive exposures. The limiting magnitudes (5σ, 3″ aperture) of the DR3 are presented in Table 1 for reference. The median point spread function (PSF) full width at half maximum (FWHM) in the DR3 r-band images is 1.1″. Source detection was done in the r band using SExtractor (Bertin & Arnouts 1996). The flux was measured in the 12 J-PLUS bands at the position of the detected sources using a variety of apertures, from circular apertures of different diameters to elliptical and isopho-tal, as defined in the r-band detection image. Objects near the borders of the images, close to bright stars, or affected by optical artifacts were masked, providing a unique high-quality area of 2881 deg2. The DR3 is publicly available at the J-PLUS website3 since 13 December 2022.
We note that the published J-PLUS DR3 photometry already includes all the calibration steps presented in Sect. 3. In addition to J-PLUS photometry, ancillary data from Gaia and Pan-STARRS were used in the calibration process. These datasets are described in the following sections.
J-PLUS photometric system.
2.2 Gaia DR3
The Gaia spacecraft is mapping the 3D positions and kinematics of a representative fraction of Milky Way stars (Gaia Collaboration 2016). The mission will ultimately provide astrom-etry (positions, proper motions, and parallaxes) and optical spectro-photometry for over a billion stars, as well as radial velocity measurements of more than 100 million stars.
In the present work, we used the Gaia DR3 (Gaia Collaboration 2023b), which is based on 34 months of observations. It contains astrometric determinations and provides integrated photometry in three broad bands, namely, G (330–1050 nm), GBP (330–680 nm), and GRP (6301050 nm), for 1.5 billion sources with G < 21. The Gaia DR3 also contains BP/RP low-resolution (R = 20–80) spectra for 220 million sources with G < 17.65 mag and enough transits to ensure a good signal-to-noise ratio for the data. The processing and internal calibration of the BP/RP spectra are presented in De Angeli et al. (2023), and the external calibration to provide physical fluxes is detailed in Montegriffo et al. (2023). These spectra were used to homogenize the J-PLUS photometric solution along the surveyed area (Sect. 3.2).
2.3 Pan-STARRS DR1
The Pan-STARRS1 is a 1.8 m optical and near-infrared telescope located on Mount Haleakala, Hawaii. The telescope is equipped with the Gigapixel Camera 1, consisting of an array of 60 CCD detectors of 4800 × 4800 pixels each. The 3π Steradian Survey (hereafter PS1; Chambers et al. 2016) covers the sky at a declination of δ > −30° with five filters, 𝑔ri𝓏y (Tonry et al. 2012).
Astrometry and photometry were extracted by the Pan-STARRS1 Image Processing Pipeline (Magnier et al. 2020a,b,c; Waters et al. 2020). The PS1 photometry features a uniform flux calibration, achieving better than 1% accuracy over the sky (Magnier et al. 2020b; Chambers et al. 2016; Xiao & Yuan 2022). The PS1 first data release (DR1) was made public in December 2016, providing a static-sky catalog and stacked images (Flewelling et al. 2020). Because of its homogeneous depth, excellent internal calibration, and large footprint, PS1 photometry provides an ideal reference to set the absolute flux scale of the J-PLUS magnitudes (Sect. 3.4).
3 Photometric calibration of J-PLUS DR3
The goal of the calibration process is to obtain the zero point (ZP) of the observation that relates the magnitude of the sources in a certain passband χ at the top of the atmosphere with the magnitudes obtained from the analog-to-digital unit (ADU) counts of the reduced images. We simplified the notation using the passband name as the magnitude in the filter. Thus,
 (1)
(1)
In the estimation of the J-PLUS DR3 instrumental photometry, the reduced images were normalized to a one-second exposure, and an arbitrary zero point, ZPχ = 25, was applied. This defined the instrumental magnitudes χins.
The calibration process applied in J-PLUS DR3 has different steps, as described in the following sections and summarized in Fig. 1. The final outcome is the zero point of the passband χ estimated for the pointing pid as
 (2)
(2)
where ∆χthr accounts for changes in the total throughput of the system at the moment of the observation (atmospheric extinction, airmass, mirror reflectivity, and filter transmission; Sect. 3.2), Pχ defines a plane that accounts for the 2D variation of the calibration with the (X, Y) position of the sources on the CCD (Sect. 3.2), ∆χWD is the global offset provided by the white dwarf (WD) locus, which translates homogenized colors to the AB scale on top of the atmosphere (Sect. 3.3), and ∆rPS1 is the global offset for the r band to anchor the absolute flux scale to the PS1 photometric solution (Sect. 3.4).
The J-PLUS instrumental magnitudes used for calibration were measured on a 6 arcsec diameter aperture, corrected by aperture effects to retrieve the total flux of stars. The aperture correction Caper depends on the passband and the pointing, and it was computed from the growth curve of non-saturated, bright stars in each image. The median aperture correction among all the passbands is Caper = −0.09 mag. The corrections used are available in the J-PLUS database4, and additional details about their estimation can be found in López-Sanjuan et al. (2019).
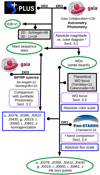 |
Fig. 1 Updated flowchart of the calibration method used in J-PLUS DR3. Arrows that originate in small dots indicate that the preceding data product is an input to the subsequent analysis. Datasets are shown with their project logo, and external data or models are denoted with black boxes. The rounded purple boxes show the calibration steps. The asterisk indicates the step based on dust de-reddened magnitudes. The blue boxes show intermediate data products, and green ovals highlight data products of the calibration process. The main change with respect to J-PLUS DR2 calibration is the use of Gaia BP/RP low-resolution spectra in the homogenization (Sect. 3.2). |
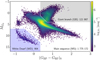 |
Fig. 2 Absolute magnitude in the G band vs. GBP − GRP color diagram, corrected for dust reddening, of the 1 898 063 high-quality sources in common between Gaia DR3 and J-PLUS DR3. The color scale presents the number density of stars per mag2, noted as ρ⋆. Three areas were defined following López-Sanjuan et al. (2019) as being dominated by main sequence stars (white area), giant branch stars (gray area), and white dwarfs (blue area). |
3.1 Step 1: Selection of the calibration stars
The first step of our methodology is to define a high-quality sample of stars to perform the photometric calibration. Thus, we cross-matched the J-PLUS DR3 sources with S/N > 10 and SExtractor photometric flag equal to zero (i.e., with neither close detections nor image problems) in all 12 passbands against the Gaia DR3 catalog using a 1.5″ radius5. We retained Gaia sources with S/N > 3 in parallax, represented as ϖ [arcsec], and with a photometric measurement in G, GBP, and GRP. The parallax condition was requested to ensure a well-defined absolute magnitude for the sources. Finally, J-PLUS sources with more than one Gaia counterpart were discarded. We obtained 1 898 063 unique, high-quality stars for calibration.
Next, the Gaia absolute magnitude versus color diagram was constructed, as presented in Fig. 2. The dust de-reddened G absolute magnitude of the calibration stars was obtained as
 (3)
(3)
where E(B − V) is the color excess of the source and kG the extinction coefficient of the G passband. The de-reddened GBP − GRP color was computed as
 (4)
(4)
where  and
and  are the extinction coefficients in the GBP and GRP passbands, respectively. The extinction coefficients were obtained with the extinction law presented in Schlafly et al. (2016) and assuming RV = 3.1, with kV = 2.600,
  , and
, and  . This provided a first-order correction, since the proper coefficients depend on color and dust-column density (e.g., Danielski et al. 2018; Zhang & Yuan 2023).
The color excess at infinite distance of each J-PLUS source was estimated from the Schlegel et al. (1998) extinction map6. The calibration stars have distance information from Gaia DR3 parallaxes, and we used the Milky Way dust model presented in Li et al. (2018) to properly scale the color excess at infinity to obtain E(B − V). This process was tested with the star-pair method presented in Yuan et al. (2013). We concluded that the assumed E(B − V) is a good proxy for the real color excess of the stars with an uncertainty of 0.012 mag. Additional details are presented in López-Sanjuan et al. (2021).
The inverse of the parallax was used as a distance proxy in Eq. (3). This is a crude approximation to the distance, as demonstrated by Bailer-Jones et al. (2018). Since our goal is to define general populations to calibrate the J-PLUS photometry, the simplified extinction and distance schemes used in Eq. (3) fulfill our requirements. We also stress that we used de-reddened magnitudes only for the initial selection of the calibration stars.
Following López-Sanjuan et al. (2019), three areas were defined in the magnitude-color diagram. These areas are dominated by main sequence stars (1775 172 sources), giant branch stars (121987 sources), and white dwarfs (904 sources). The main sequence stars were used in the homogenization step (Sect. 3.2), and the white dwarfs were used to obtain the AB scale of the J-PLUS colors (Sect. 3.3). In these steps, observed magnitudes were used, and no reddening correction was applied.
3.2 Step 2: Homogenization with synthetic photometry from BP/RP spectra
The main change we implemented with respect to the calibration process of previous J-PLUS data releases is the replacement of the stellar locus technique by the synthetic photometry from BP/RP spectra to homogenize the photometric solution along the surveyed area. To provide a photometric calibration at the top of the atmosphere, the stellar locus technique demands previous knowledge of the extinction and some atmospheric parameters of the stars (i.e., surface gravity and metallicity) to avoid systemat-ics across the sky due to interstellar reddening and the Milky Way metallicity gradient (López-Sanjuan et al. 2019, 2021). The stellar locus technique is therefore limited by our current understanding of the interstellar extinction (e.g., Sun et al. 2022) and the access to spectroscopic-based metallicities. The Gaia BP/RP low-resolution spectra provide a great opportunity to have an all-sky, space-based reference photometry on top of the atmosphere and to obtain a homogeneous J-PLUS calibration without the need of previous knowledge about the extinction or the metallic-ity of the used stars. Nevertheless, we note that any systematics present in the BP/RP spectra will be inherited by J-PLUS.
The basis of the synthetic photometry estimation for a given passband from the BP/RP spectra are extensively presented in GC23. We followed their recommendations and suggestions to obtain the proper synthetic photometry in the J-PLUS filter system. The first goal is to ensure that the synthetic photometry derived from Gaia BP/RP spectra is reliable. We followed the recipe in GC23, where the FWHM of the targeted passband should be at least 1.4 times larger than the FWHM of the externally calibrated Gaia spectra (Montegriffo et al. 2023) at the central wavelength of the passband. The comparison between the FWHM of the J-PLUS medium and narrow passbands and of the BP/RP spectra is presented in Fig. 3. We found that the J-PLUS filter system can be safely obtained from BP/RP spectra. The FWHM of all the passbands is larger than the 1.4-times limit, with J0395 and J0515 just on the edge.
The next stage was to obtain the synthetic photometry of the main sequence calibration stars. We used the code GaiaXPy7 to retrieve the J-PLUS synthetic magnitudes, noted as χsyn, for those sources with available spectrum and G < 17.65 Vega mag. In the process, additional quality cuts were applied: RUWE < 1.4, phot_variable_flag ≠ VARIABLE, and the 5σ condition for the flux excess factor C* defined by Riello et al. (2021). We refer the reader to the Gaia documentation and the work by Riello et al. (2021) for the definition of these fields. To minimize the impact of blended sources in the J-PLUS photometry, only those with a morphological class_star > 0.1 in the J-PLUS database were considered. The final number of sources with synthetic photometry from BP/RP spectra was 1498 074. The distribution of these sources in the sky is presented in Fig. 4. We found that most J-PLUS pointings, which cover 2 deg2 each, present a homogeneous coverage, but some areas are underpopulated. This is a consequence of the Gaia scanning law and the lower number of observations available in the missing areas. As already mentioned in GC23, these areas will be filled in future Gaia data releases. We checked the impact of the depopulated areas in the number of calibration stars per pointing, nstar (Fig. 5). We found that the median number of calibration sources per pointing is nstar = 751, with a mode of 430 sources. The median fraction of missing calibration stars per pointing with respect to the initial sample is 11%. There are only 27 (1.6%) pointings heavily affected by the missing areas and less than 200 calibration sources. We tested that the general calibration process worked correctly even in these pointings, and therefore, we did not apply any further correction to them.
We measured the difference between the J-PLUS synthetic photometry from BP/RP spectra and the J-PLUS instrumental photometry8 for each star in a given pointing pid and filter as
 (5)
(5)
The distribution δχ was fitted with a Gaussian function of median µχ and dispersion σχ. Then, the zero-median difference for each star was defined as
 (6)
(6)
As shown by López-Sanjuan et al. (2019), the residuals  vary along the FoV and are position dependent. The dominant spatial component has a plane shape, and we performed a fit to the function
 (7)
(7)
where (X, Y) represents the location of the source in the CCD9. Additional information about this correction is presented at the end of the section. We applied the plane correction and reevaluated the median of the distribution to obtain the final residuals.
This process should provide the term ∆χthr in Eq. (2). However, GC23 has demonstrated that the current absolute calibration of the BP/RP spectra has both magnitude and color terms when compared with well-established observations in a variety of photometric systems (i.e., Sloan Digital Sky Survey, Pan-STARRS, Johnson-Kron-Cousins). We found that these terms are also present in J-PLUS, as shown in the top panels of Figs. 6–8 for the r, u, and J0515 passbands, respectively. Similar figures for the remaining J-PLUS filters are presented in Appendix A. We note that the definition of our residuals has an opposite sign to the definition in GC23. On the one hand, the hockey stick feature found by Evans et al. (2018), Riello et al. (2021), and GC23 in the magnitude residuals is also clear in J-PLUS. On the other hand, the color terms are also consistent with the findings from GC23 for similar broad bands. We found that the color terms in the bluest passbands are large. For example, the u band presents a difference of 0.2 mag at GBP − GRP ~ −1 mag and −0.6 mag at GBP − GRP ~ 2 mag (Fig. 7). We note that even in this extreme case, the differences are systematic and nearly independent of the J-PLUS pointing. Finally, the medium and narrow passbands have different behaviors. As an example, the J0515 passband presents a small difference at GBP − GRP < 0.5 mag that increases, reaching 0.1 mag at GBP − GRP ~ 1.5 mag (Fig. 8).
From the measured magnitude and color differences, we estimated transformation functions to translate χsyn to χins as accurately as possible. These functions are noted as  and
and  for the magnitude and color terms, respectively. To compute them, the median of the residuals was evaluated for G ∈ [11.75, 18.00] Vega mag in 0.25 mag bins and GBP − GRP ∈ [−0.5, 2.5] Vega mag in 0.1 mag bins. Then, a linear interpolation in magnitude and color was done independently. For those sources beyond the magnitude or color limits that correspond to only 0.01% of the calibration stars, a linear extrapolation was applied. We defined the transformed differences for each star as
 (8)
(8)
and updated the value of μχ. The zero-median difference,  , was used to reevaluate the plane correction, and we used the new residuals to update the transformation functions. This process was iterated five times, converging to median magnitude and color terms below 1 mmag (bottom panels in Figs. 6–8). The final transformations functions are publicly available on the J-PLUS website10.
During the estimation of the calibration accuracy across the surveyed area (Sect. 4.2), we found systematic discrepancies between the Gaia-based zero points and those measured with the SCR method in the pointings more affected by interstellar reddening. We noticed that the median color of the calibration stars is significantly redder in the discrepant pointings due to the higher extinction. Hence, for each pointing we computed the difference
![Mathematical equation: ${\rm{\Delta }}C = \langle {G_{{\rm{BP}}}} - {G_{{\rm{RP}}}}\rangle - 0.887[{\rm{Vega}}],$](/articles/aa/full_html/2024/03/aa46012-23/aa46012-23-eq18.png) (9)
(9)
where 〈GBP – GRP〉 is the median color of the calibration stars in the pointing and 0.887 Vega mag is the median color of all the calibration stars in J-PLUS. For the pointings with ∆C > 0.015, we subtracted ∆C from the observed GBP − GRP color of the calibration stars in the evaluation of the function  . The color of the calibration stars in the pointings with ∆C ≤ 0.015 remains the one that is observed. Thanks to the applied displacement, the systematic differences with respect to the SCR method were minimized. This process implies that the shape of the color transformation
  is equivalent between pointings but significantly displaced to redder colors in those areas with a relevant interstellar extinction. The J-PLUS footprint does not cover heavily extincted areas, and the adopted hypothesis should be tested in the future using either different data sets or archival JAST80 observations performed for open time programs covering highly extincted regions. As a concluding remark, the observed effect may reflect an extinction-dependent bias in the calibration of the Gaia DR3 low-resolution spectra.
The median in the final distribution of ∆χ − Ρχ was stored as the term ∆χthr for each passband and pointing. At this stage, we defined the homogenized J-PLUS magnitudes from Gaia BP/RP spectra as
 (10)
(10)
The relative precision and accuracy of these magnitudes are analyzed in Sect. 4.
We finish this section by discussing the plane correction Ρχ presented in Eq. (7) in more detail. A relevant effect in wide FoV instruments is the variation of the zero point with the position of the sources on the CCD. This can be due to the differential variation of the airmass across the observation, a non-homogeneous background in the estimation of the flat-field images, the presence of scattered light in the focal plane, or the change of the effective filter curves with position (see Regnault et al. 2009; Starkenburg et al. 2017 for further details). The reduction of J-PLUS images includes a calibration frame (ICOR in the following) to compensate the illumination inhomogeneities caused by the estimation of the flat-field frames with sky images. The ICOR frames were computed on a monthly basis for each pass-band by observing a stellar field six times with a large dithering pattern. Then, the photometry of the same stars at the different locations of the CCD was extracted and compared. The ICOR frame was constructed by imposing that the photometry of a non-variable star must not depend on the FoV location.
The ICOR frame was applied to all the J-PLUS images. However, comparison with Pan-STARRS photometry performed by López-Sanjuan et al. (2019) revealed a residual pattern along the FoV. This pattern is also present in the residuals with respect to Gaia synthetic photometry, as illustrated with the sky variation of the residuals in the r band (top panel of Fig. 9) and the median residuals in the same band for all 1642 pointings as a function of the CCD position (left panel of Fig. 10). The median of the residuals for the other 11 J-PLUS passbands with CCD positions is presented in Appendix B. The shape of the residuals is well described with a plane, and the impact is at a 10 mmag level in the case of the r band. There is a dominant direction for the gradient, but the intensity depends on the pointing. The inclusion of Pχ in the calibration process greatly improves the homogeneity of the residuals, as illustrated in Figs. 9 and 10. We found a nearly homogeneous residual across the sky, with a hint of higher differences in the pointings closer to the Milky Way disk. We note that the pointings affected by the lower density of Gaia BP/RP spectra do not present any noticeable anomaly. Finally, the median of the residuals along the FoV in the r band after the plane correction still presents a circular structure at the 2 mmag level. This structure is also shown in the i, J0660, and z bands (Appendix B).
Our current hypothesis for the origin of the plane residual is related to the differences in the sky background between the images used in the construction of the flat-field and the ICOR calibration frames. This hypothesis was tested by estimating  for images without the ICOR frame applied. We found that the ICOR pattern is clearly present, but some differences in the shape are noticeable. This mismatch is responsible for the structures present in the residuals even after correcting by Pχ (for example, passbands J0378 and J0861; see Appendix B). We concluded that the Gaia BP/RP synthetic photometry could also be used to improve the estimation of the ICOR frame by stacking the residuals
  obtained from the science images. This would save telescope time and permit a detailed analysis of the variation with time of the ICOR. Unfortunately, this implies a major change in the reduction pipeline, and this action has been postponed until future data releases.
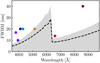 |
Fig. 3 Full width at half maximum of the Gaia BP/RP spectra as a function of wavelength (black dashed line). The gray area marks the avoidance region corresponding to less than 1.4 times the FWHM of the BP/RP spectra. The colored dots show the FWHM of the medium and narrow passbands in J-PLUS. |
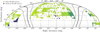 |
Fig. 4 Density of main sequence calibration stars with (green) and without (blue) BP/RP spectra in Gaia DR3 after applying the recommended quality selection criteria. The solid line marks the location of the Milky Way, and the dashed lines depict b = ±10 deg. |
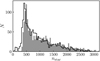 |
Fig. 5 Histogram of J-PLUS DR3 pointings for a given number of main sequence calibration stars (nstar) with (outlined in black) and without (gray shaded) BP/RP spectra in Gaia DR3 after applying the recommended quality selection cuts. |
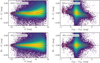 |
Fig. 6 Residuals between the synthetic photometry from Gaia BP/RP spectra and J-PLUS photometry in the r band as a function of the G magnitude (left panels) and the GBP − GRP color (right panels) before applying the transformation terms |

3.3 Step 3: Absolute color scale with the white dwarf locus
The homogeneous J-PLUS magnitudes derived in the previous section must be translated from the Gaia scale to the AB scale. As shown by GC23 for several filter systems and in the present paper for J-PLUS, the presence of magnitude and color terms are due to the current limitations in the external, absolute calibration of Gaia DR3 BP/RP spectra. To circumvent this problem, the absolute color scale of the J-PLUS passbands was obtained with the white dwarf locus technique. Here, we provide the relevant technical details for completeness, and the reader is referred to López-Sanjuan et al. (2019) for a detailed description.
The properties of white dwarfs make them excellent standard sources for calibration (Holberg & Bergeron 2006; Wall et al. 2019). Their model atmospheres can be specified at around the 1% level with knowledge of the effective temperature (Teff) and the surface gravity (log g). These parameters can be estimated from spectroscopy, providing a reference flux for calibration. They are also mostly photometrically stable. A significant theoretical and observational effort is still underway to provide a robust white dwarf network for the calibration of photometric surveys (e.g., Bohlin 2000; Holberg & Bergeron 2006; Narayan et al. 2016, 2019; Gentile Fusillo et al. 2020; Bohlin et al. 2020, and references therein).
The observational white dwarf locus presents two branches, corresponding to hydrogen- and helium-dominated atmospheres (e.g., Holberg & Bergeron 2006; Ivezić et al. 2007; Ibata et al. 2017; Gentile Fusillo et al. 2019; Bergeron et al. 2019; López-Sanjuan et al. 2022). We performed a Bayesian modeling of the 11 independent (χ − r)G versus (g − i)G color-color diagrams in J-PLUS, with the r band used as the absolute reference in the process. We confronted the theoretical locus against the observations, accounting for the observational errors in the colors, and we estimated the best parameters that model the observed color-color distribution of the white dwarfs. The parameter space was explored with the Monte Carlo Markov chain code emcee (Foreman-Mackey et al. 2013).
The theoretical loci were obtained from the models including the 3D effects presented in Tremblay et al. (2013) for Η dominated atmospheres and in Cukanovaite et al. (2018) for He dominated atmospheres. The locus model has 26 parameters. The distribution in (𝑔 − i)G was described by a Gaussian function whose parameters were the median (μ) and the dispersion (s). The general white dwarf population has two parameters: the fraction of Η-dominated white dwarfs (fH) and the median surface gravity of the population. The offsets, named ∆C1 and ∆C2, in each color-color diagram account for 11 parameters. These offsets impose a match between the theoretical locus and the observations. The offset ∆C2 is equivalent to −∆χWD in Eq. (2), translating the homogenized photometry to the AB scale. We defined ∆C1 = ∆iWD − ∆𝑔WD, and it is a term shared by all the color-color diagrams. This color sharing reduced the initial 22 parameters to 11 independent measurements. Finally, the diversity of white dwarf properties produced a physical dispersion in the locus after accounting for observational uncertainties. These physical variations are encoded in an intrinsic dispersion for each passband (σint), accounting for the remaining 11 parameters.
From the Gaia absolute magnitude versus color diagram in Sect. 3.1, we selected 123 high-quality white dwarfs located at d < 100 pc. We restricted the sample to distances closer than 100 pc, where the interstellar extinction can be neglected (e.g., Lucke 1978; Lallement et al. 2003; Zucker et al. 2022) and the observed J-PLUS magnitudes can therefore be used without correction from dust reddening. A simplified version of the model was first run with an extra component to identify outliers, that is, white dwarfs that are far from the theoretical locus. This was performed in sequence, starting from the z band and moving to shorter wavelengths. In each color-color diagram, the outliers were identified and excluded. From the initial sample of 123 white dwarfs, we identified 14 outliers. Next, the final joint Bayesian analysis of the locus for the remainingl09 white dwarfs in the 11 color-color diagrams was performed in order to compute the final offsets ∆χWD.The result for the u passband is presented in Fig. 11. The color-color diagrams for the other passbands are gathered in Appendix C.
The estimated parameters shared by all the color-color diagrams were μ = −0.237 ± 0.010, s = 0.309 ± 0.009, fH = 0.778 ± 0.020, and log g = 8.08 ± 0.03. The obtained offsets from the white dwarf locus technique are summarized in Table 2 and Fig. 12. We found a broad agreement with the Gaia BP/RP spectra scale, with differences below 0.04 mag. We also identified a trend, with the offsets changing from ∆uwd = 0.034 mag to ∆J0430wd = −0.038 mag, then increasing again to ∆zwd = 0.010 mag. We note that these are the residual differences after accounting for the magnitude and color terms presented in Sect. 3.2 and therefore refer to the median color of the calibration stars, GBP − GRP = 0.55 mag. Thanks to the white dwarf locus, the χG magnitudes were placed in the AB scale.
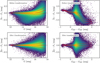 |
Fig. 7 Residuals between the synthetic photometry from Gaia BP/RP spectra and J-PLUS photometry in the u band, following Fig. 6. |
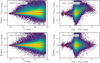 |
Fig. 8 Residuals between the synthetic photometry from Gaia BP/RP spectra and J-PLUS photometry in the J0515 band, following Fig. 6. |
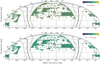 |
Fig. 9 Sky distribution of the residuals between the synthetic photometry from Gaia BP/RP spectra and J-PLUS photometry in the r band without applying the plane correction Pr (top panel) and after applying it (bottom panel). The solid line marks the location of the Milky Way, and the dashed lines depict b = ±10 deg. |
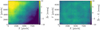 |
Fig. 10 Median residuals between the synthetic photometry from Gaia BP/RP spectra and J-PLUS photometry in the r band as a function of the (X, Y) position of the sources on the CCD without applying the plane correction Pr (left panel) and after applying it (right panel). |
ESTIMATED OFFSETS TO OBTAIN THE AB COLOR SCALE OF THE J-PLUS PASSBANDS.
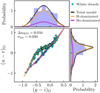 |
Fig. 11 Color-color diagram (u − r)G versus (g − i)G of the 109 high-quality white dwarfs at distance d < 100 pc in J-PLUS DR3. The solid lines show the theoretical loci for Η-dominated (orange) and He-dominated atmospheres (magenta). The gray scale shows the most probable model that describes the observations. The blue probability distributions above and to the right show the (g − i)G and (u − r)G projections of the data, respectively. The projections of the total, H-dominated, and He-dominated models are represented by the black, orange, and magenta lines. The values of the filter-dependent parameters σint and ∆χWD are indicated in the main panel. |
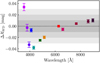 |
Fig. 12 Zero point offset from the white dwarf locus (∆χWD) for the J-PLUS filter system. The progressively lighter gray areas show differences of 0.01, 0.02, and 0.03 mag, respectively. |
3.4 Step 4: Absolute flux scale with PS1
The white dwarf locus technique is able to provide the absolute color scale of the J-PLUS passbands, with the r band used as a reference. Because of the magnitude and color terms between BP/RP spectra and J-PLUS, we used the PS1 magnitudes in r to set the absolute flux scale for the J-PLUS photometry.
We cross-matched the main sequence calibration stars with the PS1 DR1 catalog using a 1.5″ radius11. Sources with more than one counterpart in the PS1 catalog or without a valid photometric measurement on gri PS1 passbands were discarded. We used the PS1 PSF magnitudes as reference (Magnier et al. 2020c).
We compared the homogenized magnitudes rG from J-PLUS with the transformed r-band magnitudes from PS1. The transformation term accounts for the difference between the J-PLUS and PS1 passbands:
 (11)
(11)
![Mathematical equation: ${T_r^{{\rm{PS}}1} = 4.9 - 3.2 \times {C_{{\rm{PS}}1}} + 8.2 \times C_{{\rm{PS}}1}^2[{\rm{mmag}}].}$](/articles/aa/full_html/2024/03/aa46012-23/aa46012-23-eq27.png) (12)
(12)
This transformation is valid at 0.4 < CPS1 < 1.4, and only sources within this color range were used in the comparison. The details about the estimation of this transformation term are presented in López-Sanjuan et al. (2019).
The median of the differences between the magnitudes was computed for each pointing, providing the offset between the Gaia and PS1 photometric scales. The distribution of the differences for the 1 642 pointings in J-PLUS DR3 follows a Gaussian with a median of 4.3 mmag and a dispersion of 3.4 mmag. Hence, we set ∆rPS1 = 4.3 mmag in Eq. (2) and assumed an uncertainty of 5 mmag in this absolute flux scale. The accuracy of the absolute scale is discussed in Sect. 4.3.
Estimated error budget of the J-PLUS DR3 photometric calibration and final median zero points.
4 Error budget
This section is devoted to the error budget analysis in the J-PLUS DR3 calibration. We study the relative precision in the photometry in Sect. 4.1, the relative accuracy across the surveyed area in Sect. 4.2, and the absolute accuracy in Sect. 4.3. The estimated uncertainties in the photometric calibration are summarized in Table 3 and should be added to the Poisson and background errors from flux extraction.
4.1 Relative precision from overlapping areas
Adjacent J-PLUS pointings slightly overlap with each other. To measure the precision of the calibration, the photometry of calibration stars independently observed in two pointings was compared. The number of unique pointing pairs with overlap in J-PLUS DR3 is 4247. For each pointing pair, we computed the difference between the two calibrated magnitudes of the common stars and estimated the median of the differences. To minimize the effect of the individual errors, only the pointing pairs with 25 or more common sources were kept. This provided 670 median differences. The targeted precision was obtained as  , where σ is the measured dispersion of the distribution of differences. The obtained precision is summarized in Fig. 13 and Table 3, and on average, it is ~9 mmag in u, J0378, and J0395; ~5 mmag in J0410 and J0430; and ~3 mmag in 𝑔, J0515, r, J0660, i, J0861,and z.
We tested the change with respect to the stellar locus methodology, that is, the reference calibration method in J-PLUS DR2 (López-Sanjuan et al. 2019, 2021). Following the same definitions, we found an improvement of approximately 20% in the precision at λ < 4500 Å and compatible results for the rest of the passbands (Fig. 13). We highlight the improvement found in the bluer passbands where the signal of the BP/RP spectra is lower and a better performance than the stellar locus technique was not ensured. These results support the capabilities of the Gaia BP/RP spectra to obtain a homogeneous photometry across the sky and greatly simplifies the calibration procedure, with no previous information about the extinction nor the metallicity of the sources being required.
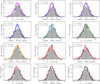 |
Fig. 13 Distribution of median differences in the photometry of main sequence stars independently observed by two adjacent pointings with at least 25 sources in common. The gray filled histogram shows the results obtained with the stellar locus regression technique, and the colored histogram shows the results when using the Gaìa BP/RP low-resolution spectra as a reference. The gray and colored lines are the best Gaussian fits to the former and latest case, respectively. The precision in the calibration is labeled in the panels and was estimated as the dispersion of the fitted Gaussian divided by the square root of two. We present, from top to bottom and from left to right, the filters u, J0378, J0395, J0410, J0430, 𝑔, J0515, r, J0660, i, J0861, and z. |
4.2 Relative accuracy along the surveyed area with the SCR method
The comparison of the photometry in adjacent pointings is not able to provide a measurement of the accuracy of the calibration along the surveyed area. The SCR method (Yuan et al. 2015; Huang et al. 2021) uses the effective temperature, surface gravity, and metallicity from spectroscopy to match stars of the same properties (i.e., intrinsic colors) and ascribes the observed color differences to the effect of interstellar extinction. This permits the homogenization of the photometric solution by naturally accounting for temperature, gravity, metallicity, and extinction effects. The SCR has been used to validate and improve the photometric calibration of the Sloan Digital Sky Survey (Yuan et al. 2015), Pan-STARRS (Xiao & Yuan 2022), Gaia (Niu et al. 2021a,b), and the Sky Mapper Southern Survey (Huang et al. 2021), reaching an accuracy better than 1% in all the surveys.
Using the atmospheric parameters from the Large Sky Area Multi-Object Fiber Spectroscopic Telescope (LAMOST; Cui et al. 2012) DR712, the SCR method was applied to J-PLUS DR3, and magnitudes at the top of the atmosphere were obtained. Due to the large sky coverage of LAMOST DR7, 1481 (90%) pointings were calibrated. A detailed application and analysis of the SCR calibration is beyond the scope of the present paper and will be presented in a forthcoming work.
We found that the difference between the Gaia-based and the SCR-based zero points follow a Gaussian distribution with dispersion σSCR as reported in Table 3. The dispersion is ~9 mmag in u, J0378, and J0395; ~4 mmag in J0410 and J0430; and ~2 mmag in the rest of the J-PLUS passbands (Fig. 14). The origin of this dispersion is related to the treatment of the interstellar extinction in SCR, the limitations in the all-sky homogeneity of the BP/RP spectra, and the inherent statistical dispersion of each method.
As in the previous section, the accuracy using BP/RP spectra improves with respect to the use of the stellar locus technique.
The dispersion between the zero points based on the stellar locus and the SCR is systematically higher (Figs. 14 and 15). There is a general improvement of approximately 40% in the accuracy when the BP/RP spectra were used as a reference. Again, these results confirm that the Gaia low-resolution spectra are a competitive choice to perform homogenization of large-area, multifilter surveys with minimum assumptions, even at λ < 4500 Å.
We note that the accuracy and the precision of the calibration present comparable figures for each passband. This suggests that the current methodology may be close to pure random uncertainties and that residual systematic differences should be below 1%. The comparison with the independent SCR method provides a proxy for the accuracy in the J-PLUS photometry, which we set at a percentage level or better for all the J-PLUS passbands.
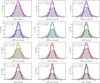 |
Fig. 14 Distribution of the difference between the zero points estimated with Gaia synthetic photometry (colored histograms) and the stellar locus regression technique (gray histograms) with respect to the zero points estimated with the SCR methodology. The gray and colored lines are the best Gaussian fits to the former and latest case, respectively. The accuracy in the calibration is labeled in the panels. We present, from top to bottom and from left to right, the filters u, J0378, J0395, J0410, J0430, 𝑔, J0515, r, J0660, i, J0861, and z. |
4.3 Absolute precision in the flux calibration
We tested the absolute flux calibration in J-PLUS DR3 by comparing the final photometry with the synthetic photometry of the spectroscopic standard star GD 153. This white dwarf is one of the three calibration pillars from the Hubble Space Telescope (HST), and it was observed as part of J-PLUS DR3. The r-band magnitude of GD 153 in J-PLUS is r = 13.59 mag, so its photometry is dominated by calibration uncertainties with small photon counting errors. We found additional spectro-photometric standard stars observed by J-PLUS DR3. The individual results from these sources are noisier than for GD 153, with similar average results. Moreover, the spectra of these extra standards are calibrated using the three HST pillars as reference.
We used the GD 153 reference spectra from CALSPEC13 (Bohlin et al. 2014,2020) and from the Gaia spectro-photometric standard stars (SPSS) survey14 (Pancino et al. 2012, 2021). The results are presented in Fig. 16. We found a remarkable 1% agreement in all the passbands between the reference spectra and the J-PLUS photometry. Statically, we expected 8.2 passbands to be compatible with respect to GD 153 synthetic photometry at 1σ and 11.5 passbands to be compatible at 2σ. We found 8 and 12 measurements compatible with both CALSPEC and Gaia SPSS at 1 and 2σ, respectively. Hence, the J-PLUS photometry is at the AB scale provided by GD 153 within uncertainties.
The situation has improved with respect to J-PLUS DR2, where the same test was performed (López-Sanjuan et al. 2021). A difference of 3% for the u band; of 2% for J0378, J0395, J0410, and J0430; and below 1% for 𝑔, J0515, r, J0660, i, J0861, and z was found. The new homogenization process based on Gaia BP/RP spectra and the use of dust-free white dwarfs in the estimation of the color scale have significantly decreased the discrepancies in the passbands at λ < 4500 Å, pushing the absolute accuracy to the one percent level in the complete J-PLUS filter system.
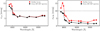 |
Fig. 15 Summary of the relative precision (σcal; left panel) and accuracy (σSCR; right panel) estimated for the J-PLUS DR3 photometric calibration. Red and black symbols show the results obtained with the stellar locus technique and the BP/RP spectra from Gaia, respectively. The dotted line marks a 1% level uncertainty. |
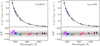 |
Fig. 16 Comparison between the J-PLUS DR3 photometry (𝒳J-PLUS; colored points) of GD 153 and its synthetic photometry (𝒳standard; black outlined circles) estimated from the standard spectra in CALSPEC (left panel) and Gaia SPSS (right panel). In both panels, the standard spectrum is shown with the black solid line. The magnitude difference ∆𝒳 = 𝒳J-PLUS − 𝒳standard is shown in the lower panels. The dotted line marks a zero difference. The progressively lighter gray areas show differences of 0.01, 0.02, and 0.03 mag, respectively. |
5 Summary and conclusions
We presented the photometric calibration at the top of the atmosphere for the J-PLUS DR3 12 optical passbands across 3284 deg2 of the northern sky. Synthetic photometry derived from the BP/RP spectra released as part of the Gaia DR3 for nearly 1.5 million main sequence stars was used to homogenize the photometric solution. The AB color scale was derived using the locus of 109 white dwarfs closer than 100 pc, for which interstellar extinction can be neglected. Finally, the absolute flux scale was anchored to the Pan-STARRS photometry in the r band.
The relative precision of the calibration, measured from repeated sources in the overlapping areas between pointings and including absolute color and flux scale uncertainties, is ~12 mmag in u, 70378, and 70395, and it is ~7 mmag in J0410, J0430, 𝑔, J0515, r, J0660, i, J0861, and z. We found an approximately 20% improvement with respect to the stellar locus technique applied in DR2 for passbands with λ < 4500 Å.
The relative accuracy was estimated through a comparison with the SCR methodology. Between both methods, we found a dispersion of ~9 mmag in u, J0378, and J0395; of ~4 mmag in J0410 and J0430; and of ~2 mmag in 𝑔, J0515, r, J0660, i, J0861, and z. There is a general approximately 40% improvement when compared with the stellar locus technique. This demonstrates the capabilities of BP/RP spectra as a high-quality reference to homogenize ground-based optical photometry. Finally, the absolute precision in the J-PLUS flux scale was set at 1% in all the passbands from the comparison with the spectro-photometric standard star GD 153.
We conclude that the combination of the synthetic photometry derived from Gaia BP/RP spectra, used to homogenize the photometric solution, and the white dwarf locus, used to retrieve the absolute color AB scale, is able to provide a photometric calibration for large-area multifilter optical surveys with one percent (and below) accuracy and precision. The absolute calibration of the BP/RP spectra is expected to improve in future Gaia data releases, which is to be tested with the decrease in the amplitude of the magnitude and color transformation functions with respect to the J-PLUS photometry and the offsets requested by the white dwarf locus approach. As a technical application, the all-sky coverage with BP/RP spectra would permit the photometric calibration of T80Cam images in quasi-real time, providing an estimation of the atmosphere’s transparency that would improve the queue execution of observing programs with different requirements in the sky conditions.
Acknowledgements
We dedicate this paper to the memory of our six IAC colleagues and friends who met with a fatal accident in Piedra de los Cochi-nos, Tenerife, in February 2007, with special thanks to Maurizio Panniello, whose teachings of python were so important for this paper. We thank the anonymous referees for useful comments and suggestions. We thank the relevant discussions with the J-PLUS collaboration members. Based on observations made with the JAST80 telescope at the Observatorio Astrofísico de Javalambre (OAJ), in Teruel, owned, managed, and operated by the Cen-tro de Estudios de Física del Cosmos de Aragón. We acknowledge the OAJ Data Processing and Archiving Unit (UPAD) for reducing the OAJ data used in this work. Funding for the J-PLUS Project has been provided by the Governments of Spain and Aragón through the Fondo de Inversiones de Teruel; the Aragonese Government through the Research Groups E96, E103, E16_17R, E16_20R, and E16_23R; the Spanish Ministry of Science and Innovation (MCIN/AEI/10.13039/501100011033 y FEDER, Una manera de hacer Europa) with grants PID2021-124918NB-C41, PID2021-124918NB-C42, PID2021-124918NA-C43, and PID2021-124918NB-C44; the Spanish Ministry of Science, Innovation and Universities (MCIU/AEI/FEDER, UE) with grants PGC2018-097585-B-C21 and PGC2018-097585-B-C22; the Spanish Ministry of Economy and Competitiveness (MINECO) under AYA2015-66211-C2-1-P, AYA2015-66211-C2-2, AYA2012-30789, and ICTS-2009-14; and European FEDER funding (FCDD10-4E-867, FCDD13-4E-2685). The Brazilian agencies FINEP, FAPESP, and the National Observatory of Brazil have also contributed to this project. J.M.C. was funded by the Spanish MICIN/AEI/10.13039/501100011033 and by “ERDF A way of making Europe” by the “European Union” through grants RTI2018-095076-B-C21 and PID2021-122842OB-C21, and the Institute of Cosmos Sciences University of Barcelona (ICCUB, Unidad de Excelencia ‘María de Maeztu’) through grant CEX2019-000918-M. J.V. acknowledges the technical members of the UPAD for their invaluable work: Juan Castillo, Tamara Civera, Javier Hernandez, Ángel López, Alberto Moreno, and David Muniesa. P.-E.T. has received funding from the European Research Council under the European Union’s Horizon 2020 research and innovation programmes n. 677706 (WD3D) and n. 101002408 (MOS100PC). P.C. acknowledges support from Fundação de Amparo à Pesquisa do Estado de São Paulo (FAPESP 21/08813-7) and Conselho Nacional de Desenvolvimento Científico e Tecnológico (CNPq 310555/2021-3). A.E., A.d.P., H.D.S., and J.A.F.O. acknowledge the financial support from the Spanish Ministry of Science and Innovation and the European Union – NextGenerationEU through the Recovery and Resilience Facility project ICTS-MRR-2021-03-CEFCA. F.J.E. acknowledges financial support by ESA (SoW SCI-OO-SOW-00371). This work has made use of data from the European Space Agency (ESA) mission Gaia (https://www.cosmos.esa.int/gaia), processed by the Gaia Data Processing and Analysis Consortium (DPAC, https://www.cosmos.esa.int/web/gaia/dpac/consortium). Funding for the DPAC has been provided by national institutions, in particular the institutions participating in the Gaia Multilateral Agreement. This job has made use of the Python package GaiaXPy, developed and maintained by members of the Gaia Data Processing and Analysis Consortium (DPAC), and in particular, Coordination Unit 5 (CU5), and the Data Processing Centre located at the Institute of Astronomy, Cambridge, UK (DPCI). The Pan-STARRS1 Surveys (PS1) and the PS1 public science archive have been made possible through contributions by the Institute for Astronomy, the University of Hawaii, the Pan-STARRS Project Office, the Max-Planck Society and its participating institutes, the Max Planck Institute for Astronomy, Heidelberg, and the Max Planck Institute for Extraterrestrial Physics, Garching, The Johns Hopkins University, Durham University, the University of Edinburgh, the Queen’s University Belfast, the Harvard-Smithsonian Center for Astrophysics, the Las Cumbres Observatory Global Telescope Network Incorporated, the National Central University of Taiwan, the Space Telescope Science Institute, the National Aeronautics and Space Administration under Grant No. NNX08AR22G issued through the Planetary Science Division of the NASA Science Mission Directorate, the National Science Foundation Grant No. AST-1238877, the University of Maryland, Eotvos Lorand University (ELTE), the Los Alamos National Laboratory, and the Gordon and Betty Moore Foundation. Guoshoujing Telescope (the Large Sky Area Multi-Object Fiber Spectroscopic Telescope LAMOST) is a National Major Scientific Project built by the Chinese Academy of Sciences. Funding for the project has been provided by the National Development and Reform Commission. LAMOST is operated and managed by the National Astronomical Observatories, Chinese Academy of Sciences. This research made use of Astropy, a community-developed core python package for Astronomy (Astropy Collaboration 2013), Matplotlib, a 2D graphics package used for publication-quality image generation across user interfaces and operating systems (Hunter 2007), and skyproj, a package to create full-sky projections of the data. The manuscript has been managed with Overleaf (https://www.overleaf.com).
Appendix A: Magnitude and color transformations
The original and corrected residuals between Gaia BP/RP synthetic photometry and J-PLUS instrumental magnitudes as a function of G magnitude and GBP − GRP color for the J-PLUS passbands J0378, J0395, J0410, J0430, 𝑔, J0660, i, J0861, and z are presented in Figs. A.1 and A.2.
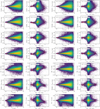 |
Fig. A.1 Residuals between the synthetic photometry from Gaia BP/RP spectra and J-PLUS photometry in the J0378, J0395, J0410, J0430, 𝑔, J0660, and i passbands (from top to bottom). The panels, from left to right, show the residuals as a function of the G magnitude and the GBP − GRP color without the transformation terms |


Appendix B: Residuals as a function of the CCD position
The median residuals between the synthetic photometry from Gaia BP/RP spectra and J-PLUS photometry as a function of the (X, Y) position of the source on the CCD with and without the plane correction for the J-PLUS passbands u, J0378, J0395, J0410, J0430, 𝑔, J0515, J0660, i, J0861, and z are presented in Fig. B.1.
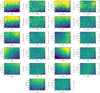 |
Fig. B.1 Similar to Fig. 10 but for 𝒳 = u, J0378, J0395, J0410, J0430, 𝑔, J0515, J0660, i, J0861, and z passbands. |
Appendix C: White dwarf locus models
The results for the joint Bayesian modeling of the white dwarf locus presented in Sec. 3.3 are shown in Fig. C.1.
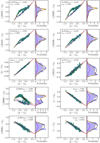 |
Fig. C.1 Similar to Fig. 11 but for 𝒳 = J0378, J0395, J0410, J0430, 𝑔, J0515, J0660, i, J0861, and z passbands. We omit the (𝑔 − i)G projection because it is shared by all the panels. |
References
- Astropy Collaboration (Robitaille, T. P., et al.) 2013, A&A, 558, A33 [NASA ADS] [CrossRef] [EDP Sciences] [Google Scholar]
- Bailer-Jones, C. A. L., Rybizki, J., Fouesneau, M., Mantelet, G., & Andrae, R. 2018, AJ, 156, 58 [Google Scholar]
- Benítez, N., Dupke, R., Moles, M., et al. 2014, ArXive eprints [arXiv:1403.5237] [Google Scholar]
- Bergeron, P., Dufour, P., Fontaine, G., et al. 2019, ApJ, 876, 67 [NASA ADS] [CrossRef] [Google Scholar]
- Bertin, E., & Arnouts, S. 1996, A&AS, 117, 393 [NASA ADS] [CrossRef] [EDP Sciences] [Google Scholar]
- Bohlin, R. C. 2000, AJ, 120, 437 [NASA ADS] [CrossRef] [Google Scholar]
- Bohlin, R. C., Gordon, K. D., & Tremblay, P. E. 2014, PASP, 126, 711 [NASA ADS] [Google Scholar]
- Bohlin, R. C., Hubeny, I., & Rauch, T. 2020, AJ, 160, 21 [Google Scholar]
- Bonoli, S., Marín-Franch, A., Varela, J., et al. 2021, A&A, 653, A31 [NASA ADS] [CrossRef] [EDP Sciences] [Google Scholar]
- Burke, D. L., Rykoff, E. S., Allam, S., et al. 2018, AJ, 155, 41 [NASA ADS] [CrossRef] [Google Scholar]
- Carrasco, J. M., Weiler, M., Jordi, C., et al. 2021, A&A, 652, A86 [NASA ADS] [CrossRef] [EDP Sciences] [Google Scholar]
- Cenarro, A. J., Moles, M., Marín-Franch, A., et al. 2014, Proc. SPIE, 9149, 91491I [Google Scholar]
- Cenarro, A. J., Moles, M., Cristóbal-Hornillos, D., et al. 2019, A&A, 622, A176 [NASA ADS] [CrossRef] [EDP Sciences] [Google Scholar]
- Chambers, K. C., Magnier, E. A., Metcalfe, N., et al. 2016, ArXiv eprints [arXiv:1612.05560] [Google Scholar]
- Covey, K. R., Ivezic, Ž., Schlegel, D., et al. 2007, AJ, 134, 2398 [NASA ADS] [CrossRef] [Google Scholar]
- Cui, X.-Q., Zhao, Y.-H., Chu, Y.-Q., et al. 2012, Res. Astron. Astrophys., 12, 1197 [Google Scholar]
- Cukanovaite, E., Tremblay, P. E., Freytag, B., Ludwig, H. G., & Bergeron, P. 2018, MNRAS, 481, 1522 [NASA ADS] [CrossRef] [Google Scholar]
- Danielski, C., Babusiaux, C., Ruiz-Dern, L., Sartoretti, P., & Arenou, F. 2018, A&A, 614, A19 [NASA ADS] [CrossRef] [EDP Sciences] [Google Scholar]
- De Angeli, F., Weiler, M., Montegriffo, P., et al. 2023, A&A, 674, A2 [NASA ADS] [CrossRef] [EDP Sciences] [Google Scholar]
- Evans, D. W., Riello, M., De Angeli, F., et al. 2018, A&A, 616, A4 [NASA ADS] [CrossRef] [EDP Sciences] [Google Scholar]
- Finkbeiner, D. P., Schlafly, E. F., Schlegel, D. J., et al. 2016, ApJ, 822, 66 [Google Scholar]
- Flewelling, H. A., Magnier, E. A., Chambers, K. C., et al. 2020, ApJS, 251, 7 [NASA ADS] [CrossRef] [Google Scholar]
- Foreman-Mackey, D., Hogg, D. W., Lang, D., & Goodman, J. 2013, PASP, 125, 306 [Google Scholar]
- Gaia Collaboration (Prusti, T., et al.) 2016, A&A, 595, A1 [NASA ADS] [CrossRef] [EDP Sciences] [Google Scholar]
- Gaia Collaboration (Montegriffo, P., et al.) 2023a, A&A, 674, A33 [CrossRef] [EDP Sciences] [Google Scholar]
- Gaia Collaboration (Vallenari, A., et al.) 2023b, A&A, 674, A1 [NASA ADS] [CrossRef] [EDP Sciences] [Google Scholar]
- Gentile Fusillo, N. P., Tremblay, P.-E., Gänsicke, B. T., et al. 2019, MNRAS, 482, 4570 [Google Scholar]
- Gentile Fusillo, N. P., Tremblay, P.-E., Bohlin, R. C., Deustua, S. E., & Kalirai, J. S. 2020, MNRAS, 491, 3613 [NASA ADS] [CrossRef] [Google Scholar]
- High, F. W., Stubbs, C. W., Rest, A., Stalder, B., & Challis, P. 2009, AJ, 138, 110 [NASA ADS] [CrossRef] [Google Scholar]
- Holberg, J. B., & Bergeron, P. 2006, AJ, 132, 1221 [Google Scholar]
- Huang, B., & Yuan, H. 2022, ApJS, 259, 26 [NASA ADS] [CrossRef] [Google Scholar]
- Huang, Y., Yuan, H., Li, C., et al. 2021, ApJ, 907, 68 [NASA ADS] [CrossRef] [Google Scholar]
- Hunter, J. D. 2007, Comput. Sci. Eng., 9, 90 [NASA ADS] [CrossRef] [Google Scholar]
- Ibata, R. A., McConnachie, A., Cuillandre, J.-C., et al. 2017, ApJ, 848, 128 [Google Scholar]
- Ivezić, Ž., Smith, J. A., Miknaitis, G., et al. 2007, AJ, 134, 973 [Google Scholar]
- Kelly, P. L., von der Linden, A., Applegate, D. E., et al. 2014, MNRAS, 439, 28 [NASA ADS] [CrossRef] [Google Scholar]
- Lallement, R., Welsh, B. Y., Vergely, J. L., Crifo, F., & Sfeir, D. 2003, A&A, 411, 447 [EDP Sciences] [Google Scholar]
- Li, L., Shen, S., Hou, J., et al. 2018, ApJ, 858, 75 [NASA ADS] [CrossRef] [Google Scholar]
- López-Sanjuan, C., Varela, J., Cristóbal-Hornillos, D., et al. 2019, A&A, 631, A119 [Google Scholar]
- López-Sanjuan, C., Yuan, H., Vázquez Ramió, H., et al. 2021, A&A, 654, A61 [NASA ADS] [CrossRef] [EDP Sciences] [Google Scholar]
- López-Sanjuan, C., Tremblay, P. E., Ederoclite, A., et al. 2022, A&A, 658, A79 [NASA ADS] [CrossRef] [EDP Sciences] [Google Scholar]
- Lucke, P. B. 1978, A&A, 64, 367 [NASA ADS] [Google Scholar]
- Magnier, E. A., Chambers, K. C., Flewelling, H. A., et al. 2020a, ApJS, 251, 3 [NASA ADS] [CrossRef] [Google Scholar]
- Magnier, E. A., Schlafly, E. F., Finkbeiner, D. P., et al. 2020b, ApJS, 251, 6 [NASA ADS] [CrossRef] [Google Scholar]
- Magnier, E. A., Sweeney, W. E., Chambers, K. C., et al. 2020c, ApJS, 251, 5 [NASA ADS] [CrossRef] [Google Scholar]
- Marín-Franch, A., Taylor, K., Cenarro, J., Cristobal-Hornillos, D., & Moles, M. 2015, IAU General Assembly, 29, 2257381 [Google Scholar]
- Mendes de Oliveira, C., Ribeiro, T., Schoenell, W., et al. 2019, MNRAS, 489, 241 [NASA ADS] [CrossRef] [Google Scholar]
- Montegriffo, P., De Angeli, F., Andrae, R., et al. 2023, A&A, 674, A3 [NASA ADS] [CrossRef] [EDP Sciences] [Google Scholar]
- Narayan, G., Axelrod, T., Holberg, J. B., et al. 2016, ApJ, 822, 67 [NASA ADS] [CrossRef] [Google Scholar]
- Narayan, G., Matheson, T., Saha, A., et al. 2019, ApJS, 241, 20 [NASA ADS] [CrossRef] [Google Scholar]
- Niu, Z., Yuan, H., & Liu, J. 2021a, ApJ, 908, L14 [NASA ADS] [CrossRef] [Google Scholar]
- Niu, Z., Yuan, H., & Liu, J. 2021b, ApJ, 909, 48 [NASA ADS] [CrossRef] [Google Scholar]
- Oke, J. B., & Gunn, J. E. 1983, ApJ, 266, 713 [NASA ADS] [CrossRef] [Google Scholar]
- Padmanabhan, N., Schlegel, D. J., Finkbeiner, D. P., et al. 2008, ApJ, 674, 1217 [NASA ADS] [CrossRef] [Google Scholar]
- Pancino, E., Altavilla, G., Marinoni, S., et al. 2012, MNRAS, 426, 1767 [Google Scholar]
- Pancino, E., Sanna, N., Altavilla, G., et al. 2021, MNRAS, 503, 3660 [Google Scholar]
- Regnault, N., Conley, A., Guy, J., et al. 2009, A&A, 506, 999 [NASA ADS] [CrossRef] [EDP Sciences] [Google Scholar]
- Riello, M., De Angeli, F., Evans, D. W., et al. 2021, A&A, 649, A3 [NASA ADS] [CrossRef] [EDP Sciences] [Google Scholar]
- Schlafly, E. F., Meisner, A. M., Stutz, A. M., et al. 2016, ApJ, 821, 78 [NASA ADS] [CrossRef] [Google Scholar]
- Schlegel, D. J., Finkbeiner, D. P., & Davis, M. 1998, ApJ, 500, 525 [Google Scholar]
- Starkenburg, E., Martin, N., Youakim, K., et al. 2017, MNRAS, 471, 2587 [NASA ADS] [CrossRef] [Google Scholar]
- Sun, Y., Yuan, H., & Chen, B. 2022, ApJS, 260, 17 [NASA ADS] [CrossRef] [Google Scholar]
- Tonry, J. L., Stubbs, C. W., Lykke, K. R., et al. 2012, ApJ, 750, 99 [Google Scholar]
- Tremblay, P. E., Ludwig, H. G., Steffen, M., & Freytag, B. 2013, A&A, 559, A 104 [NASA ADS] [CrossRef] [EDP Sciences] [Google Scholar]
- Wall, R. E., Kilic, M., Bergeron, P., et al. 2019, MNRAS, 489, 5046 [NASA ADS] [CrossRef] [Google Scholar]
- Waters, C. Z., Magnier, E. A., Price, P. A., et al. 2020, ApJS, 251, 4 [NASA ADS] [CrossRef] [Google Scholar]
- Wittman, D., Ryan, R., & Thorman, P. 2012, MNRAS, 421, 2251 [NASA ADS] [CrossRef] [Google Scholar]
- Xiao, K., & Yuan, H. 2022, AJ, 163, 185 [Google Scholar]
- Yuan, H. B., Liu, X. W., & Xiang, M. S. 2013, MNRAS, 430, 2188 [NASA ADS] [CrossRef] [Google Scholar]
- Yuan, H., Liu, X., Xiang, M., et al. 2015, ApJ, 799, 133 [NASA ADS] [CrossRef] [Google Scholar]
- Zhang, R., & Yuan, H. 2023, ApJS, 264, 14 [NASA ADS] [CrossRef] [Google Scholar]
- Zhou, Z., Zhou, X., Zou, H., et al. 2018, PASP, 130, 085001 [NASA ADS] [CrossRef] [Google Scholar]
- Zucker, C., Goodman, A. A., Alves, J., et al. 2022, Nature, 601, 334 [NASA ADS] [CrossRef] [Google Scholar]
Column APER_COR_6_0 in the table jplus.TileImage.
The complete J-PLUS DR3 versus Gaia catalog can be found in the table jplus.xmatch_gaia_dr3 within the J-PLUSdatabase.
Stored in table jplus.MWExtinction within the J-PLUSdatabase.
We recall that in this step no reddening correction was applied to J-PLUS instrumental or Gaia synthetic magnitudes.
Variables X_IMAGE and Y_IMAGE on the J-PLUS database.
The complete J-PLUS versus PS1 catalog can be found in the table jplus.xmatch_panstarrs_dr1 within the J-PLUS database.
All Tables
Estimated error budget of the J-PLUS DR3 photometric calibration and final median zero points.
All Figures
|
Fig. 1 Updated flowchart of the calibration method used in J-PLUS DR3. Arrows that originate in small dots indicate that the preceding data product is an input to the subsequent analysis. Datasets are shown with their project logo, and external data or models are denoted with black boxes. The rounded purple boxes show the calibration steps. The asterisk indicates the step based on dust de-reddened magnitudes. The blue boxes show intermediate data products, and green ovals highlight data products of the calibration process. The main change with respect to J-PLUS DR2 calibration is the use of Gaia BP/RP low-resolution spectra in the homogenization (Sect. 3.2). |
| In the text | |
|
Fig. 2 Absolute magnitude in the G band vs. GBP − GRP color diagram, corrected for dust reddening, of the 1 898 063 high-quality sources in common between Gaia DR3 and J-PLUS DR3. The color scale presents the number density of stars per mag2, noted as ρ⋆. Three areas were defined following López-Sanjuan et al. (2019) as being dominated by main sequence stars (white area), giant branch stars (gray area), and white dwarfs (blue area). |
| In the text | |
|
Fig. 3 Full width at half maximum of the Gaia BP/RP spectra as a function of wavelength (black dashed line). The gray area marks the avoidance region corresponding to less than 1.4 times the FWHM of the BP/RP spectra. The colored dots show the FWHM of the medium and narrow passbands in J-PLUS. |
| In the text | |
|
Fig. 4 Density of main sequence calibration stars with (green) and without (blue) BP/RP spectra in Gaia DR3 after applying the recommended quality selection criteria. The solid line marks the location of the Milky Way, and the dashed lines depict b = ±10 deg. |
| In the text | |
|
Fig. 5 Histogram of J-PLUS DR3 pointings for a given number of main sequence calibration stars (nstar) with (outlined in black) and without (gray shaded) BP/RP spectra in Gaia DR3 after applying the recommended quality selection cuts. |
| In the text | |
|
Fig. 6 Residuals between the synthetic photometry from Gaia BP/RP spectra and J-PLUS photometry in the r band as a function of the G magnitude (left panels) and the GBP − GRP color (right panels) before applying the transformation terms |
| In the text | |
|
Fig. 7 Residuals between the synthetic photometry from Gaia BP/RP spectra and J-PLUS photometry in the u band, following Fig. 6. |
| In the text | |
|
Fig. 8 Residuals between the synthetic photometry from Gaia BP/RP spectra and J-PLUS photometry in the J0515 band, following Fig. 6. |
| In the text | |
|
Fig. 9 Sky distribution of the residuals between the synthetic photometry from Gaia BP/RP spectra and J-PLUS photometry in the r band without applying the plane correction Pr (top panel) and after applying it (bottom panel). The solid line marks the location of the Milky Way, and the dashed lines depict b = ±10 deg. |
| In the text | |
|
Fig. 10 Median residuals between the synthetic photometry from Gaia BP/RP spectra and J-PLUS photometry in the r band as a function of the (X, Y) position of the sources on the CCD without applying the plane correction Pr (left panel) and after applying it (right panel). |
| In the text | |
|
Fig. 11 Color-color diagram (u − r)G versus (g − i)G of the 109 high-quality white dwarfs at distance d < 100 pc in J-PLUS DR3. The solid lines show the theoretical loci for Η-dominated (orange) and He-dominated atmospheres (magenta). The gray scale shows the most probable model that describes the observations. The blue probability distributions above and to the right show the (g − i)G and (u − r)G projections of the data, respectively. The projections of the total, H-dominated, and He-dominated models are represented by the black, orange, and magenta lines. The values of the filter-dependent parameters σint and ∆χWD are indicated in the main panel. |
| In the text | |
|
Fig. 12 Zero point offset from the white dwarf locus (∆χWD) for the J-PLUS filter system. The progressively lighter gray areas show differences of 0.01, 0.02, and 0.03 mag, respectively. |
| In the text | |
|
Fig. 13 Distribution of median differences in the photometry of main sequence stars independently observed by two adjacent pointings with at least 25 sources in common. The gray filled histogram shows the results obtained with the stellar locus regression technique, and the colored histogram shows the results when using the Gaìa BP/RP low-resolution spectra as a reference. The gray and colored lines are the best Gaussian fits to the former and latest case, respectively. The precision in the calibration is labeled in the panels and was estimated as the dispersion of the fitted Gaussian divided by the square root of two. We present, from top to bottom and from left to right, the filters u, J0378, J0395, J0410, J0430, 𝑔, J0515, r, J0660, i, J0861, and z. |
| In the text | |
|
Fig. 14 Distribution of the difference between the zero points estimated with Gaia synthetic photometry (colored histograms) and the stellar locus regression technique (gray histograms) with respect to the zero points estimated with the SCR methodology. The gray and colored lines are the best Gaussian fits to the former and latest case, respectively. The accuracy in the calibration is labeled in the panels. We present, from top to bottom and from left to right, the filters u, J0378, J0395, J0410, J0430, 𝑔, J0515, r, J0660, i, J0861, and z. |
| In the text | |
|
Fig. 15 Summary of the relative precision (σcal; left panel) and accuracy (σSCR; right panel) estimated for the J-PLUS DR3 photometric calibration. Red and black symbols show the results obtained with the stellar locus technique and the BP/RP spectra from Gaia, respectively. The dotted line marks a 1% level uncertainty. |
| In the text | |
|
Fig. 16 Comparison between the J-PLUS DR3 photometry (𝒳J-PLUS; colored points) of GD 153 and its synthetic photometry (𝒳standard; black outlined circles) estimated from the standard spectra in CALSPEC (left panel) and Gaia SPSS (right panel). In both panels, the standard spectrum is shown with the black solid line. The magnitude difference ∆𝒳 = 𝒳J-PLUS − 𝒳standard is shown in the lower panels. The dotted line marks a zero difference. The progressively lighter gray areas show differences of 0.01, 0.02, and 0.03 mag, respectively. |
| In the text | |
|
Fig. A.1 Residuals between the synthetic photometry from Gaia BP/RP spectra and J-PLUS photometry in the J0378, J0395, J0410, J0430, 𝑔, J0660, and i passbands (from top to bottom). The panels, from left to right, show the residuals as a function of the G magnitude and the GBP − GRP color without the transformation terms |
| In the text | |
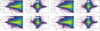 |
Fig. A.2 Residuals in the J0861 and z passbands, following Fig. A.l. |
| In the text | |
|
Fig. B.1 Similar to Fig. 10 but for 𝒳 = u, J0378, J0395, J0410, J0430, 𝑔, J0515, J0660, i, J0861, and z passbands. |
| In the text | |
|
Fig. C.1 Similar to Fig. 11 but for 𝒳 = J0378, J0395, J0410, J0430, 𝑔, J0515, J0660, i, J0861, and z passbands. We omit the (𝑔 − i)G projection because it is shared by all the panels. |
| In the text | |
Current usage metrics show cumulative count of Article Views (full-text article views including HTML views, PDF and ePub downloads, according to the available data) and Abstracts Views on Vision4Press platform.
Data correspond to usage on the plateform after 2015. The current usage metrics is available 48-96 hours after online publication and is updated daily on week days.
Initial download of the metrics may take a while.