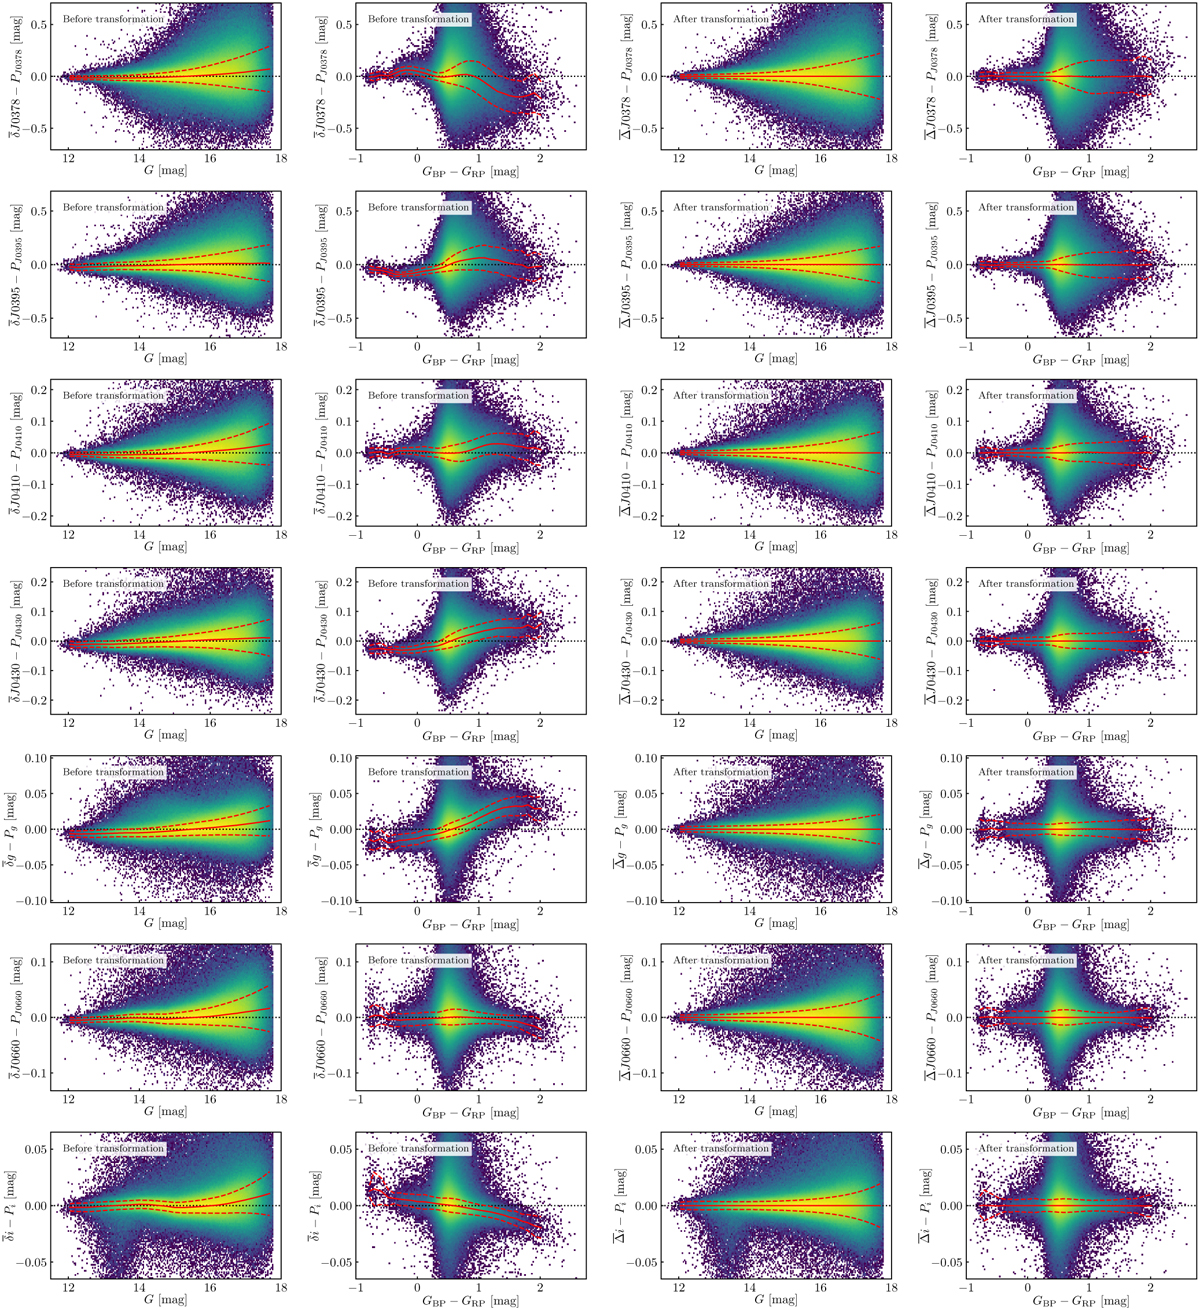
Fig. A.1
Download original image
Residuals between the synthetic photometry from Gaia BP/RP spectra and J-PLUS photometry in the J0378, J0395, J0410, J0430, 𝑔, J0660, and i passbands (from top to bottom). The panels, from left to right, show the residuals as a function of the G magnitude and the GBP − GRP color without the transformation terms ![]() and
and ![]() and as a function of the G magnitude and the GBP − GRP color after applying them. The color scale depicts the number density of sources using a logarithm scale, with nearly 1.5 million sources shown. In all the panels, the solid red line represents the median of the residuals, and the dashed lines show its one σ dispersion.
and as a function of the G magnitude and the GBP − GRP color after applying them. The color scale depicts the number density of sources using a logarithm scale, with nearly 1.5 million sources shown. In all the panels, the solid red line represents the median of the residuals, and the dashed lines show its one σ dispersion.
Current usage metrics show cumulative count of Article Views (full-text article views including HTML views, PDF and ePub downloads, according to the available data) and Abstracts Views on Vision4Press platform.
Data correspond to usage on the plateform after 2015. The current usage metrics is available 48-96 hours after online publication and is updated daily on week days.
Initial download of the metrics may take a while.