Fig. 11
Download original image
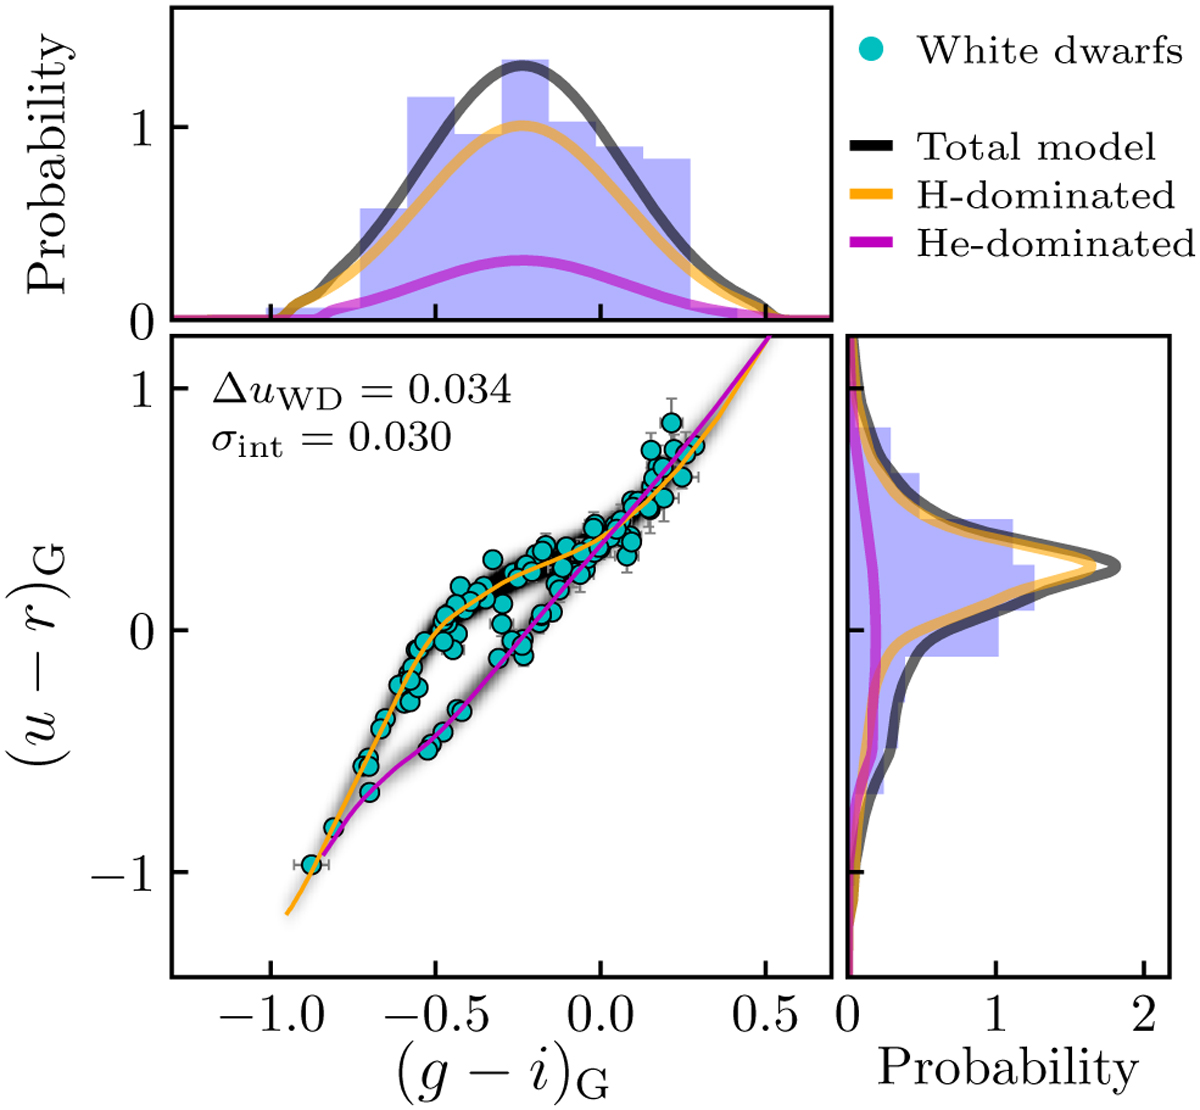
Color-color diagram (u − r)G versus (g − i)G of the 109 high-quality white dwarfs at distance d < 100 pc in J-PLUS DR3. The solid lines show the theoretical loci for Η-dominated (orange) and He-dominated atmospheres (magenta). The gray scale shows the most probable model that describes the observations. The blue probability distributions above and to the right show the (g − i)G and (u − r)G projections of the data, respectively. The projections of the total, H-dominated, and He-dominated models are represented by the black, orange, and magenta lines. The values of the filter-dependent parameters σint and ∆χWD are indicated in the main panel.
Current usage metrics show cumulative count of Article Views (full-text article views including HTML views, PDF and ePub downloads, according to the available data) and Abstracts Views on Vision4Press platform.
Data correspond to usage on the plateform after 2015. The current usage metrics is available 48-96 hours after online publication and is updated daily on week days.
Initial download of the metrics may take a while.