Fig. 14
Download original image
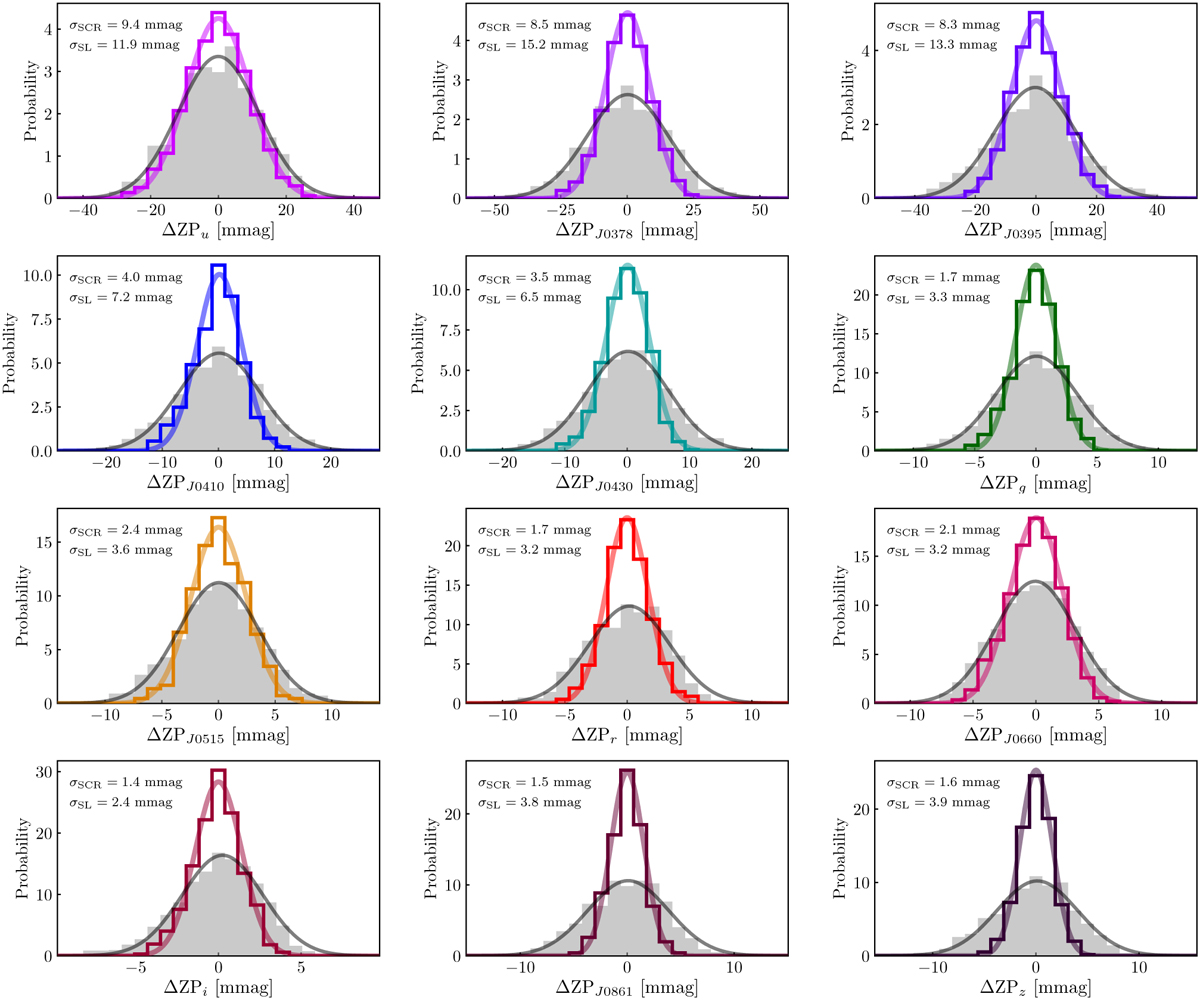
Distribution of the difference between the zero points estimated with Gaia synthetic photometry (colored histograms) and the stellar locus regression technique (gray histograms) with respect to the zero points estimated with the SCR methodology. The gray and colored lines are the best Gaussian fits to the former and latest case, respectively. The accuracy in the calibration is labeled in the panels. We present, from top to bottom and from left to right, the filters u, J0378, J0395, J0410, J0430, 𝑔, J0515, r, J0660, i, J0861, and z.
Current usage metrics show cumulative count of Article Views (full-text article views including HTML views, PDF and ePub downloads, according to the available data) and Abstracts Views on Vision4Press platform.
Data correspond to usage on the plateform after 2015. The current usage metrics is available 48-96 hours after online publication and is updated daily on week days.
Initial download of the metrics may take a while.