Fig. 16
Download original image
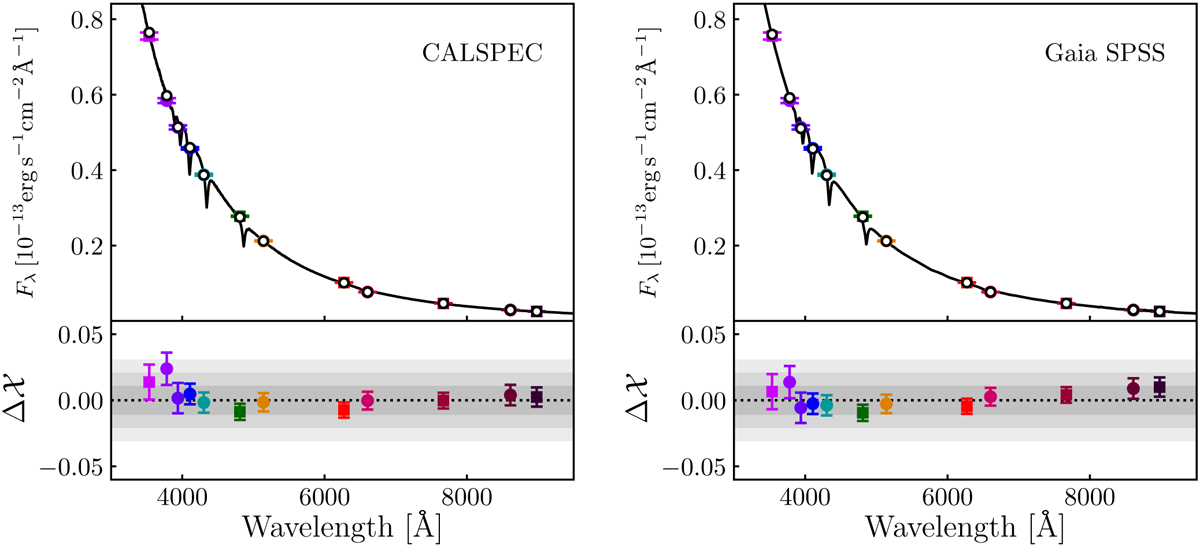
Comparison between the J-PLUS DR3 photometry (𝒳J-PLUS; colored points) of GD 153 and its synthetic photometry (𝒳standard; black outlined circles) estimated from the standard spectra in CALSPEC (left panel) and Gaia SPSS (right panel). In both panels, the standard spectrum is shown with the black solid line. The magnitude difference ∆𝒳 = 𝒳J-PLUS − 𝒳standard is shown in the lower panels. The dotted line marks a zero difference. The progressively lighter gray areas show differences of 0.01, 0.02, and 0.03 mag, respectively.
Current usage metrics show cumulative count of Article Views (full-text article views including HTML views, PDF and ePub downloads, according to the available data) and Abstracts Views on Vision4Press platform.
Data correspond to usage on the plateform after 2015. The current usage metrics is available 48-96 hours after online publication and is updated daily on week days.
Initial download of the metrics may take a while.