Fig. 13
Download original image
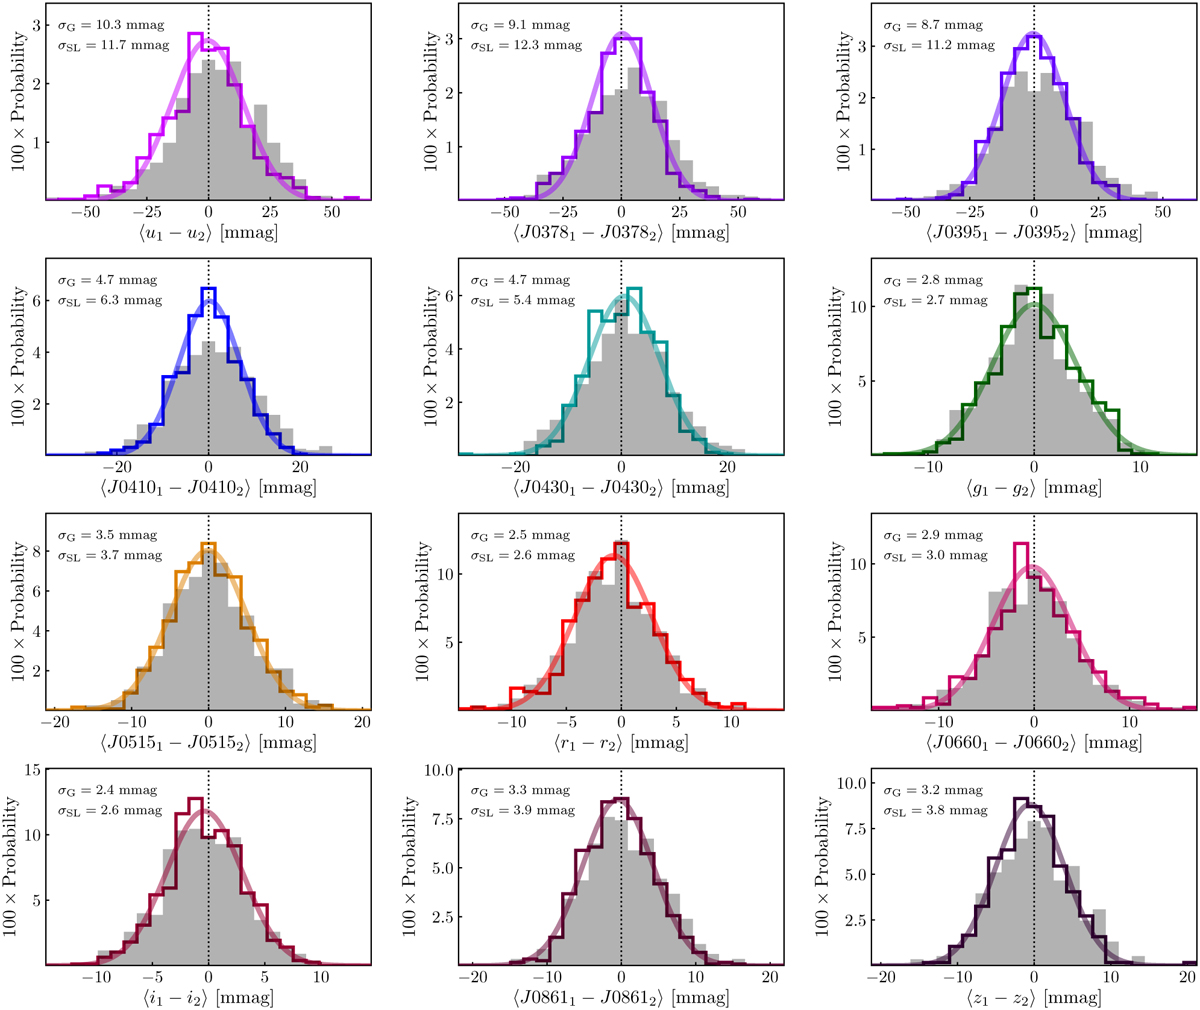
Distribution of median differences in the photometry of main sequence stars independently observed by two adjacent pointings with at least 25 sources in common. The gray filled histogram shows the results obtained with the stellar locus regression technique, and the colored histogram shows the results when using the Gaìa BP/RP low-resolution spectra as a reference. The gray and colored lines are the best Gaussian fits to the former and latest case, respectively. The precision in the calibration is labeled in the panels and was estimated as the dispersion of the fitted Gaussian divided by the square root of two. We present, from top to bottom and from left to right, the filters u, J0378, J0395, J0410, J0430, 𝑔, J0515, r, J0660, i, J0861, and z.
Current usage metrics show cumulative count of Article Views (full-text article views including HTML views, PDF and ePub downloads, according to the available data) and Abstracts Views on Vision4Press platform.
Data correspond to usage on the plateform after 2015. The current usage metrics is available 48-96 hours after online publication and is updated daily on week days.
Initial download of the metrics may take a while.