Fig. 2
Download original image
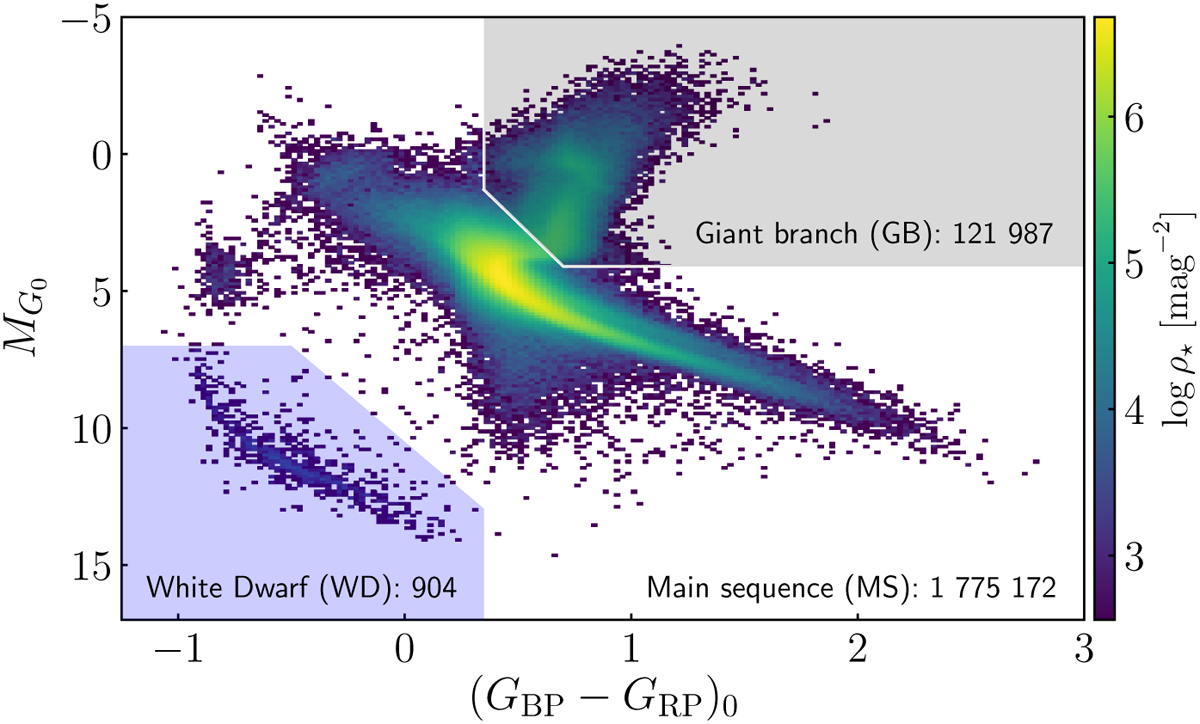
Absolute magnitude in the G band vs. GBP − GRP color diagram, corrected for dust reddening, of the 1 898 063 high-quality sources in common between Gaia DR3 and J-PLUS DR3. The color scale presents the number density of stars per mag2, noted as ρ⋆. Three areas were defined following López-Sanjuan et al. (2019) as being dominated by main sequence stars (white area), giant branch stars (gray area), and white dwarfs (blue area).
Current usage metrics show cumulative count of Article Views (full-text article views including HTML views, PDF and ePub downloads, according to the available data) and Abstracts Views on Vision4Press platform.
Data correspond to usage on the plateform after 2015. The current usage metrics is available 48-96 hours after online publication and is updated daily on week days.
Initial download of the metrics may take a while.