| Issue |
A&A
Volume 682, February 2024
|
|
|---|---|---|
| Article Number | A32 | |
| Number of page(s) | 12 | |
| Section | Planets and planetary systems | |
| DOI | https://doi.org/10.1051/0004-6361/202348271 | |
| Published online | 02 February 2024 | |
Grain-size measurements in protoplanetary disks indicate fragile pebbles and low turbulence
1
European Southern Observatory,
Karl-Schwarzschild-Str 2,
85748
Garching,
Germany
e-mail: This email address is being protected from spambots. You need JavaScript enabled to view it.
2
Department of Astronomy, Tsinghua University,
30 Shuangqing Rd, Haidian DS
100084,
Beijing,
PR China
3
Leiden Observatory, Leiden University,
PO Box 9513,
2300 RA
Leiden,
The Netherlands
4
Instituto de Radioastronomía y Astrofísica (IRyA), Universidad Nacional Autónoma de México (UNAM),
Mexico
Received:
13
October
2023
Accepted:
14
November
2023
Abstract
Context. Constraining the turbulence level and pebble size in protoplanetary disks is an essential initial step in understanding the aerodynamic properties of pebbles, which are crucial for planet formation. Recent laboratory experiments have revealed that destructive collisions of icy dust particles may occur at much lower velocities than previously believed. These low fragmentation velocities push down the maximum grain size in collisional growth models.
Aims. Motivated by the smooth radial distribution of pebble sizes inferred from ALMA/VLA multi-wavelength continuum analysis, we propose a concise model to explain this feature and aim to constrain the turbulence level at the midplane of protoplanetary disks.
Methods. Our approach is built on the assumption that the fragmentation threshold is the primary barrier limiting pebble growth within pressure maxima. Consequently, the grain size at the ring location can provide direct insights into the turbulent velocity governing pebble collisions and, by extension, the turbulence level at the disk midplane. We validate this method using the Dustpy code, which simulates dust transport and coagulation.
Results. We applied our method to seven disks, namely TW Hya, IM Lup, GM Aur, AS 209, HL Tau, HD 163296, and MWC 480, for which grain sizes have been measured from multi-wavelength continuum analysis. A common feature emerges from our analysis, with an overall low turbulence coefficient of α ~ 10−4 observed in five out of seven disks when assuming a fragmentation velocity υfrag = 1 m s−1. A higher fragmentation velocity would imply a significantly larger turbulence coefficient than that suggested by current observational constraints. IM Lup stands out, with a relatively high coefficient of 10−3. Notably, HL Tau exhibits an increasing trend in α with distance. This supports enhanced turbulence at its outer disk region, which is possibly associated with the infalling streamer onto this particular disk. Alternatively, if the turbulence were found to be low, this might indicate that grain sizes have not reached the growth barrier.
Conclusions. We conclude that the current (sub)mm pebble size constrained in disks implies low levels of turbulence; it also implies fragile pebbles, which is consistent with recent laboratory measurements.
Key words: submillimeter: planetary systems / planets and satellites: formation / submillimeter: general / stars: pre-main sequence / protoplanetary disks
© The Authors 2024
 Open Access article, published by EDP Sciences, under the terms of the Creative Commons Attribution License (https://creativecommons.org/licenses/by/4.0), which permits unrestricted use, distribution, and reproduction in any medium, provided the original work is properly cited.
This article is published in open access under the Subscribe to Open model. This email address is being protected from spambots. You need JavaScript enabled to view it. to support open access publication.
1 Introduction
Millimetre (mm) and submillimetre (submm) size dust particles, commonly referred to as pebbles, are the basic building blocks of planets. Understanding the process of planet formation requires detailed knowledge of the properties of pebbles pebble properties, their coagulation growth, and their aerodynamics.
In protoplanetary disks, the rotation of gas deviates from Keplerian velocities in the disk because of pressure support; pebbles are therefore dragged by the gas, changing their angular momentum, which leads to radial drift (Weidenschilling 1977). As the gas is viscous in the protoplanetary disk, the pebbles in the disk also diffuse along with turbulent gas mixing (e.g., Ormel & Cuzzi 2007; Youdin & Lithwick 2007). These effects all depend on pebble size, which evolves depending on the balance between sticking collisions, fragmentation (e.g., Brauer et al. 2008; Birnstiel et al. 2010), bouncing (e.g., Zsom et al. 2010; Windmark et al. 2012) and pebble radial drift (e.g., Birnstiel et al. 2012).
Thanks to the development of advanced radio facilities, such as the Atacama Large Millimeter/submillimeter Array (ALMA) and the Karl G. Jansky Very Large Array (VLA), we are now in an era where pebble properties can be characterized by their thermal emission continuum on an astronomical unit (au) scale. Multi-wavelength observations can be used to infer the maximum size and size distribution of pebbles (e.g., Carrasco-González et al. 2019; Macías et al. 2019, 2021; Sierra et al. 2021; Guidi et al. 2022). This method capitalizes on the connection between the frequency dependence of dust opacity and the particle size distribution. In the optically thin regime, this relationship is relatively straightforward within the Rayleigh-Jeans regime: the spectral index of mm and submm dust emission aligns with 2 + β, where β signifies the spectral index of dust opacity (Beckwith et al. 1990). Smaller values of β indicate the presence of larger dust particles (Miyake & Nakagawa 1993; D’Alessio et al. 2001). In addition, ALMA is also revolutionizing our view of the gas disk, mostly thanks to the high-resolution and high-sensitivity observation of CO isotopologues (e.g., Zhang et al. 2019, 2021; Booth & Ilee 2020; Calahan et al. 2021; Miotello et al. 2023, and reference therein). Based on the pebble sizes ap and surface densities Σg inferred from ALMA observations, the so-called Stokes parameter in the Epstein regime quantifies the aerodynamic coupling between gas and dust, and can be expressed as
 (1)
(1)
where ρ• is the internal density of pebbles.
At the same time, laboratory experiments provide us with different insights into pebble properties, particularly regarding pebble collision (see the recent review of Wurm & Teiser 2021). Historically, collision experiments involving small micrometer-sized water ice grains have demonstrated sticking behavior even at velocities of 10 m s−1, whereas silicates typically exhibit sticking behavior at 1 m s−1 (e.g., Poppe et al. 2000; Blum & Wurm 2008). Additionally, simulations conducted by Dominik & Tielens (1997) indicated that ice aggregates possess greater stability than silicate aggregates. However, recently, it has been proposed that water ice exhibits reduced stickiness at lower temperatures (Gundlach et al. 2018). In laboratory experiments, the surface energy of water ice remains relatively high between the freezing point of water (273 K) and 200 K (Gundlach et al. 2011; Aumatell & Wurm 2014). However, the surface energy drops by two orders of magnitude below 200 K, which is closer to the range of temperatures found in the outer region of protoplanetary disks (Musiolik & Wurm 2019). How the condensation of other molecules on the pebble surface might change the collision properties also remains unclear (Homma et al. 2019; Bischoff et al. 2020). While CO2, one of the prevalent ices in protoplanetary disks, has been investigated in collision experiments, it has been shown to be as or less adhesive than water ice or silicates (Musiolik et al. 2016a).
Another disk property that is crucial to our understanding of dust evolution and planet formation is the magnitude of gas turbulence, and therefore of dust diffusivity. The turbulence partly sets the relative velocity among pebbles (Ormel & Cuzzi 2007), which directly decides their collision outcomes (Güttler et al. 2010; Zsom et al. 2010, 2011). There have been various attempts to measure the gas viscosity and/or dust diffusivity in protoplanetary disks using different observables: the disk vertical extent in ALMA continuum as a proxy for dust settling (e.g., Pinte et al. 2016; Villenave et al. 2020); the balance between dust ring width and pressure gradient support (e.g., Dullemond et al. 2018; Rosotti et al. 2020); non-thermal broadening of emission lines (e.g., Teague et al. 2018; Flaherty et al. 2020). Other authors tried to use the disk evolution constraints set by demographic studies for this purpose (see the recent reviews by Miotello et al. 2023 and Rosotti 2023). Multiple lines of evidence suggest that disks are in fact not as turbulent as the previously assumed value of α = 10−2 (Rosotti 2023).
In this paper, we propose that the pebble sizes inferred from multi-wavelength observations can be used to put constraints on the diffusivity and fragmentation velocity of dust particles. First, we briefly discuss the benchmark test model we run with the newly developed Dustpy code (Stammler & Birnstiel 2022) and explain the rationale behind its use in this context. We then apply our proposed new method to seven previously analyzed protoplanetary disks, finding values of dust diffusivity that are consistent with previous estimates of disk turbulence, as long as the fragmentation velocity is low even when coated by water ice.
2 Model
To examine the impact of diffusivity and fragmentation velocity on grain growth within the pebble ring, we employ the open-source code DustPy1 (Stammler & Birnstiel 2022) to model dust coagulation and transport in protoplanetary disks. This code concurrently addresses the Smoluchowski coagulation equation (Smoluchowski 1916) along with dust particle transport within the disk. Dust particles undergo collisions and are transported by various mechanisms, including thermal Brownian motion, vertical stirring and settling, turbulent mixing, and azimuthal and radial drift. The code considers all these velocities when calculating relative velocities prior to collision. Our simulations incorporate various disk parameters, resulting in limitations on dust growth either due to drifting or fragmentation at the output snapshots.
2.1 Disk model
We initialize the gas density following the similarity solution of Lynden-Bell & Pringle (1974):
![Mathematical equation: ${\Sigma _{\rm{g}}} = {\Sigma _{{\rm{g}},0}}{\left( {{r \over {{r_{\rm{c}}}}}} \right)^{ - \gamma }}\exp \left[ { - {{\left( {{r \over {{r_{\rm{c}}}}}} \right)}^{2 - \gamma }}} \right]$](/articles/aa/full_html/2024/02/aa48271-23/aa48271-23-eq2.png) (2)
(2)
where r is the distance from the star, γ = 1, and a characteristic radius of rc = 100 au is used throughout this work. The gas surface densities evolve with the master equation of viscous accretion disk (Lynden-Bell & Pringle 1974):
![Mathematical equation: ${{\partial {\Sigma _{\rm{g}}}} \over {\partial t}} = - {1 \over r}{\partial \over {\partial r}}\left( {{\Sigma _{\rm{g}}}r{\upsilon _{\rm{g}}}} \right) \equiv {3 \over r}{\partial \over {\partial r}}\left[ {{1 \over {r{\Omega _{\rm{K}}}}}{\partial \over {\partial r}}\left( {{\alpha _\upsilon }{\Sigma _{\rm{g}}}{r^2}c_{\rm{s}}^2} \right)} \right]$](/articles/aa/full_html/2024/02/aa48271-23/aa48271-23-eq3.png) (3)
(3)
where  is the Keplerian orbital frequency around the star with a mass of M★, αυ is the turbulent viscosity coefficient defined by the Shakura & Sunyaev (1973) prescription, and cs is the sound speed. The disk is assumed to be locally isothermal, with the disk temperature following:
 (4)
(4)
We take T0 = 20 K and q = 0.45, with which, the aspect ratio of gas disk follows
 (5)
(5)
where h0 = 0.075 is the aspect ratio at rc.
The dust surface evolution is solved by the advection-diffusion equation (Birnstiel et al. 2010)
![Mathematical equation: ${{\partial {\Sigma _{\rm{d}}}} \over {\partial t}} + {1 \over r}{\partial \over {\partial r}}\left( {{\Sigma _{\rm{d}}}r{\upsilon _{\rm{d}}}} \right) - {1 \over r}{\partial \over {\partial r}}\left[ {r{\Sigma _{\rm{g}}}{D_{\rm{d}}}{\partial \over {\partial r}}\left( {{{{\Sigma _{\rm{d}}}} \over {{\Sigma _{\rm{g}}}}}} \right)} \right] = 0$](/articles/aa/full_html/2024/02/aa48271-23/aa48271-23-eq7.png) (6)
(6)
with the dust diffusivity Dd = αυcsh/(1 + St2) (Youdin & Lithwick 2007) and the dust radial velocity (Nakagawa et al. 1986)
 (7)
(7)
where the dimensionless pressure gradient coefficiency reads
 (8)
(8)
in which P is the midplane gas pressure.
We also test the case where pebbles are trapped inside pressure maxima at distant radii. Following Dullemond et al. (2018), we modify the gas viscosity
 (9)
(9)
where
![Mathematical equation: $F(r) = \exp \left[ { - A\exp \left( { - {{{{\left( {r - {r_0}} \right)}^2}} \over {2{w^2}}}} \right)} \right]$](/articles/aa/full_html/2024/02/aa48271-23/aa48271-23-eq11.png) (10)
(10)
We insert two separate viscosity gaps at r0 = 40 and 90 au, with gap widths of w = 4 and 9 au, respectively. We take the gap depth amplitude A = 1 as the default value but try A = 0.5 and 2 for parameter studies in Appendix A.
The grain growth is mainly limited by two barriers (Birnstiel et al. 2010). The fragmentation barrier of pebble growth when the relative velocity is dominated by turbulent velocity (Ormel & Cuzzi 2007) reads as:
 (11)
(11)
where δt is the dust turbulent velocity coefficient, whose value is equal to αυ throughout the main text of the present paper. Also, the drifting barrier, which balances the drifting timescale and the coagulation timescale, is (e.g., Birnstiel et al. 2012):
 (12)
(12)
where the barrier is proportional to the local dust-to-gas surface density ratio ϵ = Σd/Σg, and inversely proportional to the dimensionless pressure gradient coefficiency η (Eq. (8)).
Summary of disk parameters used in this work and references.
2.2 Benchmark simulations
As a main result, we test the case in which the disk has low viscosity αυ and low dust diffusivity δt.
In the traditional picture, where the icy pebbles are sticky, the fragmentation velocity exterior to the water snowline is expected to be 10 m s−1. In such a case, grain size is mainly controlled by the radial drift of the pebbles. As shown in Fig. 1a, when the fragmentation velocity is relatively high while the dust turbulent velocity is low, the regions of the disk with a smooth pressure gradient cannot host pebbles larger than 1 mm. However, at the location of pressure maximum, the pebbles follow the pressure gradient and are trapped at a specific location, where the radial drift stops. As a result, the so-called drifting barrier no longer limits the pebble growth, and therefore pebbles can significantly hit and stick, growing to >10 cm size.
As the most recent laboratory results suggest, the pebbles can in turn be very fragile in the outer region of the disk, especially when they are exterior to the CO2 snowline. By varying the fragmentation velocities of the pebbles, we test how their fragile nature will influence their size distribution in the protoplanetary disks.
In Fig. 1b, with the fragmentation velocity υfrag reduced from 10 to 3 m s−1, the fragmentation barrier decreases by one order of magnitude (the green line in the upper panel). In contrast, the drifting barrier does not significantly change as it is independent of the collisional properties of the pebble. Therefore, even though the fragmentation velocity is lower, the particle size still reaches 1 mm in the disk region where the density and/or pressure gradient is smooth. At the ring location, where the radial drift is limited, pebbles can now only grow to approximately centimeter size inside the ring with the low fragmentation barrier.
Further decreasing the fragmentation velocity will result in an even lower fragmentation barrier, which is eventually lower than the nominal drifting barrier in the simulation with υfrag = 1 m s−1. In this run, the fragmentation barrier is lower than the drifting barrier in almost the entire disk. As shown in Fig. 1c, the maximum pebble size is constant over the entire disk.
Interestingly, recent analyses of multi-wavelength observations in several disks have revealed flat radial profiles of the maximum grain size. In particular, Sierra et al. (2021) reported an almost constant radial profile of maximum grain size across the B49 continuum ring in HD 163296, and found no signal of localized pebble growth. This trend is further confirmed by Guidi et al. (2022), who suggests that the radial profile of pebble size is smooth over the entire disk, even at the B100 continuum ring. This result is approximately consistent with the result we obtain from our low turbulence, low fragmentation velocity simulation (Fig. 1c).
Therefore, using the fact that most of the disk shows a smooth maximum grain size profile, we can, in turn, constrain the diffusivity level of the pebble disk by assuming that the maximum pebble size αmax is set by the fragmentation barrier; that is, by assuming St = Stfrag, we may obtain the δt in Eq. (11) following:
 (13)
(13)
a simple formula where both St and cs can be measured from multi-wavelength continuum analysis.
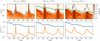 |
Fig. 1 Simulation outputs at t = 1 Myr for runs with different fragmentation velocities υfrag = 10, 3, and 1 m s−1 (from left to right). The dust diffusivities are set to be 1−4 for all three runs. In the upper panels, the gray lines mark the drifting barrier, while the green lines mark the fragmentation barrier in each simulation. The orange contours represent the dust densities at each grain size. The lower panels display the radial profiles of gas (blue) and dust (orange) total column densities. In cases of high fragmentation velocity, particle size increases significantly at the ring location. Yet, for fragile dust (υfrag = 1m s−1), dust growth is limited by fragmentation throughout the entire disk, resulting in a smooth maximum grain size distribution. |
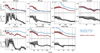 |
Fig. 2 Summary of pebble and gas properties. The pebble surface density (brown) and maximum pebble size (gray) are obtained from multiple-wavelength analysis. The gas surface densities are obtained from modeling based on ALMA observations of CO isotopologues. The blue curves we present here are those where a CO abundance of n(CO)/n(H2) = 10−4 is assumed, which shall be taken as the lower limit of the total gas density, as significant CO depletion could exist (e.g., Zhang et al. 2021). The peaks of continuum rings and the minima of continuum gaps are indicated by solid and dashed vertical lines respectively. |
3 Results
We carry out our analysis on seven disks for which multi-wavelength analysis information is available, based on the same dust opacity (the DSHARP opacity; Birnstiel et al. 2018). The sample consists of HL Tau, TW Hya, and the five Molecules with ALMA at Planet-forming Scales (MAPS) disks (GM Aur, IM Lup, AS 209, HD 163296, and MWC 480). The references providing the disk information used in this work are listed in Table 1. In summary, the pebble surface densities Σp(r), the maximum grain size amax(r), and the temperature profiles to estimate cs are all inferred from multi-wavelength observation analysis. The gas surface densities Σg(r) are based on the intensities of CO isotopologue lines, which assume an abundance of CO equal to the ISM value of n(CO)/n(H2) = 10−4, in other words, no CO depletion (see more discussion below). In Fig. 2, for each disk, pebble densities (red) and gas densities (blue) are plotted in the upper panels. The maximum grain size radial profile amax(r) is presented in the lower panel, where the solid lines are the best fitting results and the shaded regions are 1σ uncertainties. We also mark the peaks of the continuum rings and the minima of continuum gaps with solid and dashed vertical lines, respectively.
With these pebble surface densities, we calculate the Stokes number of the maximum-grain-size pebbles using Eq. (1) by taking ρ•. = 1.675 g cm−3 (the DSHARP opacity; Birnstiel et al. 2018), and the gas surface densities inferred from CO, with n(CO)/n(H2) = 10−4, 10−5, 10−6. These results are indicated by the blue solid lines in Fig. 3, from top to bottom: n(CO)/n(H2) = 10−4, 10−5, 10−6. The CO in the protoplanetary disk is known to be depleted – typically by one or two orders of magnitudes – compared with the ISM CO abundance of 10−4 (e.g., Ansdell et al. 2016; Miotello et al. 2017; Krijt et al. 2020; Zhang et al. 2021). Therefore, the gas surface densities with n(CO)/n(H2) = 10−4 used here should be considered a lower limit, and the Stokes should be considered an upper limit.
However, measuring the gas disk mass is a complex task (see Fig. 10 of Miotello et al. 2023, for a nice illustration on the gas mass of TW Hya in different methods). Therefore, in our calculations, we resort to using the Stokes number with reference gas surface densities obtained by assuming the gas surface density is 100 times the pebble surface density (the red lines in Fig. 3). This assumption implies that the disk maintains a typical ISM metallicity throughout its extent – a practical and broadly applicable assumption –, which is roughly consistent with the metallicity estimated from the CO gas surface density, assuming a moderate CO depletion (Zhang et al. 2021). It is important to note that this gas surface density represents an upper limit because the effects of radial drift will likely lead to local gas-to-dust ratios lower than 100. As a result, the Stokes number presented here should be considered a lower limit. For clarity, we also include the Stokes number of the drifting barrier (with a cut above St = 1 given that gas drag is less important, and these particles would decouple from the turbulence) in green in Fig. 3, depending on which value is smaller. It is noteworthy that the drifting barrier is higher than the inferred Stokes number at all radii, suggesting that the pebble size is primarily set by the fragmentation barrier rather than the drifting barrier. This finding should be especially robust at the ring location, where the pebbles are trapped and the drifting barriers disappear, as shown in Fig. 1.
With the Stokes number and fragmentation velocity, we can therefore obtain the αfrag by assuming υfrag = 1 m s−1 in Eq. (13)
 (14)
(14)
The calculated αfrag are presented in Fig. 4. Table 2 presents a comparison of our findings with those resulting from two alternative methods based on mm and submm line-broadening and continuum gaps. We dashed the τ > 1 region with orange lines, where the data in all wavelengths used in the previous analysis becomes optically thick, and therefore precise pebble sizes cannot be measured. With the exception of Gm Aur, the sources studied here are optically thick in the inner region, where there might be degeneracy between larger particles and higher optical depth (Ricci et al. 2012; Carrasco-González et al. 2019; Macías et al. 2021). However, we note that the CO2 snowline, which is around 50–70 K, is normally within the inner disk region as well. Therefore, in the optically thin region located outside the CO2 snowline, our assumption of υfrag = 1m s−1 should be robust.
An evident outcome of our calculations is that, for the majority of the disks, the inferred turbulence level is on the order of 10−4 in the optically thin region. Furthermore, the observed low turbulence level aligns with constraints derived from alternative methods, as discussed in Rosotti (2023). Our study includes four of the six disks for which line-broadening information is available, see Table 2. Notably, turbulence is not clearly detected through line broadening in HD 163296, TW Hya, and MWC 480, but it is in IM Lup (see Table 1 in Rosotti 2023, and Table 2). The latter, together with HL Tau, display slightly higher levels of turbulence in our analysis. We discuss these two sources individually below.
The low value of αfrag obtained in our calculations represents the turbulent velocity among the maximum-grain-size pebbles at the midplane. As we calculated the reference Stokes number based on a gas-to-dust mass ratio of 100, the inferred turbulence should scale linearly with the actual radial profile of the gas-to-dust mass ratio, which is denoted fg2d(r). In our default setup, where we assume fg2d(r) = 100, we observe a trend indicating higher turbulence at the ring location. However, we anticipate that the value of fg2d(r) will be lower at the ring location because of dust trapping. Whether or not a decrease in fg2d(r) can fully account for the increase in αfrag is unclear. In any case, the pebbles are expected to be more concentrated than the gas, which would mean a gas-to-dust ratio of lower than 100. This would put the true turbulence level lower than this default setup.
In the following, we provide more detailed discussions of three specific sources:
IM Lup. Among the seven disks analyzed in this study, IM Lup exhibits the highest turbulence level at approximately ~10−3, higher than any other source by one order of magnitude. This higher turbulence is consistent with constraints obtained from the direct detection of turbulence through submm line broadening (e.g., Flaherty et al. 2020). This high turbulence could be linked to gravitational instability, a characteristic that has been suggested to be apparent in IM Lup based on the presence of spiral substructures (Huang et al. 2018) and high disk masses (Lodato et al. 2023).
Our measured value is systematically smaller than the gas turbulence value of α ~ 0.01 reported by Flaherty (in prep.). If true, there are two potential explanations for this difference. First, this could indicate a significant Schmidt number (ratio of gas diffusivity to particle diffusivity), larger than the usually used value of around unity (e.g., Youdin & Lithwick 2007). Recent studies by Baehr & Zhu (2021) propose that gravito-turbulent disks exhibit high Schmidt numbers ranging from 10 to 100, which aligns with our findings. On the other hand, our measurement applies to the turbulence level at the pebble-settled midplane; however, the line-broadening measurement probes the line-emission surface. This geometric difference could suggest a vertical diffusivity gradient, in which the midplane is less turbulent than the upper layer; such gradients are triggered by vertical shearing instability (VSI; Stoll & Kley 2016; Flock et al. 2017; Pfeil & Klahr 2021) and/or magnetorotational instability (MRI; e.g., Riols & Lesur 2018; Simon et al. 2018).
HL Tau. As the youngest disk in our sample, HL Tau is widely believed to be a member of Class I (ALMA Partnership et al. 2015). Moreover, recent works identify clear evidence of late-infalling material onto the disk (Yen et al. 2019; Garufi et al. 2022). Both scenarios may suggest that grains in the outer disk have not yet reached the growth barrier, which is consistent with the overall low amax and its decreasing trend with radius in HL Tau (Guerra-Alvarado et al., in prep.). Therefore, our assumption that pebbles all reach the growth barrier may not apply to this source. If indeed this assumption is unmerited, the higher turbulence value we infer in the outer region of HL Tau should be overestimated.
Alternatively, protostellar collapse calculations with dust coagulation show that the fragmentation threshold can be reached almost at the same time as the disk is formed (Tsukamoto et al. 2021; Kawasaki et al. 2022; Lebreuilly et al. 2023). If so, our method may still be valid, and therefore the decreasing pebble size may indeed reflect an increasing turbulence with increasing radius. Indeed, numerical simulations of infalling material onto disks did find a radially increasing turbulence (Lesur et al. 2015; Hennebelle et al. 2016, 2017; Kuznetsova et al. 2022). More intriguingly, the increasing αfrag values we measure here are roughly consistent with the values from the simulation (e.g., see Fig. 6 of Kuznetsova et al. 2022).
HD 163296. The turbulence levels of HD 163296 were previously investigated by Doi & Kataoka (2021) and Liu et al. (2022). By considering the changing optical depth along the line of sight in geometrically thick but optically thin disks, both works analyzed the azimuthal brightness profiles at the two continuum rings, B67 and B100, located at 67 au and 100 au in HD 163296. It was concluded that the turbulence level is low at the outer B100 ring, which is consistent with our findings. However, based on the observation that the brightness of the ring at the major axis is higher than the minor axis, it has been suggested that the pebble scale height is comparable to the gas scale height at the B67 ring. This implies that dust is well coupled with gas and leads to a constraint of α/St ~ 1, with similar results reported in Pizzati et al. (2023). It is important to point out that these three studies constrain only the α/St ratio in the vertical direction, which depends on the Stokes number and can lead to degenerate results in terms of turbulence level estimation. But please see Zagaria et al. (2023) for an attempt to disentangle the coupling by additionally employing that pebbles in the ring are under a quasi-steady state balance between dust trapping and radial diffusion (e.g., Rosotti et al. 2020).
To provide a more comparable analysis, we calculate the αfrag/St value based on Eq. (13) for all of our sources.
 (15)
(15)
The calculated values are presented in Fig. 5. However, with our default parameter values, we find that αfrag/St = 0.003 at the 67 au ring, which is significantly smaller than unity. Therefore, we would require either a higher turbulence level or a lower Stokes number at the B67 ring to match the constraints from dust settling.
The multi-wavelength continuum of HD 163296 has been independently conducted by both Sierra et al. (2021) and Guidi et al. (2022) independently. In both of these studies, the presence of a smooth radial profile in amax is emphasized, which served as motivation for the present investigation. The smooth pebble size variation and enhanced density at the B67 ring leads to a Stokes number of 0.04, which is lower than in other regions of the disk (see Fig. 3), indicating stronger aerodynamic coupling with the gas. However, this value is still too high for the αfrag = 10−4 value at the B67 ring to achieve α/St ~ 1, a value found in other works.
A higher gas-to-dust ratio would decrease St and increase the inferred αfrag, but an increase by a factor of about ~ 18 would be needed to reach α/St ~ 1. Such an increase in the gas-to-dust ratio seems extremely unlikely given that ring substructures should be trapping the pebbles. Another possibility to reconcile the differences in α/St is that the fragmentation velocity at the B67 ring is higher. Notably, the B67 ring location coincides with the CO snowline in HD 163296 (Zhang et al. 2021). Various mechanisms have been proposed to alter pebble properties at snowlines (Zhang et al. 2015; Okuzumi et al. 2016). However, in order to keep a flat amax profile at the ring, this increase in υfrag would need to spatially coincide with a simultaneous increase in αfrag, which seems an unlikely coincidence. Instead, porosity evolution could reduce the internal pebble densities (Okuzumi et al. 2012). If such evolution occurs around the CO snowline, it could also delay pebble settling (Ormel et al. 2007). Alternatively, the inconsistency might again indicate the different turbulence levels at the midplane and puffed-up upper layers, as we suspect for IM Lup. A final possibility is that the B67 ring is, in reality, composed of multiple unresolved rings, or that it has various asymmetries that make the settling analysis invalid. Indeed, this ring presents an arc feature (Isella et al. 2018), which might suggest it hosts a more complex structure than previously thought.
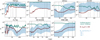 |
Fig. 3 Calculated Stokes number. The blue lines indicate the cases where CO abundance is assumed to be 10−4, 10−5, and 10−6 from top to bottom. The red lines show values when assuming the gas-to-dust ratio is always 100. The green lines mark the drifting barriers Eq. (12) or St = 1, depending on which one is smaller. As we assume the gas-to-dust ratio is equal to 100, Eq. (12) can be simply written as Stdrift = 0.005/η. |
Existing constraints on disk turbulence from submm line broadening αline (Rosotti 2023, and references therein), the inferred αfrag by assuming pebble size is limited by fragmentation (this work), and the αgap constrained from dust settling (Doi & Kataoka 2021; Liu et al. 2022; Pizzati et al. 2023).
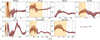 |
Fig. 4 Calculated turbulence αfrag responsible for the fragmentation velocity υfrag = 1 m s−1 and gas-to-dust ratio of 100. An overall low value of 10−4 is found in five out of seven disks. IM Lup appears to show a systemically higher value of ~10−3. An increasing αfrag is found in HL Tau, which could be associated with the late-infalling material; see discussion. The infalling accretion shock impact on the disk traced by SO and SO2 located at 50–100 au (Garufi et al. 2022) is roughly consistent with the B85 ring, where we also find the peak in αfrag. In the region dashed by orange lines, the data in all wavelengths used in the multi-wavelength analysis are optically thick, and therefore the results are less robust. |
4 Discussion
4.1 Spatial resolution
The spatial resolution of the observations could have an effect on the derived pebble sizes and dust surface densities used in our analysis. For instance, the contrast between rings and gaps is expected to be higher if current observations do not fully resolve the rings. This could be the case for MWC 480 in particular, where only Band 3 and Band 6 ALMA continuum data are available, with a relatively large beam size of 35 au at Band 3. Accounting for this caveat, the trend of smooth amax is still clear, with no significant change across the ring or gap. We obtain a low turbulence level of 10−4 in the outer disk where the disk is optically thin in both Band 3 and Band 6. Among the seven disks, TW Hya, because of its proximity (d = 60 pc; Gaia Collaboration 2021), holds the highest spatial resolution, which allows multi-wavelength observations to resolve the complex substructure in the radial profiles of both pebble surface density and maximum grain size. A tentative enhancement of pebble size appears in the rings around 35 and 45 au, although the uncertainty is high. Checking the result of disk turbulence, the inferred dust diffusivity still appears very flat around the value of 10−4 when assuming ƒg2d(r) = 100.
Similarly, the currently limited estimates of gas surface density profiles force us to estimate the Stokes number based on the dust surface density profile and a constant gas-to-dust ratio. However, the gas-to-dust ratio is expected to vary throughout the disk and within its substructures. Robust and high-spatial-resolution measurements of the gas surface density distribution would allow us to circumvent these assumptions.
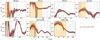 |
Fig. 5 Calculated trapping efficiency αfrag/St responsible for the fragmentation velocity υfrag = 1 m s−1 and gas-to-dust ratio of 100. Notations are the same as Fig. 4. |
4.2 Porosity of pebbles
One limitation of this study is the uncertainty surrounding the specific properties of dust grains, particularly their composition and porosity. These factors can lead to substantial variations in terms of the internal density, opacity, and albedo of the dust (e.g., Min et al. 2016).
For example, porous particles with lower internal density result in a lower Stokes number for a given particle size. Higher levels of porosity could therefore, in principle, result in higher values of αfrag and even higher αfrag/St.
While assuming a different porosity can alter the derived profiles of amax and dust surface density, it is worth noting that a study by Zhang et al. (2023) demonstrated that the dust surface density could increase by a factor of 6 with 90% porous particles, while amax increased by one order of magnitude. This suggests that the impact of porosity on our results would be mitigated by a ‘compensation’ effect between increased amax and decreased internal density. Given the ongoing debate regarding the detailed simulation of porous pebbles, we refrain from attempting to account for the influence of pebble porosity in this work and focus on compact spherical pebbles instead.
4.3 Bouncing barrier
In addition to the fragmentation barrier, another dust growth barrier that can result in constant particle size is the bouncing barrier (Zsom et al. 2010). As a direct consequence of bouncing, pebbles tend to attain similar sizes that remain insensitive to the viscosity and density of the gas. However, the specific size at which bouncing becomes dominant in collisions depends on sticking properties and collision velocities, which remain subjects of ongoing research in laboratory experiments.
Musiolik et al. (2016a) suggested that bouncing could occur when collisional velocities fall within the range of 0.04 to 1 m s−1. Nevertheless, it is essential to note that the presence of different ices coating the pebbles could also influence the bouncing barrier, potentially causing it to shift (Musiolik 2021). For simplicity, we omit the bouncing barrier and rely solely on the parameter υfrag to control collisional growth, aside from drifting.
4.4 Fragmentation velocity
Finally, the most important parameter in this study is the fragmentation threshold defined by the fragmentation velocity υfrag. As Eq. (11) shows, the inferred turbulence  strongly depends on the fragmentation velocity. Our primary choice of υfrag ≤ 1 m s−1 is based on findings from both simulations (e.g, Güttler et al. 2010) and laboratory experiments for silicates (Beitz et al. 2011), cold CO2, H2O, and different mixtures of these Musiolik et al. (2016a,b); Fritscher & Teiser (2021), and for organic materials (Bischoff et al. 2020). A lower υfrag would require significantly lower relative velocity between colliding pebbles to allow the size of the pebbles to grow to the observed size, which would push the turbulence level even lower.
We note that a higher υfrag (as in the more commonly used value of 10 m s−1) would require alphas of the order of 10−2 in order to prevent the significant grain growth at the ring, as shown in Fig. 1a. Such high turbulence is inconsistent with current constraints in the literature (see Fig. 3 of Rosotti 2023, for a recent summary). In Appendix A, we further explore this scenario with additional DustPy simulations. In the simulation with higher υfrag = 10 m s−1 and higher α = 10−2, even though similar maximum grain sizes appear, the radial concentration of pebbles is much weaker. As such, narrower or stronger gas rings would be required to form the narrow dust rings as observed by ALMA, which would lead to a strong one-to-one spatial correlation between the dust rings and gas rings. Nevertheless, such a correlation does not emerge in the MAPS sources (Law et al. 2021; Jiang et al. 2022). We cannot fully exclude moderate υfrag = 3 m s−1 and α = 10−3, though further support from laboratory experiments would be required. If υfrag = 3 m s−1 were used, our results in Fig. 4 would scale up by a factor of 9.
4.5 Implications for dust evolution
The most direct implication of this work is, again, that the maximum pebble size amax in disks (at least inside the rings) is limited by fragmentation. Our finding also serves as direct support to the ‘constant’ Stokes over the disk, as proposed for disks under coagulation-fragmentation equilibrium by Birnstiel et al. (2011).
Under this scenario, by assuming υfrag and αfrag, one can directly get the Stokes number of the largest pebbles, without the need to solve the complex coagulation, fragmentation module, as carried out within Dustpy. In that sense, this method can ease the dust-evolution modeling for cases where the low-mass tail of dust is less important, as in pebble accretion for example (Ormel 2017; Jiang & Ormel 2023), where the planet growth is mostly contributed by the well-settled top-heavy pebbles. The obtained grain sizes and Stokes numbers can also serve as guidance for the parameter choice in hydrodynamic simulations for experiments related to, for example, the streaming instability (Li & Youdin 2021), where the pebble size might have a great impact, but detailed coagulation and fragmentation would be too expensive to couple with the hydrosimulation.
5 Conclusion
We compare dust size properties inferred from the multi-wavelength continuum analysis of seven protoplanetary disks, HL Tau (Guerra-Alvarado et al., in prep.), TW Hya (Macías et al. 2021), and the five MAPS disks (Sierra et al. 2021). As opposed to the prediction of significant grain growth at the pressure maxima, a smooth radial profile of maximum pebble size is found to be a common feature in the outer region in these samples, even at pebble ring locations. The lack of significant grain growth can be attributed to the low fragmentation barrier prevalent in the outer regions of these disks, a result that is in line with recent laboratory experiments, where catastrophic collisional fragmentation is found to happen when the relative velocity between pebbles reaches a level of 1 m s−1. Despite the uncertainty, we propose that the fact that the growth of pebbles is limited by the fragmentation barrier can be used to infer the turbulence level of the protoplanetary disks based on the pebble size and surface densities inferred from multi-wavelength continuum analysis.
Our key finding is the low turbulence level of 10−4(10−3) found in five of the seven disks in our sample when taking υſrag = 1(3) m s−1. This suggests that low-turbulence midplanes might be a common feature in protoplanetary disks. Two clear outliers are identified. Compared with other disks, IM Lup is found to host a relatively high turbulence level, which is consistent with measurements from line broadening. This suggests a different mechanism may be triggering its turbulence, perhaps linked to its gravitationally unstable nature. In this disk, the turbulence level we obtain at the midplane is systematically lower than the turbulence measured at the line-emitting upper layer using a line-broadening analysis, which is a feature consistent with turbulence generated by VSI and/or MRI. A radially increasing trend of turbulence level is found in HL Tau, which might indicate that pebbles have not reached the growth barrier in the outer region of the disk or that the turbulence is enhanced at ~100 au, likely because of the infalling material.
In summary, our study of pebble growth in protoplanetary disks highlights their overall fragility and their residence within the low-turbulence midplanes of protoplanetary disks, regardless of radial drifting. This is in contrast with the traditional view of pebble growth, namely that it is limited by radial drifting in relatively turbulent disks, where the fragmentation barrier is only reached at drifting trapping locations, such as pressure bumps. Our work underscores the significance of pebble-size measurements in protoplanetary disks and emphasizes the profound impact of collisional experiments on our understanding of protoplanetary disk evolution and planet formation. Lastly, we demonstrate that multi-wavelength continuum analysis of protoplanetary disks is a unique approach to constraining not only pebble properties but also disk turbulence.
Acknowledgements
We thank the anonymous referee for their thoughtful and constructive comments. H.J. and E.M. are grateful to Anibal Sierra and Ke Zhang for sharing their MAPS results. The authors would thank Chris Ormel for useful comments. C.C.-G. acknowledges support from UNAM DGAPA-PAPIIT grant IG101321 and from CONACyT Ciencia de Frontera project ID 86372. This work has used Matplotlib (Hunter 2007), Numpy (Harris et al. 2020), DustPy (Stammler & Birnstiel 2022) software packages.
Appendix A Test simulations
Model parameters
We run a group of Dustpy simulations to test and illustrate the robustness of our major assumption, namely that the growth of the pebbles is limited by fragmentation in the sample disks we choose. The parameters we test are listed in Table A.1.
In the first group of simulations in Fig. A.1, we varied the gap-depth amplitude A in Equation (10 (a4f01A05, a4f01A10, a4f01A20). At the density minimum, and therefore pressure minimum, pebbles are quickly drifting away, which leads to both low densities and small pebble sizes. This becomes particularly obvious in the simulation a4f01A20 with A = 2. However, on the other hand, due to the low continuum flux at the gap regions, the pebble-size measurements are also the most unreliable. High-spatial-resolution and high-sensitivity observations are therefore required to fully resolve the rings and gaps. Nevertheless, as the growth of pebbles is always limited by fragmentation at the ring locations, our conclusion at the rings should not be influenced by the choice of the gap amplitude.
We then tested two groups of simulations with different α and υfrag, but keeping  the same to maintain the fragmentation barrier almost constant. In the first group (a4f01A00, a3f03A00, a2f10A00), we conducted our simulation in a smooth gas disk with A = 0, see Fig. A.2. In all of the three simulations, the pebble growth is limited by the fragmentation barrier and, as the maximum pebble sizes scale with
  , the pebbles reach the same size. This would make the initial input indistinguishable if one relies solely on the pebble properties. However, in the second group of tests (a4f01A10, a3f03A10, a2f10A10), we ran the same α and υſrag combinations but in disks with gaps and with A = 1. Clear differences emerge in Fig. A.3. The dust concentration can only happen at the simulations with lower α ≲ 10−3. In the highly turbulent (α = 10−2) simulation, although sticky pebbles (υſrag = 10 m s−1) can still grow to the mm and submm sizes observed by ALMA, dust concentration is less likely to take place, and thus no ring structures are present in the disks.
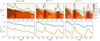 |
Fig. A.1 Simulation outputs at t = 1 Myr for runs with different gap amplitude A. The fragmentation velocities υfrag = 1 m s−1 and the dust diffusivities are set to 10−4 for all three runs. Labels are the same as in Fig. 1. |
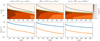 |
Fig. A.2 Simulation outputs at t = 1 Myr for runs with different dust diffusivity and fragmentation velocity in smooth disks (A = 0). The outputs are indistinguishable. Labels are the same as in Fig. 1. |
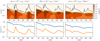 |
Fig. A.3 Simulation outputs at t = 1 Myr for runs with different dust diffusivity and fragmentation velocity in disks with gaps (A = 1). Other setup parameters are the same as Fig. A.2 |
References
- ALMA Partnership, Brogan, C. L., Pérez, L. M., et al. 2015, ApJ, 808, L3 [Google Scholar]
- Ansdell, M., Williams, J. P., van der Marel, N., et al. 2016, ApJ, 828, 46 [Google Scholar]
- Aumatell, G., & Wurm, G. 2014, MNRAS, 437, 690 [CrossRef] [Google Scholar]
- Baehr, H., & Zhu, Z. 2021, ApJ, 909, 136 [NASA ADS] [CrossRef] [Google Scholar]
- Beckwith, S. V. W., Sargent, A. I., Chini, R. S., & Guesten, R. 1990, AJ, 99, 924 [Google Scholar]
- Beitz, E., Güttler, C., Blum, J., et al. 2011, ApJ, 736, 34 [NASA ADS] [CrossRef] [Google Scholar]
- Birnstiel, T., Dullemond, C. P., & Brauer, F. 2010, A&A, 513, A79 [NASA ADS] [CrossRef] [EDP Sciences] [Google Scholar]
- Birnstiel, T., Ormel, C. W., & Dullemond, C. P. 2011, A&A, 525, A11 [NASA ADS] [CrossRef] [EDP Sciences] [Google Scholar]
- Birnstiel, T., Klahr, H., & Ercolano, B. 2012, A&A, 539, A148 [NASA ADS] [CrossRef] [EDP Sciences] [Google Scholar]
- Birnstiel, T., Dullemond, C. P., Zhu, Z., et al. 2018, ApJ, 869, L45 [CrossRef] [Google Scholar]
- Bischoff, D., Kreuzig, C., Haack, D., Gundlach, B., & Blum, J. 2020, MNRAS, 497, 2517 [CrossRef] [Google Scholar]
- Blum, J., & Wurm, G. 2008, ARA&A, 46, 21 [Google Scholar]
- Booth, A. S., & Ilee, J. D. 2020, MNRAS, 493, L108 [NASA ADS] [CrossRef] [Google Scholar]
- Brauer, F., Dullemond, C. P., & Henning, T. 2008, A&A, 480, 859 [NASA ADS] [CrossRef] [EDP Sciences] [Google Scholar]
- Calahan, J. K., Bergin, E., Zhang, K., et al. 2021, ApJ, 908, 8 [NASA ADS] [CrossRef] [Google Scholar]
- Carrasco-González, C., Sierra, A., Flock, M., et al. 2019, ApJ, 883, 71 [Google Scholar]
- D’Alessio, P., Calvet, N., & Hartmann, L. 2001, ApJ, 553, 321 [Google Scholar]
- Doi, K., & Kataoka, A. 2021, ApJ, 912, 164 [NASA ADS] [CrossRef] [Google Scholar]
- Dominik, C., & Tielens, A. G. G. M. 1997, ApJ, 480, 647 [Google Scholar]
- Dullemond, C. P., Birnstiel, T., Huang, J., et al. 2018, ApJ, 869, L46 [NASA ADS] [CrossRef] [Google Scholar]
- Flaherty, K., Hughes, A. M., Simon, J. B., et al. 2020, ApJ, 895, 109 [NASA ADS] [CrossRef] [Google Scholar]
- Flock, M., Nelson, R. P., Turner, N. J., et al. 2017, ApJ, 850, 131 [Google Scholar]
- Fritscher, M., & Teiser, J. 2021, ApJ, 923, 134 [NASA ADS] [CrossRef] [Google Scholar]
- Gaia Collaboration (Brown, A. G. A., et al.) 2021, A&A, 649, A1 [NASA ADS] [CrossRef] [EDP Sciences] [Google Scholar]
- Garufi, A., Podio, L., Codella, C., et al. 2022, A&A, 658, A104 [CrossRef] [EDP Sciences] [Google Scholar]
- Guidi, G., Isella, A., Testi, L., et al. 2022, A&A, 664, A137 [NASA ADS] [CrossRef] [EDP Sciences] [Google Scholar]
- Gundlach, B., Kilias, S., Beitz, E., & Blum, J. 2011, Icarus, 214, 717 [Google Scholar]
- Gundlach, B., Schmidt, K. P., Kreuzig, C., et al. 2018, MNRAS, 479, 1273 [NASA ADS] [CrossRef] [Google Scholar]
- Güttler, C., Blum, J., Zsom, A., Ormel, C. W., & Dullemond, C. P. 2010, A&A, 513, A56 [Google Scholar]
- Harris, C. R., Millman, K. J., van der Walt, S. J., et al. 2020, Nature, 585, 357 [NASA ADS] [CrossRef] [Google Scholar]
- Hennebelle, P., Lesur, G., & Fromang, S. 2016, A&A, 590, A22 [NASA ADS] [CrossRef] [EDP Sciences] [Google Scholar]
- Hennebelle, P., Lesur, G., & Fromang, S. 2017, A&A, 599, A86 [NASA ADS] [CrossRef] [EDP Sciences] [Google Scholar]
- Homma, K. A., Okuzumi, S., Nakamoto, T., & Ueda, Y. 2019, ApJ, 877, 128 [Google Scholar]
- Huang, J., Andrews, S. M., Pérez, L. M., et al. 2018, ApJ, 869, L43 [Google Scholar]
- Hunter, J. D. 2007, Comput. Sci. Eng., 9, 90 [NASA ADS] [CrossRef] [Google Scholar]
- Isella, A., Huang, J., Andrews, S. M., et al. 2018, ApJ, 869, L49 [NASA ADS] [CrossRef] [Google Scholar]
- Jiang, H., & Ormel, C. W. 2023, MNRAS, 518, 3877 [Google Scholar]
- Jiang, H., Zhu, W., & Ormel, C. W. 2022, ApJ, 924, L31 [NASA ADS] [CrossRef] [Google Scholar]
- Kawasaki, Y., Koga, S., & Machida, M. N. 2022, MNRAS, 515, 2072 [NASA ADS] [CrossRef] [Google Scholar]
- Krijt, S., Bosman, A. D., Zhang, K., et al. 2020, ApJ, 899, 134 [NASA ADS] [CrossRef] [Google Scholar]
- Kuznetsova, A., Bae, J., Hartmann, L., & Low, M.-M. M. 2022, ApJ, 928, 92 [NASA ADS] [CrossRef] [Google Scholar]
- Law, C. J., Loomis, R. A., Teague, R., et al. 2021, ApJS, 257, 3 [NASA ADS] [CrossRef] [Google Scholar]
- Lebreuilly, U., Vallucci-Goy, V., Guillet, V., Lombart, M., & Marchand, P. 2023, MNRAS, 518, 3326 [Google Scholar]
- Lesur, G., Hennebelle, P., & Fromang, S. 2015, A&A, 582, L9 [NASA ADS] [CrossRef] [EDP Sciences] [Google Scholar]
- Li, R., & Youdin, A. N. 2021, ApJ, 919, 107 [NASA ADS] [CrossRef] [Google Scholar]
- Liu, Y., Bertrang, G. H. M., Flock, M., et al. 2022, Sci. China Phys. Mech. Astron., 65, 129511 [CrossRef] [Google Scholar]
- Lodato, G., Rampinelli, L., Viscardi, E., et al. 2023, MNRAS, 518, 4481 [Google Scholar]
- Lynden-Bell, D., & Pringle, J. E. 1974, MNRAS, 168, 603 [Google Scholar]
- Macías, E., Espaillat, C. C., Osorio, M., et al. 2019, ApJ, 881, 159 [CrossRef] [Google Scholar]
- Macías, E., Guerra-Alvarado, O., Carrasco-González, C., et al. 2021, A&A, 648, A33 [EDP Sciences] [Google Scholar]
- Min, M., Rab, C., Woitke, P., Dominik, C., & Ménard, F. 2016, A&A, 585, A13 [NASA ADS] [CrossRef] [EDP Sciences] [Google Scholar]
- Miotello, A., van Dishoeck, E. F., Williams, J. P., et al. 2017, A&A, 599, A113 [NASA ADS] [CrossRef] [EDP Sciences] [Google Scholar]
- Miotello, A., Kamp, I., Birnstiel, T., Cleeves, L. C., & Kataoka, A. 2023, ASP Conf. Ser., 534, 501 [NASA ADS] [Google Scholar]
- Miyake, K., & Nakagawa, Y. 1993, Icarus, 106, 20 [NASA ADS] [CrossRef] [Google Scholar]
- Musiolik, G. 2021, MNRAS, 506, 5153 [CrossRef] [Google Scholar]
- Musiolik, G., & Wurm, G. 2019, ApJ, 873, 58 [NASA ADS] [CrossRef] [Google Scholar]
- Musiolik, G., Teiser, J., Jankowski, T., & Wurm, G. 2016a, ApJ, 818, 16 [Google Scholar]
- Musiolik, G., Teiser, J., Jankowski, T., & Wurm, G. 2016b, ApJ, 827, 63 [NASA ADS] [CrossRef] [Google Scholar]
- Nakagawa, Y., Sekiya, M., & Hayashi, C. 1986, Icarus, 67, 375 [Google Scholar]
- Öberg, K. I., Guzmán, V. V., Walsh, C., et al. 2021, ApJS, 257, 1 [CrossRef] [Google Scholar]
- Okuzumi, S., Tanaka, H., Kobayashi, H., & Wada, K. 2012, ApJ, 752, 106 [NASA ADS] [CrossRef] [Google Scholar]
- Okuzumi, S., Momose, M., Sirono, S.-i., Kobayashi, H., & Tanaka, H. 2016, ApJ, 821, 82 [Google Scholar]
- Ormel, C. W. 2017, Formation, Evolution, and Dynamics of Young Solar Systems, The Emerging Paradigm of Pebble Accretion, eds. M. Pessah, & O. Gressel (Berlin: Springer), 445, 197 [NASA ADS] [CrossRef] [Google Scholar]
- Ormel, C. W., & Cuzzi, J. N. 2007, A&A, 466, 413 [NASA ADS] [CrossRef] [EDP Sciences] [Google Scholar]
- Ormel, C. W., Spaans, M., & Tielens, A. G. G. M. 2007, A&A, 461, 215 [NASA ADS] [CrossRef] [EDP Sciences] [Google Scholar]
- Pfeil, T., & Klahr, H. 2021, ApJ, 915, 130 [NASA ADS] [CrossRef] [Google Scholar]
- Pinte, C., Dent, W. R. F., Ménard, F., et al. 2016, ApJ, 816, 25 [Google Scholar]
- Pizzati, E., Rosotti, G. P., & Tabone, B. 2023, MNRAS, 524, 3184 [NASA ADS] [CrossRef] [Google Scholar]
- Poppe, T., Blum, J., & Henning, T. 2000, ApJ, 533, 454 [NASA ADS] [CrossRef] [Google Scholar]
- Ricci, L., Trotta, F., Testi, L., et al. 2012, A&A, 540, A6 [NASA ADS] [CrossRef] [EDP Sciences] [Google Scholar]
- Riols, A., & Lesur, G. 2018, A&A, 617, A117 [NASA ADS] [CrossRef] [EDP Sciences] [Google Scholar]
- Rosotti, G. P. 2023, New Astron. Rev., 96, 101674 [NASA ADS] [CrossRef] [Google Scholar]
- Rosotti, G. P., Teague, R., Dullemond, C., Booth, R. A., & Clarke, C. J. 2020, MNRAS, 495, 173 [Google Scholar]
- Shakura, N. I., & Sunyaev, R. A. 1973, A&A, 500, 33 [NASA ADS] [Google Scholar]
- Sierra, A., Pérez, L. M., Zhang, K., et al. 2021, ApJS, 257, 14 [NASA ADS] [CrossRef] [Google Scholar]
- Simon, J. B., Bai, X.-N., Flaherty, K. M., & Hughes, A. M. 2018, ApJ, 865, 10 [NASA ADS] [CrossRef] [Google Scholar]
- Smoluchowski, M. V. 1916, Z. Phys., 17, 557 [NASA ADS] [Google Scholar]
- Stammler, S. M., & Birnstiel, T. 2022, ApJ, 935, 35 [NASA ADS] [CrossRef] [Google Scholar]
- Stoll, M. H. R., & Kley, W. 2016, A&A, 594, A57 [NASA ADS] [CrossRef] [EDP Sciences] [Google Scholar]
- Teague, R., Bae, J., Bergin, E. A., Birnstiel, T., & Foreman-Mackey, D. 2018, ApJ, 860, L12 [NASA ADS] [CrossRef] [Google Scholar]
- Teague, R., Bae, J., Aikawa, Y., et al. 2021, ApJS, 257, 18 [NASA ADS] [CrossRef] [Google Scholar]
- Teague, R., Bae, J., Andrews, S. M., et al. 2022, ApJ, 936, 163 [NASA ADS] [CrossRef] [Google Scholar]
- Tsukamoto, Y., Machida, M. N., & Inutsuka, S.-i. 2021, ApJ, 920, L35 [NASA ADS] [CrossRef] [Google Scholar]
- Villenave, M., Ménard, F., Dent, W. R. F., et al. 2020, A&A, 642, A164 [EDP Sciences] [Google Scholar]
- Weidenschilling, S. J. 1977, MNRAS, 180, 57 [Google Scholar]
- Windmark, F., Birnstiel, T., Güttler, C., et al. 2012, A&A, 540, A73 [NASA ADS] [CrossRef] [EDP Sciences] [Google Scholar]
- Wurm, G., & Teiser, J. 2021, Nat. Rev. Phys., 3, 405 [CrossRef] [Google Scholar]
- Yen, H.-W., Gu, P.-G., Hirano, N., et al. 2019, ApJ, 880, 69 [NASA ADS] [CrossRef] [Google Scholar]
- Youdin, A. N., & Lithwick, Y. 2007, Icarus, 192, 588 [NASA ADS] [CrossRef] [Google Scholar]
- Zagaria, F., Clarke, C. J., Booth, R. A., Facchini, S., & Rosotti, G. P. 2023, ApJ, 959, L15 [NASA ADS] [CrossRef] [Google Scholar]
- Zhang, K., Blake, G. A., & Bergin, E. A. 2015, ApJ, 806, L7 [Google Scholar]
- Zhang, K., Bergin, E. A., Schwarz, K., Krijt, S., & Ciesla, F. 2019, ApJ, 883, 98 [Google Scholar]
- Zhang, K., Booth, A. S., Law, C. J., et al. 2021, ApJS, 257, 5 [NASA ADS] [CrossRef] [Google Scholar]
- Zhang, S., Zhu, Z., Ueda, T., et al. 2023, ApJ, 953, 96 [NASA ADS] [CrossRef] [Google Scholar]
- Zsom, A., Ormel, C. W., Güttler, C., Blum, J., & Dullemond, C. P. 2010, A&A, 513, A57 [NASA ADS] [CrossRef] [EDP Sciences] [Google Scholar]
- Zsom, A., Ormel, C. W., Dullemond, C. P., & Henning, T. 2011, A&A, 534, A73 [NASA ADS] [CrossRef] [EDP Sciences] [Google Scholar]
We refer to the DustPy documentation (https://stammler.github.io/dustpy/index.html) for details of the code.
All Tables
Existing constraints on disk turbulence from submm line broadening αline (Rosotti 2023, and references therein), the inferred αfrag by assuming pebble size is limited by fragmentation (this work), and the αgap constrained from dust settling (Doi & Kataoka 2021; Liu et al. 2022; Pizzati et al. 2023).
All Figures
|
Fig. 1 Simulation outputs at t = 1 Myr for runs with different fragmentation velocities υfrag = 10, 3, and 1 m s−1 (from left to right). The dust diffusivities are set to be 1−4 for all three runs. In the upper panels, the gray lines mark the drifting barrier, while the green lines mark the fragmentation barrier in each simulation. The orange contours represent the dust densities at each grain size. The lower panels display the radial profiles of gas (blue) and dust (orange) total column densities. In cases of high fragmentation velocity, particle size increases significantly at the ring location. Yet, for fragile dust (υfrag = 1m s−1), dust growth is limited by fragmentation throughout the entire disk, resulting in a smooth maximum grain size distribution. |
| In the text | |
|
Fig. 2 Summary of pebble and gas properties. The pebble surface density (brown) and maximum pebble size (gray) are obtained from multiple-wavelength analysis. The gas surface densities are obtained from modeling based on ALMA observations of CO isotopologues. The blue curves we present here are those where a CO abundance of n(CO)/n(H2) = 10−4 is assumed, which shall be taken as the lower limit of the total gas density, as significant CO depletion could exist (e.g., Zhang et al. 2021). The peaks of continuum rings and the minima of continuum gaps are indicated by solid and dashed vertical lines respectively. |
| In the text | |
|
Fig. 3 Calculated Stokes number. The blue lines indicate the cases where CO abundance is assumed to be 10−4, 10−5, and 10−6 from top to bottom. The red lines show values when assuming the gas-to-dust ratio is always 100. The green lines mark the drifting barriers Eq. (12) or St = 1, depending on which one is smaller. As we assume the gas-to-dust ratio is equal to 100, Eq. (12) can be simply written as Stdrift = 0.005/η. |
| In the text | |
|
Fig. 4 Calculated turbulence αfrag responsible for the fragmentation velocity υfrag = 1 m s−1 and gas-to-dust ratio of 100. An overall low value of 10−4 is found in five out of seven disks. IM Lup appears to show a systemically higher value of ~10−3. An increasing αfrag is found in HL Tau, which could be associated with the late-infalling material; see discussion. The infalling accretion shock impact on the disk traced by SO and SO2 located at 50–100 au (Garufi et al. 2022) is roughly consistent with the B85 ring, where we also find the peak in αfrag. In the region dashed by orange lines, the data in all wavelengths used in the multi-wavelength analysis are optically thick, and therefore the results are less robust. |
| In the text | |
|
Fig. 5 Calculated trapping efficiency αfrag/St responsible for the fragmentation velocity υfrag = 1 m s−1 and gas-to-dust ratio of 100. Notations are the same as Fig. 4. |
| In the text | |
|
Fig. A.1 Simulation outputs at t = 1 Myr for runs with different gap amplitude A. The fragmentation velocities υfrag = 1 m s−1 and the dust diffusivities are set to 10−4 for all three runs. Labels are the same as in Fig. 1. |
| In the text | |
|
Fig. A.2 Simulation outputs at t = 1 Myr for runs with different dust diffusivity and fragmentation velocity in smooth disks (A = 0). The outputs are indistinguishable. Labels are the same as in Fig. 1. |
| In the text | |
|
Fig. A.3 Simulation outputs at t = 1 Myr for runs with different dust diffusivity and fragmentation velocity in disks with gaps (A = 1). Other setup parameters are the same as Fig. A.2 |
| In the text | |
Current usage metrics show cumulative count of Article Views (full-text article views including HTML views, PDF and ePub downloads, according to the available data) and Abstracts Views on Vision4Press platform.
Data correspond to usage on the plateform after 2015. The current usage metrics is available 48-96 hours after online publication and is updated daily on week days.
Initial download of the metrics may take a while.