Fig. 1
Download original image
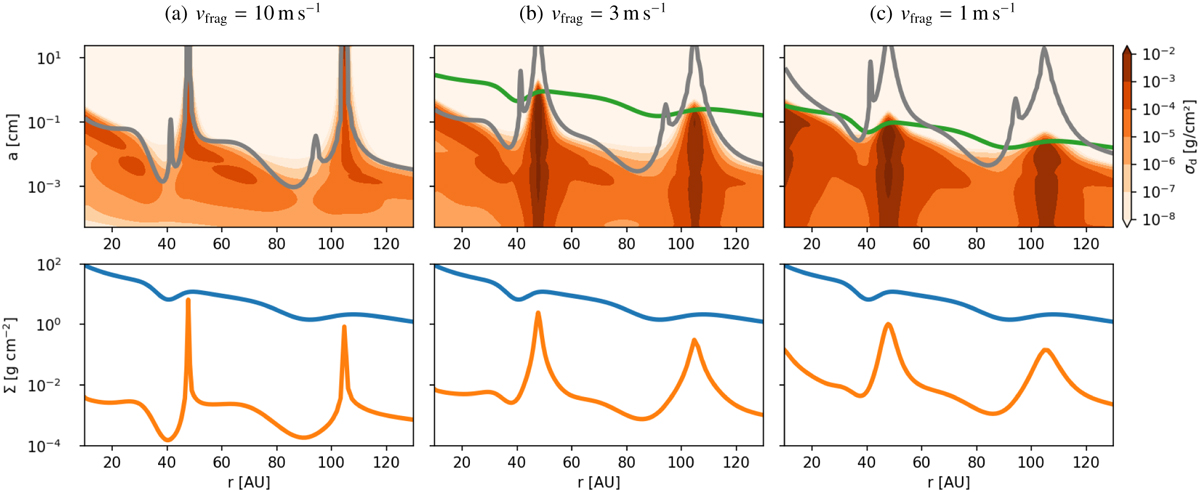
Simulation outputs at t = 1 Myr for runs with different fragmentation velocities υfrag = 10, 3, and 1 m s−1 (from left to right). The dust diffusivities are set to be 1−4 for all three runs. In the upper panels, the gray lines mark the drifting barrier, while the green lines mark the fragmentation barrier in each simulation. The orange contours represent the dust densities at each grain size. The lower panels display the radial profiles of gas (blue) and dust (orange) total column densities. In cases of high fragmentation velocity, particle size increases significantly at the ring location. Yet, for fragile dust (υfrag = 1m s−1), dust growth is limited by fragmentation throughout the entire disk, resulting in a smooth maximum grain size distribution.
Current usage metrics show cumulative count of Article Views (full-text article views including HTML views, PDF and ePub downloads, according to the available data) and Abstracts Views on Vision4Press platform.
Data correspond to usage on the plateform after 2015. The current usage metrics is available 48-96 hours after online publication and is updated daily on week days.
Initial download of the metrics may take a while.