Fig. 2
Download original image
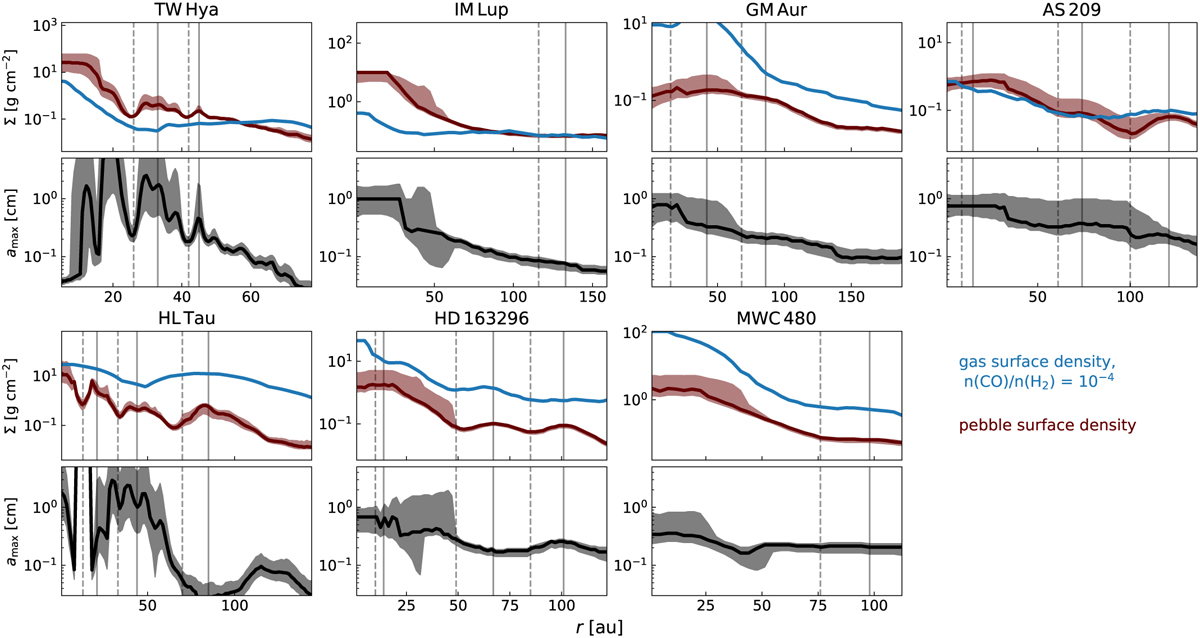
Summary of pebble and gas properties. The pebble surface density (brown) and maximum pebble size (gray) are obtained from multiple-wavelength analysis. The gas surface densities are obtained from modeling based on ALMA observations of CO isotopologues. The blue curves we present here are those where a CO abundance of n(CO)/n(H2) = 10−4 is assumed, which shall be taken as the lower limit of the total gas density, as significant CO depletion could exist (e.g., Zhang et al. 2021). The peaks of continuum rings and the minima of continuum gaps are indicated by solid and dashed vertical lines respectively.
Current usage metrics show cumulative count of Article Views (full-text article views including HTML views, PDF and ePub downloads, according to the available data) and Abstracts Views on Vision4Press platform.
Data correspond to usage on the plateform after 2015. The current usage metrics is available 48-96 hours after online publication and is updated daily on week days.
Initial download of the metrics may take a while.